
Market Overview
| Study Period | 2020 - 2031 |
|---|---|
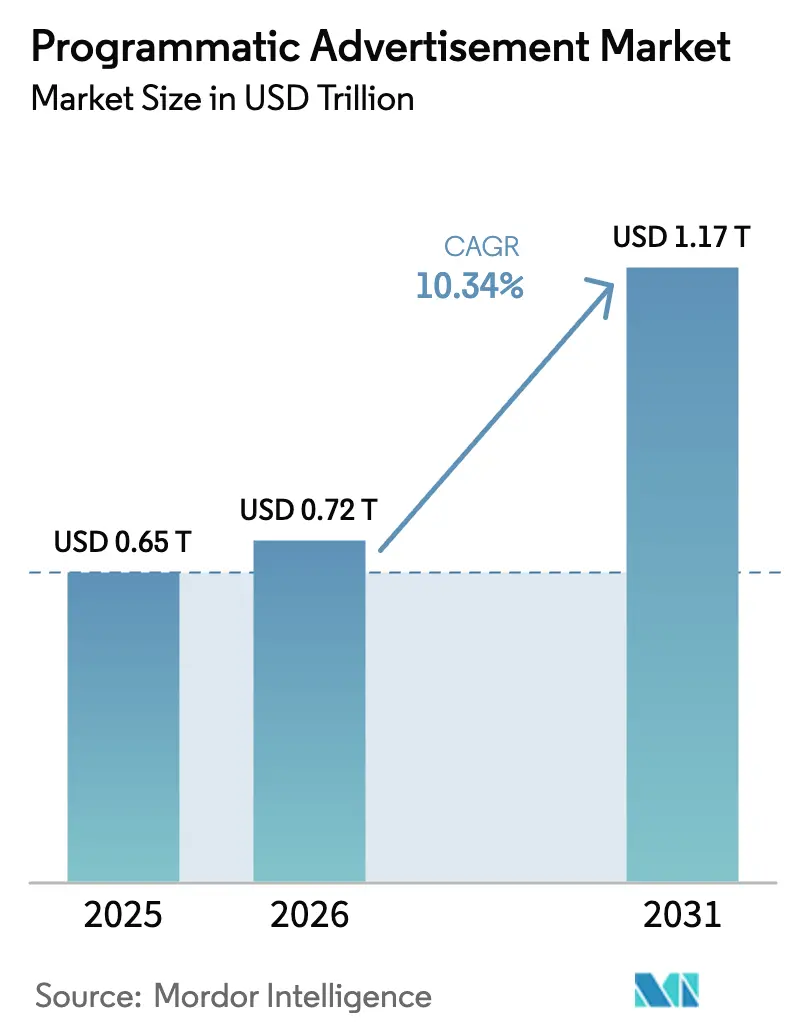
| Market Size (2026) | USD 0.72 Trillion |
| Market Size (2031) | USD 1.17 Trillion |
| Growth Rate (2026 - 2031) | 10.34 % |
| Fastest Growing Market | Asia Pacific |
| Largest Market | North America |
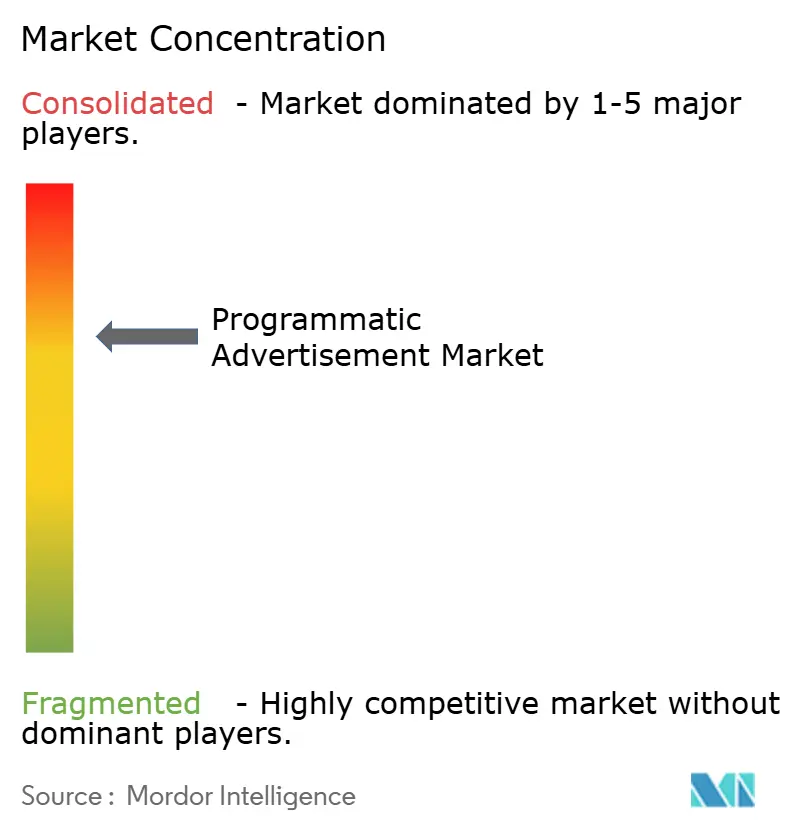
| Market Concentration | Medium |
Major Players *Disclaimer: Major Players sorted in no particular order Image © Mordor Intelligence. Reuse requires attribution under CC BY 4.0. | |
Programmatic Advertisement Market Analysis by Mordor Intelligence
Programmatic advertising market size in 2026 is estimated at USD 0.72 trillion, growing from 2025 value of USD 0.65 trillion with 2031 projections showing USD 1.17 trillion, growing at 10.34% CAGR over 2026-2031. Automated buying now serves as the core operating system for digital media, expanding beyond open-exchange display into streaming television, retail media, and digital out-of-home environments. Buyers that lean on real-time optimisation report higher return on ad spend, prompting even conservative brand teams to shift budgets from manual insertion orders. Liquidity created by this migration lifts fill rates and average clearing prices, which in turn encourages fresh investments in optimisation technology and reduces the minimum viable scale for smaller advertisers to compete. Over the forecast horizon, the programmatic advertising market will converge formats and devices into single-workflow buying, with privacy regulation accelerating contextual intelligence and clean-room adoption to offset third-party-cookie loss. Emerging economies, unburdened by legacy ad-tech, are moving directly to cloud-native stacks, helping to sustain double-digit revenue growth, while transparent, auditable supply chains are expected to capture a disproportionate share as buyers reward measurable accountability.
Key Report Takeaways
- By trading platform, Real-Time Bidding led with 41.30% of programmatic advertising market share in 2025, while Programmatic Guaranteed is projected to expand at a 24.15% CAGR between 2026-2031.
- By advertising channel, display banners accounted for 34.25% share of the programmatic advertising market size in 2025, whereas programmatic video is forecast to climb at a 25.1% CAGR to 2031.
- By device, mobile commanded 62.20% of programmatic advertising market share in 2025; smart-TV impressions are expected to rise at an 17.95% CAGR through 2031.
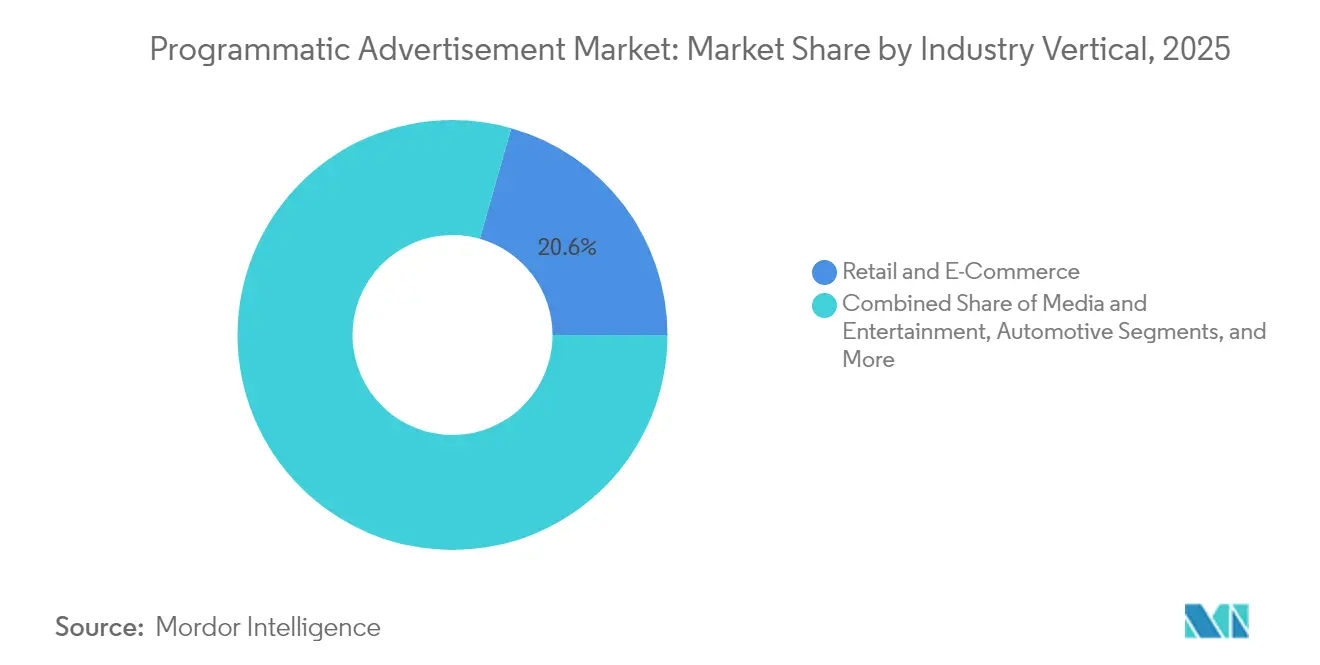
- By industry vertical, Retail & E-Commerce held 20.60% share of the programmatic advertising market size in 2025, while Media & Entertainment is advancing at a 13.74% CAGR to 2031.
- By enterprise size, large enterprises contributed 67.30% of spend in 2025, whereas SMB outlays are set to increase at a 14.66% CAGR through 2031.
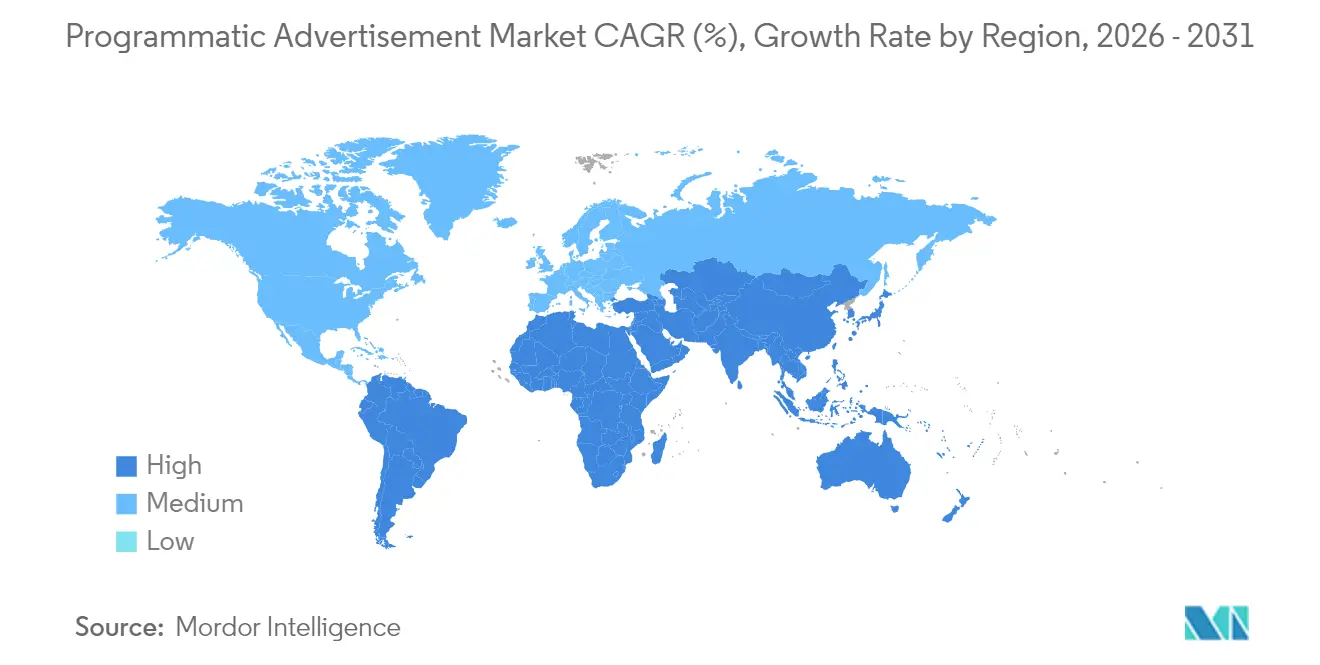
- By geography, North America maintained 37.50% programmatic advertising market share in 2025; Asia-Pacific is the fastest-growing region at a 12.3% CAGR to 2031.
Note: Market size and forecast figures in this report are generated using Mordor Intelligence’s proprietary estimation framework, updated with the latest available data and insights as of 2026.
Market Trends and Insights
Drivers Impact Analysis of Programmatic Advertisement Market*
| Driver | (~) % Impact on CAGR Forecast | Geographic Relevance | Impact Timeline |
|---|---|---|---|
| Premium Inventory Migration to Private Marketplaces Fuelling CPMs | +2.1% | Global, with higher impact in North America and Europe | Medium term (3-4 yrs) |
| AI-Driven Bid Optimisation Elevating ROAS in Europe | +1.8% | Europe, North America, with spillover to APAC | Medium term (3-4 yrs) |
| Connected-TV Programmatic Surge in the US and Japan | +2.4% | US, Japan, with growing impact in Europe | Short term (≤2 yrs) |
| Retail-Media First-Party Data Unlocking Budgets | +1.5% | Global, with highest impact in North America | Medium term (3-4 yrs) |
| Contextual Targeting Renaissance Post-Cookie | +1.2% | Global | Medium term (3-4 yrs) |
| 5G-Enabled Real-Time Mobile RTB Growth in Asia | +0.9% | APAC core, with spillover to emerging markets | Long term (≥5 yrs) |
| Source: Mordor Intelligence | |||
Premium Inventory Migration to Private Marketplaces
Premium publishers continued to shift flagship inventory into invitation-only environments throughout 2024, lifting average clearing prices as brand-safety assurances Magnite. Buyers and sellers alike increasingly default to private deals because closed auctions combine higher revenue certainty with reduced fraud exposure. One global news outlet bundled live-event slots with lifestyle content in early 2025 and secured CPMs more than one-third above its open-exchange rate. The structural outcome is that remnant impressions will remain in open exchanges while high-value supply gravitates to curated marketplaces, effectively redrawing liquidity maps. As this migration gains momentum, transparent supply paths and auditable reporting standards become table stakes for premium demand.
AI-Driven Bid Optimisation
Machine-learning models that predict post-click value moved from pilot to mainstream in 2024 and were embedded across leading demand-side platforms by Q1 2025 [1]. A European subscription service recorded a 35% uplift in six-month revenue per advertising dollar after applying lifetime-value-weighted bidding, and retailers now adjust bids based on SKU-level margin contribution. These examples show management focus pivoting from cost control to growth acceleration as algorithms refine bid prices in real time. The net effect is a redefinition of success metrics around incremental profit rather than impressions served, deepening the reliance on data-science talent within in-house media teams. Competitive advantage increasingly hinges on proprietary predictive datasets coupled with fast feedback loops.
Connected-TV Programmatic Surge
CTV inventory expanded rapidly in 2024, with programmatic transactions reaching three-quarters of all impression-level buys within the channel [2]. A major smart-TV operating-system owner documented a 40% revenue gain after implementing a direct supply-path model that links buyers straight to device-level inventory. In Japan, average daily streamed content minutes overtook broadcast TV for the first time in January 2025, underscoring the shift in living-room behaviour. Advertisers increasingly treat CTV as a performance channel, marrying household exposure data with commerce signals to close measurement loops. As more broadcasters enable programmatic guaranteed in long-form content, CTV pricing power is likely to rise, reinforcing its centrality in omnichannel strategies.
Retail-Media First-Party Data Unlocking Budgets
Supermarkets, marketplaces, and specialty retailers commercialised rich shopper graphs via self-serve portals throughout 2024, making SKU-level targeting mainstream. A consumer-electronics brand that blended a retailer’s purchase data with programmatic CTV doubled attributable sales during a 2025 back-to-school campaign. Closed-loop reporting shortens learning cycles, drives repeat budgets, and positions retailers as full-funnel media owners. As more chains embed clean-room integrations, deterministic purchase data will flow into cross-channel bidding, tightening the feedback loop between exposure and transaction. This data privilege is poised to shift budget share from open web display to retailer-owned ecosystems
Restraints Impact Analysis of Programmatic Advertisement Market*
| Restraint | (~) % Impact on CAGR Forecast | Geographic Relevance | Impact Timeline |
|---|---|---|---|
| Third-Party-Cookie Loss Shrinking ID Pools in Europe | -1.7% | Europe, with spillover to North America | Short term (≤2 yrs) |
| Ad-Fraud and Supply-Chain Opacity in Emerging Markets | -1.1% | Emerging Markets, particularly APAC and Latin America | Long term (≥5 yrs) |
| Programmatic Talent Scarcity Among SMB Advertisers | -0.8% | Global, with higher impact in emerging markets | Medium term (3-4 yrs) |
| Divergent Privacy Laws Stalling Cross-Border Buys | -0.6% | Global, with highest impact in cross-border campaigns | Long term (≥5 yrs) |
| Source: Mordor Intelligence | |||
Third-Party-Cookie Loss Shrinking ID Pools in Europe
Europe’s stringent privacy regime accelerated identifier contraction in 2024 when a multi-market publisher group reported a 20% drop in third-party IDs immediately after new policy enforcement. Half of that loss was recovered through first-party sign-ins and encrypted email hashes, leading to higher win rates and lower impression waste for participating advertisers. Smaller yet consented audiences demonstrate scalable outcomes, indicating that addressability anchored in publisher relationships will shape future targeting frameworks. Nonetheless, transition costs and measurement disruptions constrain short-term growth, shaving an estimated 1.7 percentage points from the projected CAGR across the programmatic advertising market.
Ad-Fraud and Supply-Chain Opacity in Emerging Markets
Invalid traffic remains elevated where verification layers are thin. A 2024 benchmark showed effective reach on loosely curated supply paths improving from 36% to 44% year on year, but still leaving more than half of the impressions of dubious value MediaPost. In early 2025 a South-East-Asian buyer consortium employed inclusion lists across mobile web and achieved a 40% viewability lift while cutting fraud flags by one-third. Although curated buying mitigates risk, it raises operational complexity for smaller advertisers. Persistently opaque inventory could subtract 1.1 percentage points from the global growth rate until verification standards converge with mature-market norms.
*Our forecasts treat driver/restraint impacts as directional, not additive. The impact forecasts reflect baseline growth, mix effects, and variable interactions.
Programmatic Advertisement Market Segment Analysis
By Trading Platform:
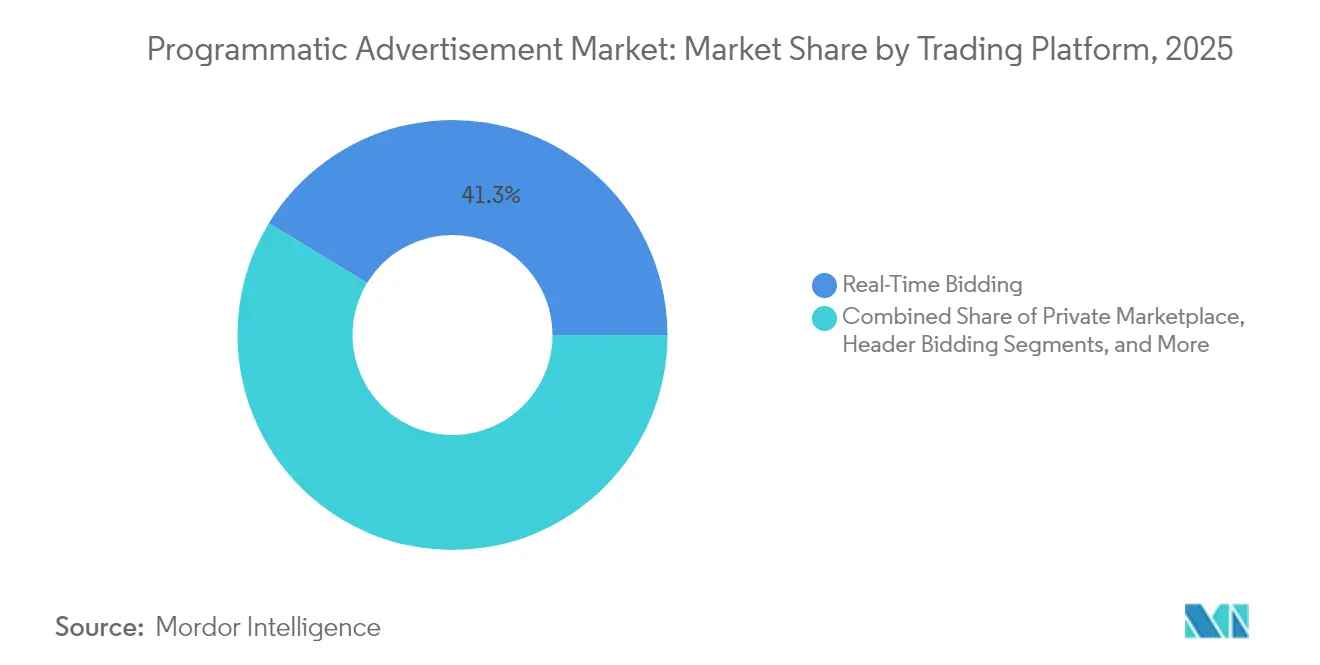
Hybrid Paths Redefine Deal MixReal-Time Bidding accounted for 41.30% of programmatic advertising market share in 2025, underscoring its prominence for incremental reach. Yet the segment’s proportion is gradually declining as Programmatic Guaranteed accelerates at a 24.15% CAGR to 2031, reflecting advertiser demand for fixed-price certainty in premium slots. Publishers that bundled episodic content and live news into guaranteed portfolios sold out weeks ahead of schedule, demonstrating latent demand for assured delivery. A hybrid future is emerging in which buyers maintain open auctions for scale while reserving strategic moments through guaranteed pipes, increasing platform diversification. Supply-side partners are therefore expanding APIs to accommodate multi-deal-type execution in a single workflow.
Programmatic advertising market participants recognise that guaranteed deals improve forecast accuracy and yield stability, attracting brand dollars once confined to linear television. Meanwhile, real-time auctions continue to innovate with bid-shading and floor-price automation. The coexistence of these paths encourages technology vendors to develop consolidated dashboards that visualise performance across deal types, reducing operational friction. Over the forecast period, trading partners that deliver cross-channel, multi-deal governance will capture outsized wallet share, particularly from brands centralising omnichannel budgets.

By Advertising Channel / Format:
Video Overtakes Display in Growth ContributionDisplay banners still represented 34.25% of impressions and remain indispensable for retargeting and frequency balancing. Nevertheless, programmatic video is set to capture the dominant share of incremental spend as its market size grows at a 25.1% CAGR through 2031. Short-form content on social feeds complements long-form streaming on living-room screens, forming contiguous video journeys that multiply touchpoints throughout the day. A European automotive brand combined vertical video with adaptive six-second bumpers and saw visit intent rise 28%, illustrating creative synergies.
As buyers integrate rich-media, audio, and emerging immersive units into unified video budgets, the programmatic advertising market size attached to video formats is poised to widen further. Measurement vendors are responding with unified reach curves that aggregate connected-TV, mobile, and out-of-home exposures into a single, deduplicated metric set. The cross-format orchestration of creative assets now differentiates leading campaigns from median performers, spurring agencies to invest in cloud-based asset-versioning and AI-driven editing suites.
By Device:
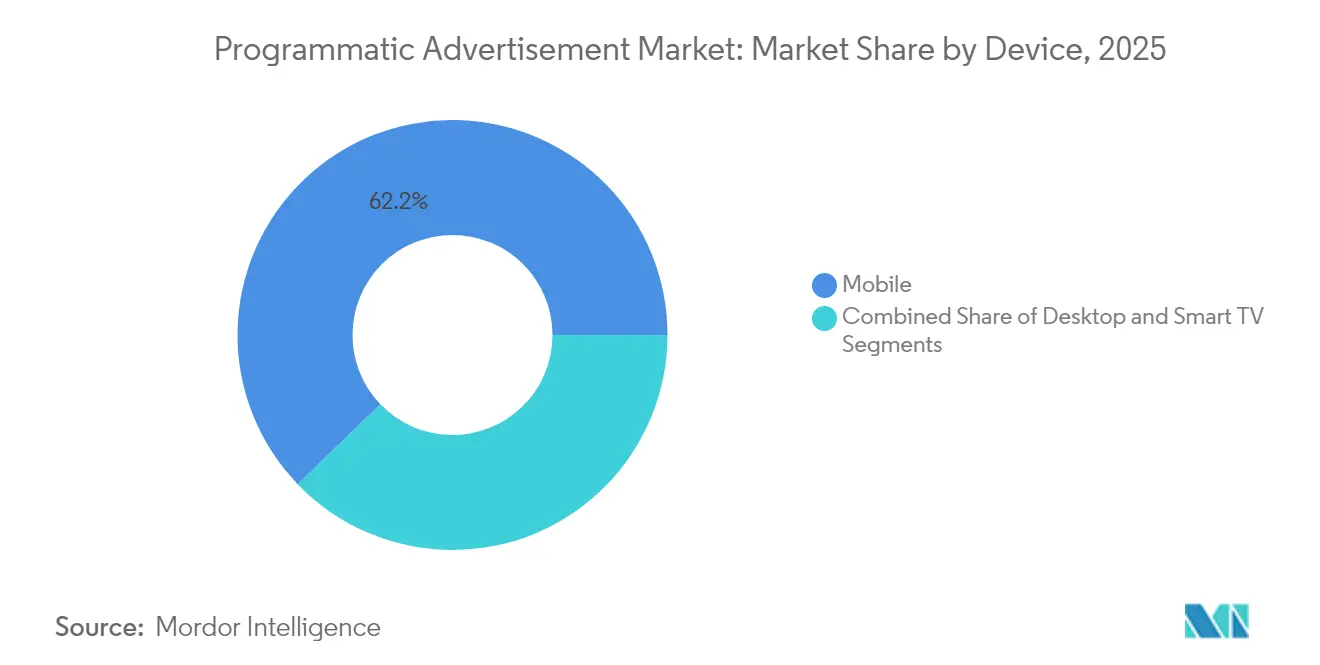
Mobile Dominates, Smart-TV AcceleratesMobile devices delivered 62.20% of global impression volume in 2025, reflecting smartphone ubiquity and durable app engagement. Smart-TV sets, however, represent the fastest-growing endpoint, projected to expand at an 17.95% CAGR to 2031. A sporting-goods retailer’s January 2025 initiative used smart-TV prospecting followed by mobile retargeting within two hours, producing a 23% lift in in-app conversions. Cross-device identity resolution, therefore, becomes indispensable for sequential storytelling.
Programmatic advertising market size attributed to desktop remains meaningful for high-consideration purchases in finance and travel, where larger screens aid form completion. Yet as privacy frameworks restrict user-level identifiers, deterministic device graphs anchored in opt-in environments gain prominence. Vendors able to string together household-level smart-TV exposures with individual mobile signal trails will command premium CPMs, elevating the strategic value of proprietary device graphs.
By Industry Vertical:
Retail Retains Scale, Media Leads GrowthRetail & E-Commerce controlled 20.60% of the programmatic advertising market size in 2025 by leveraging shopper-level data to inform bidding and creative sequences. A 2025 flash sale from a fashion marketplace, powered by live-countdown banners and purchase-probability algorithms, doubled daily revenue against control, reaffirming commerce-media momentum. Media & Entertainment, while smaller in absolute spend, is the fastest-growing vertical at a 13.74% CAGR as streaming services unlock tier-one inventory.
Financial services, automotive, and healthcare verticals are accelerating programmatic adoption yet face complex compliance constraints. Financial advertisers increasingly collaborate with publishers in encrypted environments to match first-party data without leaking personal identifiers. As deterministic data becomes ubiquitous, vertical-specific creative frameworks and measurement currencies will expand, creating bespoke demand for specialist agencies.
By Enterprise Size:
SMBs Close Capability GapLarge enterprises generated 67.30% of programmatic spend in 2025, enabled by in-house trading desks and clean-room platforms that connect loyalty data to publisher signals. Still, SMB spending is forecast to grow at a 14.66% CAGR through 2031. A midwestern home-improvement chain that tested an AI budget-allocation tool in early 2025 cut cost-per-lead by 30% within three weeks, showcasing the democratisation of sophisticated optimisation.
Cloud-native self-serve interfaces launched during the 2024 holiday campaigns lowered entry barriers, letting SMBs tap the programmatic advertising market infrastructure once reserved for global conglomerates. Payment-on-delivery models and templated creative further reduce barriers, fostering a more diverse auction landscape. Vendors that facilitate low-friction onboarding and automated brand-safety controls will be best positioned to capture the long tail of advertisers.
Geography Analysis
North America Programmatic Advertisement Market
North America sustained a 37.50% programmatic advertising market share in 2025, cementing its status as the largest regional hub. Political election cycles injected fresh funds that remained in automated workflows after proving efficient. Supply-path optimisation continues to shorten the distance between publisher and buyer, lifting publisher yield and lowering demand-side fees. Transparent routes are expected to lock in buyer loyalty, reinforcing the region’s role as the test bed for new measurement standards such as clean-room-based reach verification and outcome reporting.
APAC Programmatic Advertisement Market
Asia-Pacific is forecast to expand at a 12.3% CAGR to 2031, making it the fastest-growing region by a clear margin. Mobile-first consumer behavior and rapid e-commerce adoption fuel impression liquidity, especially in India and Indonesia, where app-centric ecosystems bypass desktop legacies. A Southeast-Asian streaming app’s real-time ad insertion during 2025 sporting events achieved record view-through rates, highlighting regional readiness for advanced server-side ad insertion. Governments are drafting privacy statutes modelled on European precedents, prompting vendors to embed consent frameworks from inception. This proactive compliance stance could yield a structurally cleaner supply pool than mature markets faced in earlier growth waves.
EMEA and LATAM Programmatic Advertisement Market
Europe remains pivotal despite stricter regulations that trimmed third-party-cookie pools. Publishers double down on authenticated traffic, and early encrypted-email-hash collaborations delivered a 17% boost in qualified banking applications versus cookie-based retargeting. Although compliance raises operational overhead, deterministic addressability is stabilising performance, keeping the programmatic advertising market size in the region on a mid-single-digit growth path. Latin America and the Middle East and Africa trail in absolute spend but register rapid relative growth, driven by smartphone penetration and urban out-of-home digitisation. Investors are funnelling capital into regional verification start-ups, signalling advertiser confidence in medium-term scalability.
Regulatory Landscape
Programmatic advertising compliance is tightening around transparency, data minimization, and platform conduct, which is reshaping how campaigns are targeted, measured, and reported across exchanges, DSPs, and SSPs. In the European Union, Regulation (EU) 2024/900 on transparency and targeting of political advertising reached full application in October 2025, and the European Commission followed with Implementing Regulation (EU) 2026/818 in April 2026 to define technical arrangements for a European repository for online political advertisements (common data structure, standardized metadata, and API expectations). For adtech and publishers serving political inventory, these requirements raise the operational bar and increase demand for auditable supply paths and standardized reporting.
In North America and the UK, policy signals and enforcement continue to influence addressability strategies. The US Federal Trade Commission has emphasized constraints around sensitive data, including location, through actions such as its January 2024 ban involving X-Mode Social, Inc. and Outlogic, LLC, reinforcing the need to avoid prohibited data uses and to strengthen consent and governance around high-risk signals. In May 2026, the UK Information Commissioner's Office published advice to government on possible changes to PECR Regulation 6, including discussion of exemptions for low-risk online advertising while retaining consent requirements for intrusive tracking. This direction affects how vendors prioritize contextual intelligence, consent tooling, and privacy-preserving measurement in Europe-oriented buying operations.
Competitive Landscape
Integrated platform ecosystems and independent point solutions coexist, shaping a competitive field defined by data-scale and transparency trade-offs. In February 2025, a content-recommendation network closed a USD 900 million acquisition of a global video technology firm, creating an omnichannel marketplace that touches more than 2 billion monthly users [3]. The deal demonstrates how horizontal scale across formats becomes a defensive moat as buyers demand consolidated reach.
Identity and measurement infrastructure form the second pillar of consolidation. In January 2025, a global data-services firm acquired an identity-activation company to merge publisher first-party data with credit-file precision. The integration underscores market preference for privacy-compliant addressability built on durable identifiers. Supply-side optimisation also saw activity: a telecommunications company bought a digital-out-of-home technology provider for USD 600 million, planning to mesh subscriber insights with roadside screen inventory[4]. Such moves aim to simplify ad delivery logistics and secure incremental publisher share in high-growth sub-channels.
Cross-industry partnerships that blend proprietary datasets with bidding technology have intensified. A self-serve supply-side vendor joined forces with a small-business accounting-software provider to feed anonymised transactional insights into biddable segments, improving B2B conversion propensity PubMatic. With high-fidelity consented signals emerging as the defining competitive asset, firms that control premium first-party data—and the pipes that activate it—are positioned to set trading terms. Independent demand-side technology platforms continue to differentiate through transparency, offering buyer-controlled algorithms and log-level data access that large walled gardens restrict.
Programmatic Advertisement Industry Leaders
-
War Room Holdings, Inc
-
MediaMath
-
Digilant
-
Fyber N.V.
-
SmartyAds
- *Disclaimer: Major Players sorted in no particular order
Programmatic Advertisement Market Companies Covered in this Report
- Alphabet Inc. (Google Ads)
- Meta Platforms, Inc.
- Amazon.com, Inc.
- The Trade Desk, Inc.
- Magnite, Inc.
- PubMatic, Inc.
- Index Exchange, Inc.
- Verizon Communications Inc. (Yahoo)
- Adobe Inc.
- Microsoft Corp. (Xandr)
- MediaMath Inc.
- War Room Holdings, Inc.
- Digilant
- Fyber N.V.
- SmartyAds
- Choozle, Inc.
- Zeta Global Holdings Corp.
- Criteo S.A.
- Roku, Inc.
- AppLovin Corp.
- OpenX Technologies, Inc.
- TripleLift, Inc.
- Adform A/S
Market Opportunities and Future Outlook
A near-term whitespace is emerging around automation layers that make privacy-safe buying and quality governance easier to execute across fragmented supply. In March 2026, Google announced Gemini AI integration as an operating layer for DV360, and in June 2026 Magnite launched Magnite Orchestration, positioning agent-to-agent workflows closer to premium supply. At the same time, industry infrastructure for autonomous buying agents expanded around Cannes Lions, with companies such as DoubleVerify, LiveRamp, Pixalate, Mediaocean, Magnite, Yahoo, Stagwell, and Fox tied to agentic products or enabling layers, which raises demand for interoperability, brand-safety controls, and measurement that works without third-party cookies.
Supply-path quality and curated access are also creating room for private marketplaces and programmatic guaranteed to gain share as open-web dynamics shift. The ANA reported (Q4 2025 findings published February 2026) that advertisers with strict quality governance achieved 56.7% qualified programmatic impressions versus 37.5% for lower-performing peers, which supports spend concentration toward transparent, governable inventory and verification. Publisher ad supply pressure tied to AI-driven zero-click behavior also appeared in Q2 2026 tracking by Ozone, showing 32-37% year-on-year decreases in publisher ad requests in the US and 39-41% in the UK. That pattern increases the value of resilient, authenticated publisher supply and retail media first-party data as addressable inputs. Regulatory intensity adds another opportunity layer for neutral tooling, including a March 2026 European Commission decision against Google related to programmatic display ad intermediation, which keeps transparency and competition in buy-side and sell-side plumbing in focus.
Recent Industry Developments in Programmatic Advertisement Market
- June 2026: Magnite launched Magnite Orchestration to integrate buyer and seller agents with premium supply. The launch highlights the shift toward agentic execution in programmatic workflows, pushing orchestration and decisioning closer to curated inventory and strengthening the role of SSP-side automation in deal execution.
- February 2026: Fyber N.V. and MediaMath were identified as establishing a channel partnership. The tie-up broadens integration options for buyers and sellers navigating a more complex supply chain, and it underscores how ecosystem connectivity remains a competitive lever for independent platforms.
- February 2025: Outbrain completed its acquisition of Teads for USD 900 million, forming an omnichannel outcome-driven platform spanning multiple formats. The combination increases consolidated reach and cross-format packaging power, raising the competitive bar for standalone vendors that lack scaled supply and demand relationships.
Programmatic Advertisement Market Report Scope and Research Methodology
Market Definition and Coverage
We size the global programmatic advertisement market as the value of digital ad impressions bought and sold through automated trading mechanisms, across devices, formats, and advertiser verticals.
Scope exclusions: We exclude spend executed through fully manual insertion-order buying for print, linear broadcast TV, and terrestrial radio.
Segments Covered in This Report
- By Trading Platform
- Real-Time Bidding (Open Auction)
- Private Marketplace
- Programmatic Guaranteed
- Preferred Deals (Unreserved Fixed-Rate)
- Header Bidding
- By Advertising Channel / Format
- Display Banner
- Video
- Mobile Display
- Connected TV (CTV)
- Digital Out-of-Home (DOOH)
- Others
- By Device
- Desktop
- Mobile
- Smart TV
- By Industry Vertical
- Retail and E-Commerce
- Media and Entertainment
- Automotive
- BFSI
- Healthcare and Pharma
- Others
- By Enterprise Size
- SMBs
- Large Enterprises
- By Geography
- North America
- United States
- Canada
- Latin America
- Brazil
- Argentina
- Mexico
- Rest of Latin America
- Europe
- Germany
- United Kingdom
- France
- Italy
- Spain
- Rest of Europe
- Asia-Pacific
- China
- Japan
- South Korea
- India
- Australia
- New Zealand
- Rest of Asia-Pacific
- Middle East and Africa
- United Arab Emirates
- Saudi Arabia
- South Africa
- Rest of Middle East and Africa
- North America
Data Sources, Market Sizing, and Validation
Desk Research
Desk work starts with building the demand and supply context for digital ads, then narrowing it to automated buying. We typically review public sources such as IAB releases, OECD and World Bank macro indicators, International Telecommunication Union connectivity data, and regulator publications that shape privacy and tracking rules (for example, GDPR-related updates and similar national guidance).
To anchor company and platform direction, we also use annual reports, earnings call transcripts, investor decks, and reputable press coverage on ad loads, auction mechanics, and inventory expansion in areas like streaming and digital out-of-home. For quant checks, we selectively use paid subscriptions for company financials and intelligence, and for patent databases to identify which ad decisioning and measurement capabilities are being invested in. These desk sources are not exhaustive, and other references are used during collection, validation, and clarification.
Primary Interviews and Surveys
Primary work is used to confirm what portion of digital budgets is actually transacted programmatically, and how buyers are shifting between open auction, private marketplaces, and programmatic guaranteed. We speak with a mix of advertisers, agencies, publishers, and ad-tech operators across major regions so gaps in desk inputs, such as fee take-rates and inventory mix, can be checked against real purchasing behavior.
Distribution of primary research fieldwork respondents
| Company type | Respondent position | Region |
|---|---|---|
| Top tier: 36% | CXOs: 19% | APAC: 45% |
| Mid tier: 44% | Functional/Unit leaders: 23% | EMEA: 34% |
| Smaller Players: 20% | Managers: 58% | Americas: 21% |
Market-Sizing & Forecasting
The market is reconstructed using a top-down approach where digital advertising totals are filtered using programmatic transaction shares, then allocated by region and major buying pipes such as RTB, PMPs, and programmatic guaranteed. To keep the totals realistic, we corroborate them using selective bottom-up approximations like sampled ad spend to impression volume relationships, channel checks on CPM movement, and a roll-up of reported revenue signals where they are available.
A few inputs that matter in this market include digital ad spend growth, the share of spend transacted via automation, CTV and streaming inventory expansion, the mix shift between open auction and private deals, and pricing direction for key formats, often reflected through CPM and fill-rate discussions. Where coverage is uneven by geography, gaps are handled by applying region-specific adoption curves that are confirmed in calls, rather than applying a single global share.
For forecasting, we rely on scenario analysis supported by a simple multivariate view of budget growth, automation penetration, and pricing direction by format, then stress-tested with interview feedback on privacy changes and measurement constraints. The final forecast path is adjusted when the implied programmatic share does not fit observable media buying behavior in a given region.
Data Validation & Update Cycle
Outputs are checked against independent signals such as published digital ad revenue series, major platform disclosures, and region-level ad spend narratives to catch obvious overstatement or understatement. When unusual jumps appear, assumptions like programmatic share, CPM progression, or mix between open and private deals are revisited, and experts are re-contacted if needed to confirm what changed.
Before sign-off, the model goes through multiple analyst review steps so calculation logic, unit consistency, and currency handling are verified. Reports are refreshed annually, and interim updates are made when material events occur, such as major privacy enforcement actions or large shifts in streaming ad inventory. Right before delivery, we do a fresh pass to ensure clients receive the latest updated view.
Mordor Intelligence's Global Programmatic Advertisement Market Size Compared Against Other Published Estimates
Published market sizes for programmatic advertising can vary widely because each publisher uses a different definition of what counts as programmatic, and they also treat adjacent areas like search, social, and retail media differently. Timing also affects comparisons, since some numbers reflect spend while others reflect earned revenues, and the currency year used for conversion is not always stated.
In our checks, the biggest gap drivers were whether manual insertion-order digital deals get counted, how CTV and digital out-of-home are treated when bought through automation, and whether figures represent global spend versus a single-country revenue lens. The table points to these differences, where manual IO spend is excluded and automated pipes (RTB, private marketplaces, and programmatic guaranteed) are counted across formats, a scope choice applied by Mordor Intelligence.
Benchmark comparison
| Source | Market Size | Gaps in Research Methodology |
|---|---|---|
| Mordor Intelligence | USD 0.72 T (2026) | |
| Industry Association A | USD 162.40 B (2025) | Represents US programmatic advertising revenues (excluding search) and can be reported as earned revenue by buying method, which does not map one-to-one to global spend totals across all regions. |
| Trade Journal B | USD 180.00 B (2025) | Focuses on US programmatic digital display ad spending and is narrower by geography and channel, which can understate global totals and omit non-display programmatic pipes included in broader definitions. |
Taken together, the spread is mainly explained by geography and what the number is measuring (earned revenue versus total market spend), followed by how strictly automation is defined. By keeping the scope tied to automated digital impression trading and then validating assumptions with interview-based adoption and pricing checks, we produce a figure that is easier to replicate and update year to year.
Key Questions Answered in the Report
What is the current market size of programmatic advertising?
The market stands at USD 0.72 Trillion in 2026.
How fast will the market grow?
A CAGR of 10.34 % is forecast, propelling revenue to USD 1.17 Trillion by 2031
Which region leads in market share?
North America holds the largest share at 37.50 %, supported by widespread connected-TV adoption
Why is Programmatic Guaranteed expanding rapidly?
Advertisers gain inventory certainty and publishers secure predictable yield, prompting projected 24.15 % CAGR in this sub-segment.
What years does this Global Programmatic Advertisement Market cover?
The report covers the Global Programmatic Advertisement Market historical market size for years: 2019, 2020, 2021, 2022, 2023 and 2024. The report also forecasts the Global Programmatic Advertisement Market size for years: 2026, 2027, 2028, 2029, 2030 and 2031.
How are brands adapting to cookie deprecation?
They are increasing investment in contextual intelligence and first-party clean-room collaborations, which maintain reach without third-party IDs
What role do retail media networks play?
They monetise shopper data, enabling deterministic targeting that delivers measurable sales lifts for participating brands.