
Process Analytical Instrumentation Market Size and Share
Market Overview
| Study Period | 2020 - 2031 |
|---|---|
| Market Size (2026) | USD 8.83 Billion |
| Market Size (2031) | USD 11.46 Billion |
| Growth Rate (2026 - 2031) | 5.36 % |
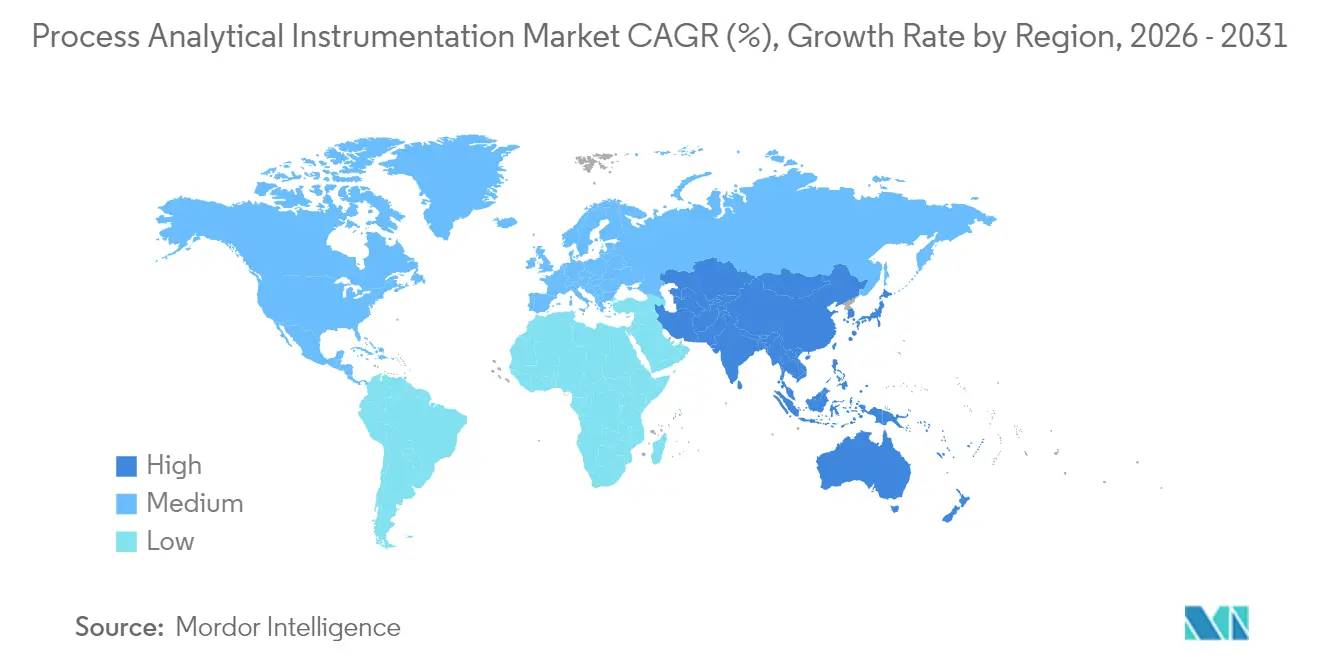
| Fastest Growing Market | Asia Pacific |
| Largest Market | North America |
| Market Concentration | Medium |
Major Players *Disclaimer: Major Players sorted in no particular order Image © Mordor Intelligence. Reuse requires attribution under CC BY 4.0. | |
Process Analytical Instrumentation Market Analysis by Mordor Intelligence
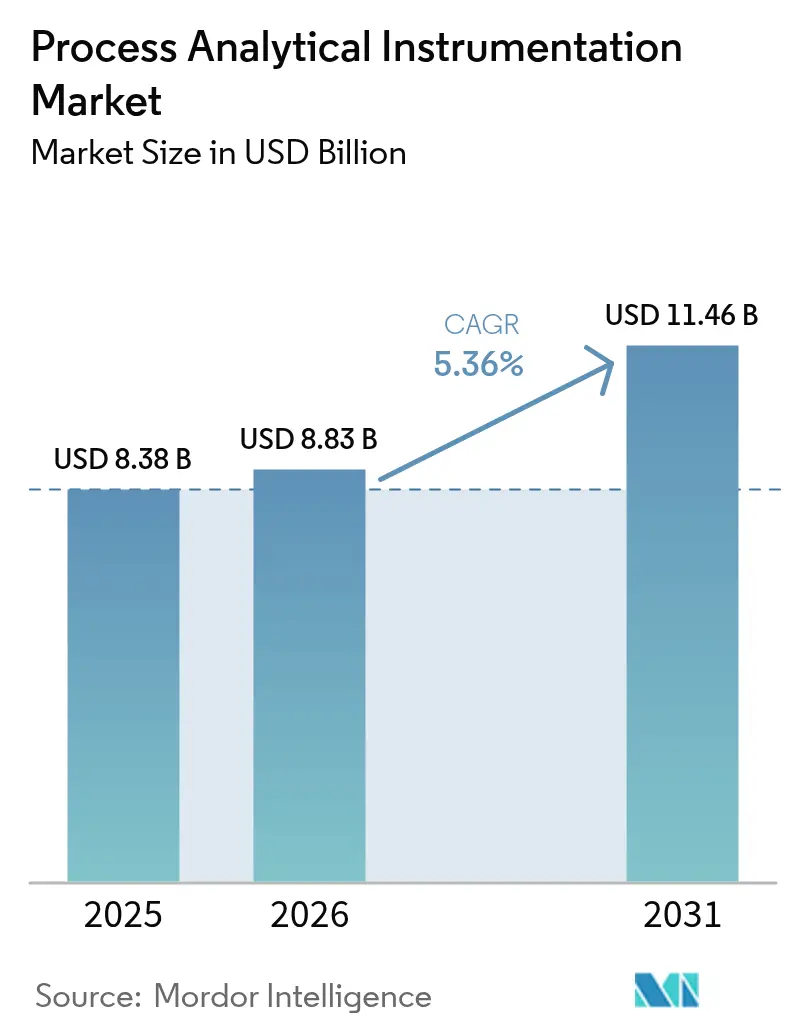
The process analytical instrumentation market size is expected to grow from USD 8.38 billion in 2025 to USD 8.83 billion in 2026 and is forecast to reach USD 11.46 billion by 2031 at 5.36% CAGR over 2026-2031. Strong adoption of real-time monitoring, ever-tighter global regulations, and data-driven operational strategies keep propelling the process analytical instrumentation market, even as industries grapple with rising system complexity and cybersecurity risks. Convergence of operational and information technology has converted formerly stand-alone analyzers into digital nodes that feed broader Industry 4.0 ecosystems, allowing high-fidelity feedback loops and predictive maintenance routines that shrink downtime and waste. This technology shift is reinforced by capital-intensive projects in hydrocarbon processing, biopharmaceutical continuous manufacturing, and green-hydrogen electrolyzer build-outs, all of which demand robust in-line analytics. Asia-Pacific’s push to align with North American and European emission rules is reshaping supplier footprints, while global helium scarcity continues to influence chromatograph procurement decisions.
Key Report Takeaways
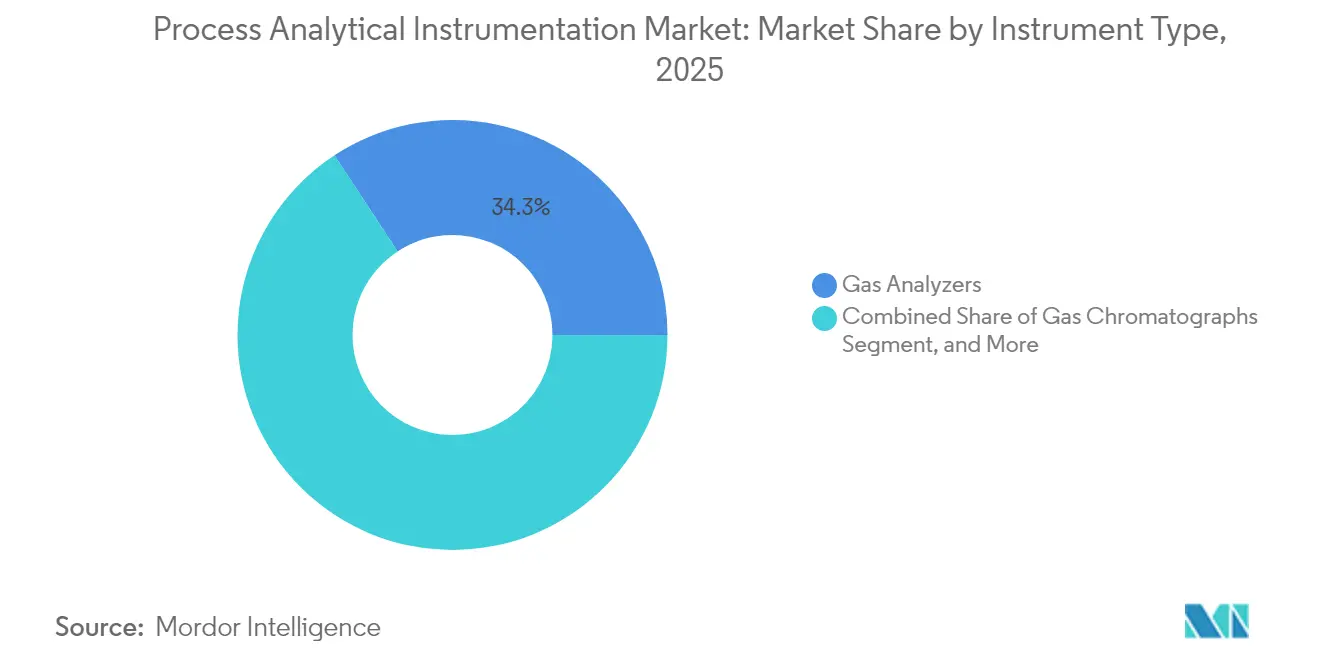
- By instrument type, gas analyzers held 34.25% of the process analytical instrumentation market share in 2025, whereas spectrometers are advancing at a 6.38% CAGR through 2031.
- By component, hardware captured 51.35% revenue share in 2025; software is projected to expand at a 6.55% CAGR to 2031.
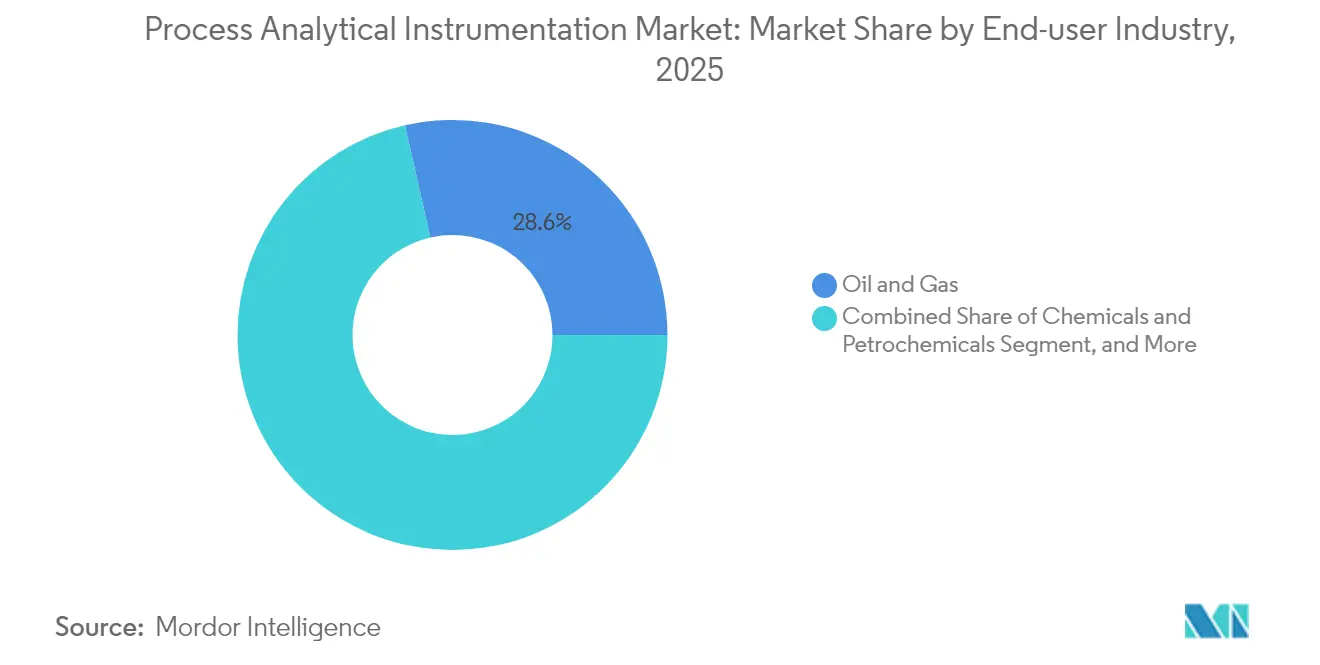
- By end-user industry, oil and gas accounted for 28.55% of the process analytical instrumentation market size in 2025, while pharmaceutical and biotechnology applications posted the fastest 7.84% CAGR forecast.
- By installation type, in-line/on-line configurations commanded a 54.85% share of the process analytical instrumentation market size in 2025 and are growing at a 7.42% CAGR through 2031.
- By geography, North America led with 41.05% market share in 2025; Asia-Pacific is scaling with an 8.21% CAGR to 2031.
Note: Market size and forecast figures in this report are generated using Mordor Intelligence’s proprietary estimation framework, updated with the latest available data and insights as of 2026.
Market Trends and Insights
Drivers Impact Analysis of Process Analytical Instrumentation Market*
| Driver | (~) % Impact on CAGR Forecast | Geographic Relevance | Impact Timeline |
|---|---|---|---|
| Regulatory push for in-process quality and emission compliance | +1.20% | Global, with emphasis on North America and Europe | Medium term (2-4 years) |
| Digitalization and Industry 4.0 adoption across process industries | +1.50% | Global, led by North America and Asia-Pacific | Long term (≥ 4 years) |
| Rising demand for real-time analytics in oil, gas and petrochemicals | +0.90% | Global, concentrated in Middle East, North America, and Asia-Pacific | Short term (≤ 2 years) |
| Rapid expansion of biopharma continuous manufacturing lines | +0.80% | North America and Europe, expanding to Asia-Pacific | Medium term (2-4 years) |
| Green-hydrogen electrolyzer build-outs needing high-purity gas analysis | +0.60% | Europe and Asia-Pacific, emerging in North America | Long term (≥ 4 years) |
| Deployment of digital-twin models requiring high-fidelity inline data | +0.70% | Global, led by advanced manufacturing regions | Long term (≥ 4 years) |
| Source: Mordor Intelligence | |||
Regulatory push for in-process quality and emission compliance
A wave of fresh environmental statutes is forcing continuous monitoring across smokestacks, flares, and bioreactors, immediately enlarging the addressable base of the process analytical instrumentation market.[1] The EU’s Ambient Air Quality Directive of 2024 compels ultrafine-particle counting, while Canada’s CEMS code tightens calibration cycles for SO₂, NOx, and CO probes. Similar rulemaking in Asia is closing historical enforcement gaps, moving thousands of plants toward mandatory continuous emission monitoring. Vendors able to supply analyzers pre-certified to ISO 17025 and EN 15267 standards shorten customers’ route to compliance. Beyond environmental stacks, the same regulatory intent is seeping into pharmaceutical GMP and food safety standards, where inline analytics mitigate batch rejection costs.
Digitalization and Industry 4.0 adoption across process industries
As cloud-native SCADA platforms and industrial IoT gateways proliferate, the process analytical instrumentation market gains new connectivity mandates, compelling instrument makers to embed OPC UA, MQTT, and secure IP stacks.[2] Plants pairing analyzers with digital twins derive multivariate insights, such as feed-quality drift or catalyst aging, well before the product degrades. Software vendors’ AI-enhanced chemometric engines now automate spectrum interpretation, expanding advanced analysis beyond PhD-level specialists. However, network exposure heightens cyber-risk, so firms promoting IEC 62443-certified appliances gain competitive credibility. This dual connectivity-and-security requirement propels recurring software and service revenues, tilting value creation from hardware toward digital offerings.
Rising demand for real-time analytics in oil, gas and petrochemicals
Hydrocarbon producers deploying inline spectrometers and chromatographs quantify blend ratios, sulfur content, and vapor pressure in minutes rather than hours, unlocking millions in annual yield improvement.[3] Case studies from Cenosco report USD 2.35 million yearly savings, while other refiners achieve USD 9.3 million in uplift by linking analyzer data to advanced process control loops. In upstream gas treatment, real-time dew-point monitors avert glycol overuse, trimming operating expenses and flare volumes. These quantifiable wins accelerate capital approval for analyzer projects, offsetting helium-supply concerns in gas chromatography by driving uptake of micro-GC and hydrogen carrier systems.
Rapid expansion of biopharma continuous manufacturing lines
Regulators encourage drug makers to shift from batch to continuous production, provided real-time release testing verifies quality every second.[4] Raman and NIR probes now thread through crystallizers and dryers, capturing critical quality attributes with sub-second latency. Pharmaceutical majors record double-digit throughput gains and six-figure annual material savings, as seen in Valtris Champlor’s EUR 90,000 (USD 96,300) reduction in solvent usage. Clear EU Pharmacopoeia guidelines for handheld Raman tools simplify validation, leveling barriers for smaller biotech firms. This sustained investment stream reinforces the long-term growth vector of the process analytical instrumentation market.
Restraints Impact Analysis of Process Analytical Instrumentation Market*
| Restraint | (~) % Impact on CAGR Forecast | Geographic Relevance | Impact Timeline |
|---|---|---|---|
| High capital and lifecycle costs of sophisticated analyzers | -0.80% | Global, particularly impacting emerging markets | Short term (≤ 2 years) |
| Shortage of skilled calibration and maintenance personnel | -0.60% | Global, acute in North America and Europe | Medium term (2-4 years) |
| Cyber-security vulnerabilities in networked analyzers | -0.40% | Global, critical in regulated industries | Short term (≤ 2 years) |
| Global helium scarcity impacting GC operations | -0.50% | Global, severe impact on analytical laboratories | Long term (≥ 4 years) |
| Source: Mordor Intelligence | |||
High capital and lifecycle costs of sophisticated analyzers
Complete CEMS platforms or triple-quadrupole mass spectrometers require outlays that exceed USD 500,000, with annual service costs reaching 20% of the purchase price. Emerging economies face currency volatility, import duties, and a dearth of local service hubs that inflate delivered pricing. In continuous-process plants where downtime penalties are brutal, redundancy becomes mandatory, doubling capital requirements. These economics delays analyzer adoption among small-scale chemical, food, and specialty-materials producers.
Shortage of skilled calibration and maintenance personnel
Multidisciplinary expertise, spanning spectroscopy, electronics, software, and compliance, is scarce and aging out of the workforce.[5] Plants in remote basins struggle to retain analysts willing to work rotating shifts under safety-critical conditions. Limited academic programs for process analytical technology exacerbate the pipeline problem. Vendor-run remote diagnostics and augmented-reality field tools offer partial relief, yet cannot fully replace on-site technicians, tempering the growth trajectory of the process analytical instrumentation market.
*Our forecasts treat driver/restraint impacts as directional, not additive. The impact forecasts reflect baseline growth, mix effects, and variable interactions.
Process Analytical Instrumentation Market Segment Analysis
By Instrument Type:
Gas analyzers cement leadership as spectrometers accelerateGas analyzers held a 34.25% process analytical instrumentation market share in 2025, underpinned by universal emission-monitor mandates and pervasive process-optimization routines across refineries, chemical crackers, and power boilers. Their share advantage stems from the necessity of continuous SO₂, NOx, CO, and CO₂ readouts to comply with environmental permits and carbon-pricing schemes. Spectrometer demand, while smaller, is climbing at a 6.38% CAGR to 2031 as portable XRF and handheld Raman devices push elemental and molecular identification to loading docks and utility skids.
In the second half of the decade, utilities retrofitting hydrogen co-firing lines and electrolyzer OEMs will widen the gas-analyzer installed base, yet spectrometers may erode share in biotech and battery-materials lines where real-time impurity tracking becomes critical. Micro-GC architectures, hydrogen carrier gases, and smart valve ovens counter helium shortages while preserving separation performance. The combined evolution sustains hardware sales yet shifts value toward application-specific chemometrics, reinforcing the strategic importance of software inside the process analytical instrumentation market.

By Component:
Hardware is still dominant, software captures velocityHardware contributed 51.35% to 2025 revenue, mirroring large sensor counts and the mechanical complexity of sample-conditioning systems that make up each analyzer skid. Sophisticated optics, ruggedized gas-cells, and explosion-proof enclosures keep average selling prices high. The process analytical instrumentation market size for software, however, is posting a 6.55% CAGR because embedded AI engines translate raw spectra into actionable set-point changes. Suppliers such as Bruker, integrating the SciY data platform across its portfolio, are packaging subscription-based chemometrics that boost gross margin and create annuity revenue.
Service contracts wrap calibration, validation, and cyber-patching into multi-year agreements; Emerson alone booked USD 4.06 billion from measurement & analytical services in 2024. The industry’s skills gap elevates service intensity, giving vendors that maintain global field networks a structural advantage. As predictive-maintenance algorithms mature, software-as-a-service offerings will likely outgrow hardware capital sales beyond 2030.
By End-User Industry:
Oil and gas retains scale, pharma gains momentumOil and gas operations accounted for 28.55% of 2025 revenue, making the sector the single largest consumer of continuous gas chromatography, mass-spectrometry, and tunable-diode laser absorption setups. Refiners depend on octane and sulfur loop analytics to prove fuel compliance, while LNG terminals deploy fast spectrometers for custody-transfer calorific calculations.
Pharmaceutical and biotech lines are recording an 7.84% CAGR, driven by continuous manufacturing cells and regulatory backing for real-time release testing. Inline Raman verifies polymorph ratios, and NIR models quantify moisture without sampling, compressing batch-release times from days to minutes. Water & wastewater operators, metals & mining concentrators, and food & beverage processors each enlarge addressable niches by turning to analyzers for effluent compliance and ingredient integrity.
By Installation Type:
In-line supremacy reflects real-time imperativeIn-line assemblies commanded a 54.85% share in 2025, and the process analytical instrumentation market size for in-line solutions is set to grow 7.42% annually as users switch from lab-based assays to continuous quality assurance. Spectroscopic probes now screw directly into reactors or pipelines, enabling closed-loop control that removes manual sampling drag. Multiplexers allow a single spectrometer to supervise up to six positions, spreading capex while widening insight bandwidth.
At-line carts still thrive in sectors needing frequent but not continuous QC; for example, pulp-and-paper mills park near-infrared benches beside coaters, running five-minute checks on brightness. Central laboratories persist for forensic tasks, trace-level heavy-metal determinations, or method-development cycles, yet their relative footprint inside the process analytical instrumentation market is shrinking as sensors penetrate plant floors.
Geography Analysis
North America Process Analytical Instrumentation Market
North America held a 41.05% share in 2025 as the U.S. EPA’s 40 CFR Part 60/75 rules and OSHA exposure limits necessitated continuous analyzers across refineries, chemical parks, and power plants. Ample capital budgets, established service infrastructures, and long-tenured workforces allow quick integration of AI-supported chemometrics. Persistent helium tightness and labor shortages do temper replacement cycles, but vendor-managed service agreements buffer downtime risk.
APAC Process Analytical Instrumentation Market
Asia-Pacific is growing 8.21% per year, making it the fastest-scaling geography in the process analytical instrumentation market. China’s reinforced pollution-control ordinances, India’s consent-to-operate mandates, and Japan’s JAIMA-led standardization initiatives collectively open sizeable order backlogs. Continuous analyzers are being embedded not only in mega-refineries and steelworks but also in smaller specialty-chemical parks keen to meet export-market QC demands. Regional suppliers partner with global OEMs to localize service, easing import-duty burdens and language barriers.
Europe Process Analytical Instrumentation Market
Europe maintains steady expansion anchored to the October 2024 Ambient Air Quality Directive, which compels ultrafine-particle measurement across 27 member states. Petrochemical clusters along the Rhine and in Iberia replace legacy opacity meters with modern FTIR cells to satisfy CO₂ taxation reporting. Simultaneously, green-hydrogen electrolyzer projects in Germany and Spain demand high-purity oxygen and hydrogen validation, catalyzing analyzer uptake. Eastern European processors, eager to secure REPowerEU funding, adopt Western emission standards, adding incremental volume for vendors.
Regulatory Landscape
Regulation affecting process analytical instrumentation is anchored by environmental continuous monitoring rules and by pharmaceutical quality-by-design and process validation frameworks that institutionalize in-process analytics. In Europe, the October 2024 EU Ambient Air Quality Directive raises measurement requirements (including ultrafine particles), reinforcing demand for certified continuous emission monitoring and validated analyzer performance. In North America, U.S. EPA requirements (e.g., 40 CFR Part 60/75) and similar Canadian CEMS practices keep calibration, quality assurance, and documentation burdens high for gas analyzers and chromatographs.
For regulated manufacturing, FDA guidance on PAT and EMA process-validation guidance push continuous process verification and documented control strategies, which increases the focus on validated inline Raman/NIR and multivariate models for real-time release testing. ICH Q14 (analytical procedure development) further formalizes lifecycle approaches, including multivariate procedures. Interoperability and performance testing standards are also tightening: the OPC Foundation promotes OPC UA-based Laboratory and Analytical Device Standard (LADS) to support manufacturer-independent device communication, and the IEC published updated IEC 61298-1:2026 and IEC 61298-3:2026, along with IEC 62828-1:2026 for process measurement transmitter testing, signaling more granular, product-specific conformance expectations for connected instrumentation.
Value Chain Analysis
The value chain spans core components (optics, detectors, lasers, valves, sampling systems, embedded compute and networking), instrument OEM design and manufacturing, system integration into analyzer shelters or skids, and lifecycle services (installation, validation, calibration, cybersecurity patching, and remote monitoring). Global leaders such as ABB, Siemens, Emerson, Endress+Hauser, and Thermo Fisher Scientific, along with other specialists, typically deliver complete solutions that bundle hardware with chemometrics software and long-term service agreements. Integrators and automation partners connect analyzers to DCS/SCADA, historian, LIMS, and MES layers and implement interoperability choices such as OPC UA.
Recent supply dynamics show where value migrates and where bottlenecks can form. Tariff and logistics volatility has driven pricing and procurement adjustments, for example, Endress+Hauser implemented a supply-chain surcharge in 2025 that was subsequently increased. Input-cost inflation in processing equipment categories has also added pressure to delivered system costs and lead times. On the capability side, portfolio expansion through M&A and partnerships remains a way to secure high-value niches and installed-base services, demonstrated by Bruker acquiring Tornado Spectral Systems in January 2024 to deepen Raman PAT offerings, and by industry collaboration platforms such as CPACT that connect end users, academia, and vendors to move advanced chemometrics into deployable inline solutions.
Competitive Landscape
A moderate level of consolidation characterizes the process analytical instrumentation market, with ABB, Siemens, Emerson, and Endress+Hauser controlling a sizable installed base that grants cross-selling leverage. These incumbents embed AI crime-resistant firmware and OPC UA servers into new product lines, differentiating through secure integration with plant-wide DCS and MES layers. Multiple tuck-in acquisitions, such as ATS Corporation’s 2024 purchase of Heidolph, illustrate a strategy of filling application gaps, especially in biotech and spatial-chemistry niches.
Mid-tier challengers intensify competition by rolling out cyber-hardened portable analyzers that reach maintenance technicians and field engineers otherwise underserved by fixed-installation OEMs. Fortive, for instance, aligns internal data-science teams to monetize post-deployment analytics subscriptions, aiming for USD 100 million in AI service revenue by 2030. Investor enthusiasm remains robust; KPMG reports 21.1× EV/LTM EBITDA multiples for instrumentation companies, encouraging serial acquisitions that extend geographic footprints and widen installed service bases.
Start-ups focusing on helium-free micro-GC modules, battery-materials spectrometers, and cloud-delivered chemometrics exploit niche white spaces. Yet they often partner with larger distributors to overcome qualification hurdles in heavily regulated verticals. Intellectual-property accumulation, evident from rising IEEE industrial-automation cybersecurity filings, reinforces barriers to entry and underscores the premium placed on standards-body participation within the process analytical instrumentation market.
Process Analytical Instrumentation Industry Leaders
-
ABB Ltd
-
Siemens AG
-
Emerson Electric Co.
-
Endress+Hauser Group Services AG
-
Thermo Fisher Scientific Inc.
- *Disclaimer: Major Players sorted in no particular order

Process Analytical Instrumentation Market Companies Covered in this Report
- ABB Ltd
- Siemens AG
- Emerson Electric Co.
- Endress+Hauser Group Services AG
- Bruker Corporation
- Yokogawa Electric Corporation
- Thermo Fisher Scientific Inc.
- Agilent Technologies Inc.
- Honeywell International Inc.
- Mettler-Toledo International Inc.
- MKS Instruments Inc.
- Teledyne Technologies Incorporated
- Servomex Group Ltd.
- SICK AG
- Focused Photonics Inc.
- Hach Company (Danaher)
- Extrel CMS LLC
- Nova Analytical Systems Inc.
- Neo Monitors AS
- Rockwell Automation Inc.
Market Opportunities and Future Outlook
A primary opportunity sits at the intersection of compliance, continuous manufacturing, and software validation, where customers need analyzers that are accurate and also easier to qualify, integrate, and keep secure over long lifecycles. Pharmaceutical continuous manufacturing and real-time release testing provide visible pull-through: FDA and EMA frameworks that emphasize continuous process verification, supported by ICH Q13 (continuous manufacturing) and ICH Q14 (analytical procedure lifecycle), increase demand for validated inline Raman/NIR, robust multivariate models, and audit-ready data pipelines that connect PAT to MES/LIMS and electronic batch records.
Miniaturized and modular analytics also create whitespace in footprint- and solvent-constrained environments, particularly where at-sample or inline measurement can replace lab loops. In March 2026, an academic evaluation of a compact microflow liquid chromatography system for at-sample reaction monitoring reported more than 99% solvent savings and faster separation versus benchtop systems, supporting a pathway for smaller, lower-consumable analytical platforms in continuous processes. At the same time, interoperability and cybersecurity requirements are becoming a product-selection gate, with OPC UA-based approaches (such as the OPC Foundation LADS model) and industrial security expectations (including IEC 62443-aligned practices referenced by buyers) favoring suppliers that package secure connectivity, validated software change control, and remote diagnostics as part of recurring service offerings.
Recent Industry Developments in Process Analytical Instrumentation Market
- June 2026: Siemens announced Opcenter Execution Pharma 2605 within the Siemens Xcelerator ecosystem, adding capabilities such as integrated weighing and dispensing for pharmaceutical operations. The release supports tighter digital thread integration between manufacturing execution workflows and in-process quality data, improving the practicality of deploying PAT at scale across regulated sites.
- February 2026: Emerson introduced the Rosemount QX1000 continuous gas analyzer for CEMS, combining paramagnetic O2 measurement with quantum cascade laser direct absorption spectroscopy for gases such as CO, CO2, NO, NO2, and SO2. The launch strengthens offerings aimed at continuous compliance monitoring while reducing analyzer footprint and accelerating response times for emissions control loops.
- September 2025: ABB launched the GCP100 process gas chromatograph with built-in cybersecurity features and integrated Wi-Fi for natural gas, biogas, oil, and petrochemical applications. Embedding security into the analyzer platform aligns with rising requirements for protected connectivity in networked plants and helps operators standardize secure remote access across installed fleets.
Process Analytical Instrumentation Market Report Scope and Research Methodology
Market Definition and Coverage
This market covers instruments used to measure and monitor process conditions and composition in industrial settings, so operators can control quality, safety, and efficiency in real time. It includes common analyzer families used across process industries and is measured as revenue in USD.
Scope exclusions: We exclude general process control devices that do not perform analytical measurement, along with laboratory-only research instruments that are not used to support on-site process monitoring.
Segments Covered in This Report
- By Instrument Type
- Gas Chromatographs
- Gas Analyzers
- Liquid Analyzers
- Spectrometers
- By Component
- Hardware
- Software
- Services
- By End-user Industry
- Oil and Gas
- Chemicals and Petrochemicals
- Pharmaceutical and Biotechnology
- Metals and Mining
- Water and Wastewater
- Food and Beverage
- Power Generation
- By Installation Type
- In-line/On-line
- At-line
- Laboratory
- By Geography
- North America
- United States
- Canada
- Mexico
- South America
- Brazil
- Argentina
- Rest of South America
- Europe
- Germany
- United Kingdom
- France
- Italy
- Spain
- Russia
- Rest of Europe
- Asia-Pacific
- China
- Japan
- India
- South Korea
- South-East Asia
- Rest of Asia-Pacific
- Middle East and Africa
- Middle East
- Saudi Arabia
- United Arab Emirates
- Turkey
- Rest of Middle East
- Africa
- South Africa
- Nigeria
- Rest of Africa
- Middle East
- North America
Data Sources, Market Sizing, and Validation
Desk Research
Desk research started by building the demand context for analyzers used in process plants, then narrowed it to what is actually installed for on-line and at-line monitoring. We used public references such as US EPA water and air compliance materials, USGS and IEA industrial indicators, Eurostat industrial production series, and World Bank macro and manufacturing data, which helped anchor activity levels in key end-user segments.
We also reviewed company annual reports, investor presentations, product catalogs, and trade publications to distinguish what gets sold as an analyzer versus adjacent control equipment. For cross-checks, we used a paid subscription for company financials and a paid patent database to see where product focus and R&D intensity were shifting. The desk sources listed here are illustrative only, and additional public references were used during data collection, validation, and clarification.
Primary Interviews and Surveys
Primary work focused on confirming how buyers and suppliers count process analytical instrumentation in specific projects, and how pricing changes with upgrades, service bundles, and installation choices. We interviewed people across supplier, integrator, and end-user roles, and we kept coverage balanced across the main consuming regions so assumptions on adoption, replacement timing, and typical deal structure could be checked against real project patterns.
Distribution of primary research fieldwork respondents
| Company type | Respondent position | Region |
|---|---|---|
| Top tier: 28% | CXOs: 15% | APAC: 49% |
| Mid tier: 52% | Functional/Unit leaders: 30% | EMEA: 31% |
| Smaller Players: 20% | Managers: 55% | Americas: 20% |
Market-Sizing & Forecasting
The model starts from a top-down view where industrial activity, compliance intensity, and installed-base replacement needs are used to reconstruct the addressable demand pool for process analyzers by region. After forming that ceiling, we cross-checked totals with selective bottom-up approximations, such as sampled average selling price (ASP) by analyzer family multiplied by estimated shipment volumes, plus channel checks on project ordering patterns to adjust for mix shifts.
Inputs in the model include refinery and chemical capacity additions, water and wastewater treatment build-outs, analyzer penetration on critical process steps, typical replacement cycles, and service attachment rates that drive recurring revenue. Pricing uses an ASP progression logic that reflects product mix changes, for example a higher share of advanced spectrometers in certain applications, rather than applying one flat inflation factor. Forecasts use scenario analysis, where variables like process industry capex cycles and regulatory monitoring requirements are stress-tested, and the final curve is aligned to expert consensus from interviews. Where bottom-up signals were thinner in smaller regions, we filled gaps using comparable end-user intensity and then validated the implied per-plant spend before locking the totals.
Data Validation & Update Cycle
Validation was conducted in layers. We compared model outputs against independent signals such as industrial production trends, major end-user investment cycles, and observed product mix patterns from public disclosures. Outliers were flagged, assumptions were revisited, and follow-up calls were initiated when variance could not be explained by mix, timing, or currency effects.
Before sign-off, the work passes through multiple analyst reviews so the calculations, logic, and narrative stay consistent across regions and end users. The report is refreshed annually, and when a material event shifts capex, supply conditions, or pricing, we consider an interim update. Right before delivery, we run a final pass to ensure clients receive the latest updated view.
Mordor Intelligence's Global Process Analytical Instrumentation Market Size Compared With Other Published Estimates
Published market sizes for process analytical instrumentation can appear far apart even when they describe similar equipment, because timing, currency conversion, and pricing assumptions are handled differently across studies. Variation also comes from how each study treats recurring service revenue, installation modes, and whether adjacent process control items are included in the total.
Key gaps tend to show up in the refresh cadence and in how ASP changes are modeled as product mix shifts over time, especially when new capacity additions and retrofit cycles do not move in the same direction. In this study, the most recent year cut, FX timing, and anomaly checks were aligned before finalization, and that refresh-led discipline is a main reason the 2026 baseline differs from figures that were carried forward earlier by Mordor Intelligence.
Benchmark comparison
| Source | Market Size | Gaps in Research Methodology |
|---|---|---|
| Mordor Intelligence | USD 8.83 B (2026) | |
| Trade Publisher A | USD 5.06 B (2025) | Uses a 2025 base and a longer forecast window, and the scope appears narrower around instruments only, which can undercount service and certain analyzer families that are sold as integrated systems. FX timing and ASP steps are not clearly tied to product mix changes, which can pull the value down versus a refresh aligned to current pricing. |
| Industry Research Portal B | USD 3.50 B (2023) | Uses an earlier base year and shows internal inconsistency in the stated 2023 value on the same page, which makes the starting point less traceable. The definition may lean toward selected instrument sets, and currency timing plus unvalidated ASP uplift assumptions can compress the number compared with a model tied to recent end-user spend signals. |
The comparison mainly shows that earlier base years, unclear scope boundaries, and lightly documented pricing updates can create a wide spread in totals. Our estimate is built from a clear demand pool by end users, then checked against pricing and adoption signals so clients can follow the steps and reuse the assumptions in their own planning.
Key Questions Answered in the Report
What is the current value of the process analytical instrumentation market and its growth outlook?
The process analytical instrumentation market size is USD 8.83 billion in 2026 and is expected to reach USD 11.46 billion by 2031, registering a 5.36% CAGR over 2026-2031.
Which region is growing fastest in process analytical instrumentation adoption?
Asia-Pacific leads with an 8.21% CAGR driven by industrialization and stricter environmental regulations.
Which instrument type dominates global demand?
Gas analyzers hold the largest share at 34.25% in 2025 due to universal emissions monitoring requirements.
Why are in-line installations favored over laboratory analyzers?
In-line setups deliver real-time data that supports immediate process adjustments, raising yield and lowering rejection rates.
How is the pharmaceutical sector influencing market expansion?
Continuous manufacturing and real-time release testing are pushing pharma to adopt Raman and NIR probes, driving an 7.84% CAGR for the segment.
What major challenge could slow market growth?
High capital costs and shortages of skilled calibration personnel jointly constrain rapid deployment, particularly in emerging markets.