
Power Transistor Market Size and Share
Market Overview
| Study Period | 2020 - 2031 |
|---|---|
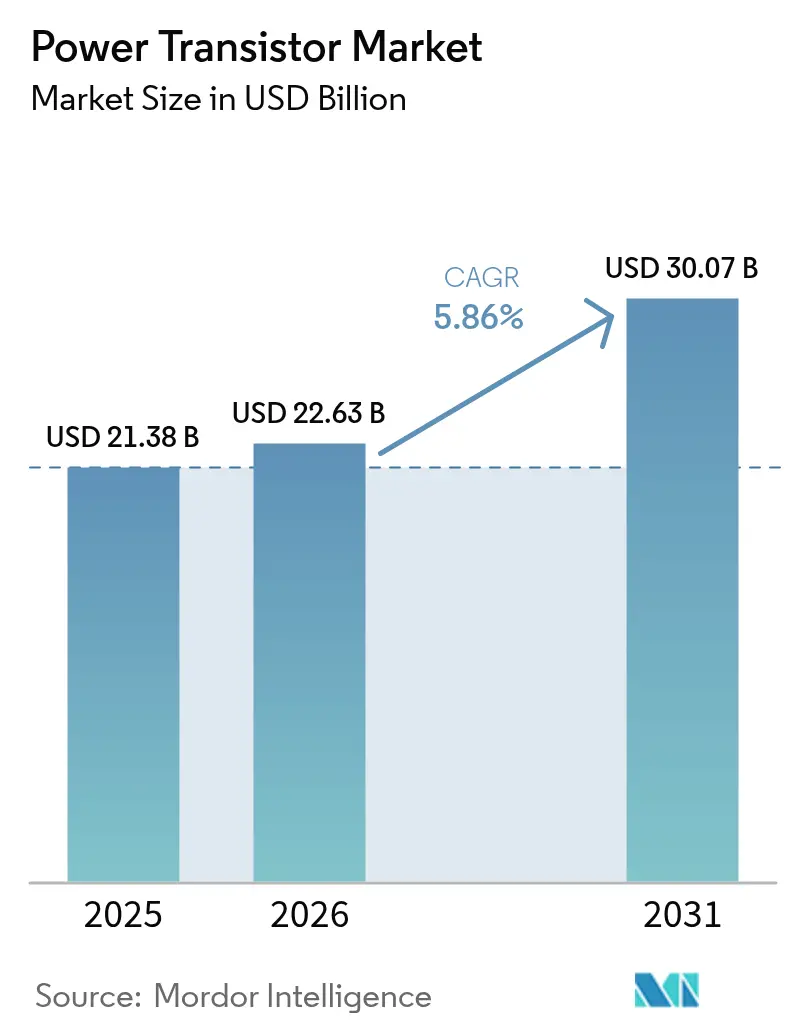
| Market Size (2026) | USD 22.63 Billion |
| Market Size (2031) | USD 30.07 Billion |
| Growth Rate (2026 - 2031) | 5.86 % |
| Fastest Growing Market | Middle East and Africa |
| Largest Market | Asia |
| Market Concentration | Medium |
Major Players *Disclaimer: Major Players sorted in no particular order Image © Mordor Intelligence. Reuse requires attribution under CC BY 4.0. | |
Power Transistor Market Analysis by Mordor Intelligence
The power transistor market size is expected to grow from USD 21.38 billion in 2025 to USD 22.63 billion in 2026 and is forecast to reach USD 30.07 billion by 2031 at 5.86% CAGR over 2026-2031. Faster adoption of wide-bandgap (WBG) materials-chiefly silicon carbide (SiC) and gallium nitride (GaN)-is reshaping competitive dynamics, enabling devices that handle higher voltages, greater switching frequencies, and tough thermal loads while shrinking system footprints. Electric-vehicle traction inverters, 5G radio units, and AI-driven data-center power supplies are expanding design-win opportunities as OEMs push toward greater than 98% conversion efficiency. Supply-chain security and vertical integration remain priority strategies, prompting high-profile acquisitions, new wafer fabs, and long-term material-supply pacts. Meanwhile, material shortages, notably in SiC substrates, and qualification delays for automotive-grade GaN temper the growth outlook yet also spur capacity investments and collaborative R&D.
Key Report Takeaways
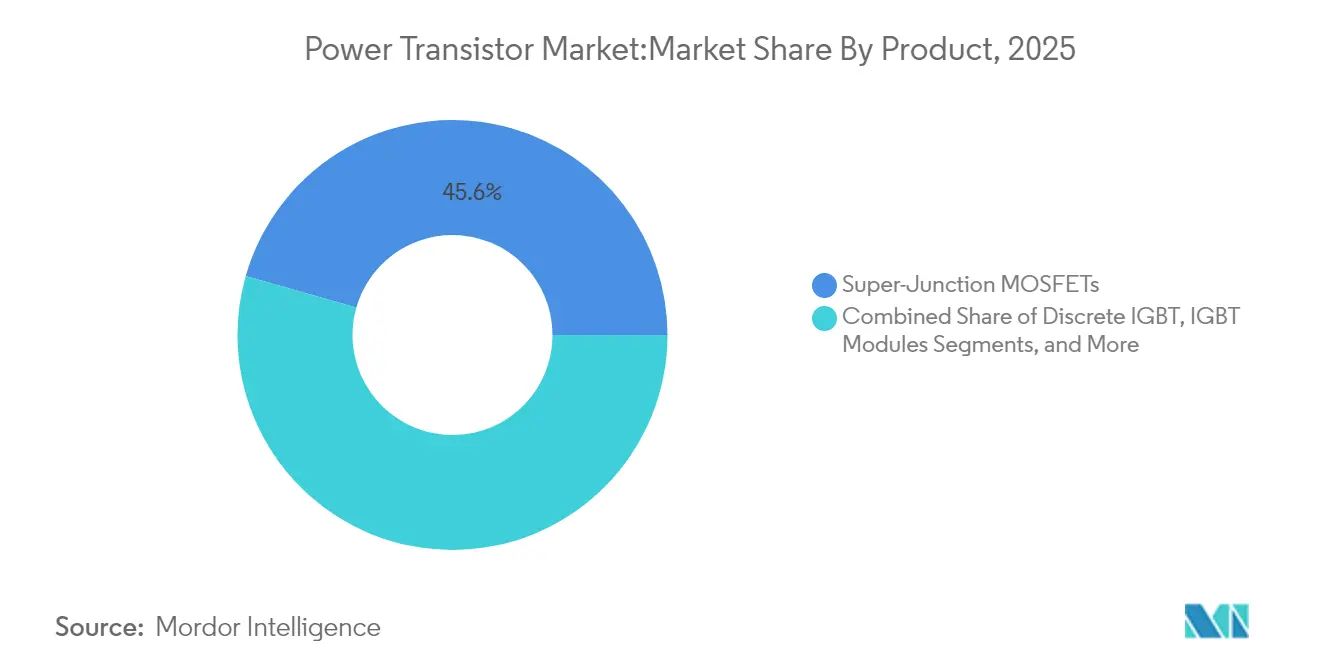
- By product category, MOSFETs led with 45.55% revenue share in 2025, while wide-bandgap power transistors are projected to expand at an 7.95% CAGR through 2031.
- By material, silicon held 70.40% of the power transistor market share in 2025; GaN is forecast to climb at a 9.45% CAGR to 2031.
- By type, field-effect transistors commanded 61.30% share of the power transistor market size in 2025; heterojunction bipolar transistors post the fastest CAGR at 6.05% through 2031..
- By packaging, discrete devices accounted for 65.20% of revenue in 2025, whereas power modules are set to accelerate at a 6.85% CAGR between 2026-2031.
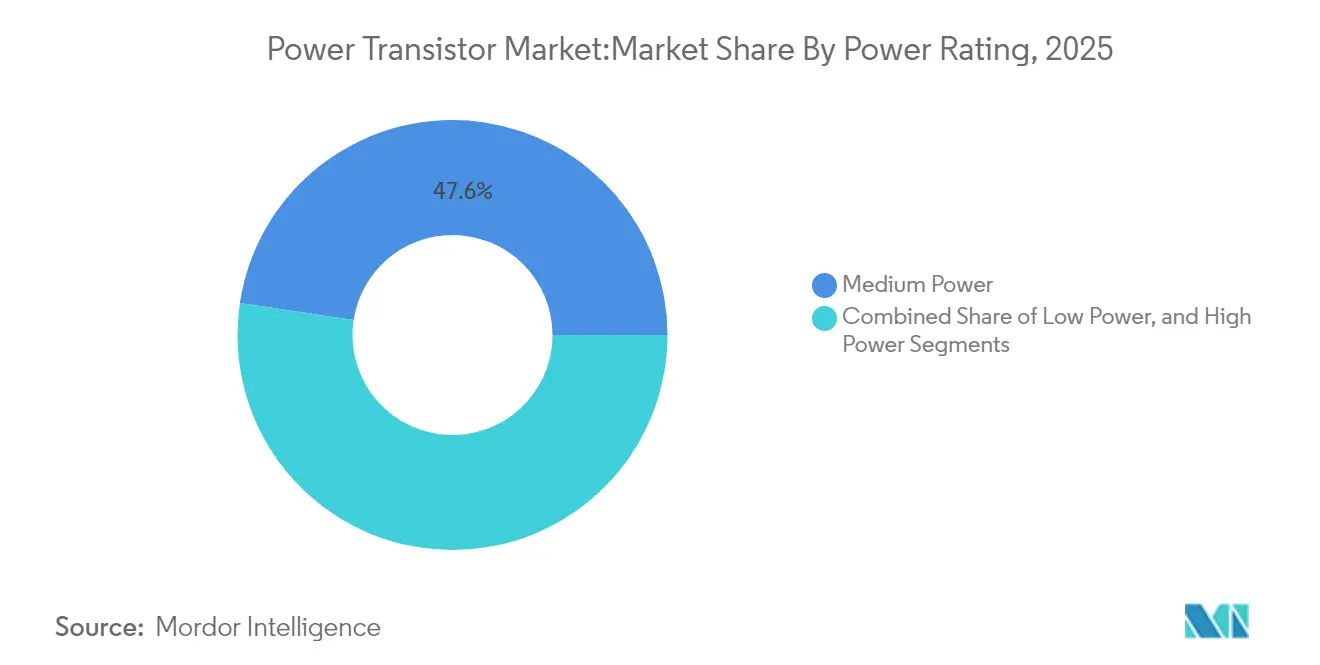
- By power rating, medium-power (40-600 V) devices held 47.60% of the power transistor market size in 2025; high-power (Above 600 V) devices are recording an 8.05% CAGR through 2031.
- By end-user, automotive and EV/HEV led with 27.40% share in 2025, while data centers and HPC post the steepest CAGR at 10.40% to 2031.
- By application, inverters and converters captured 25.10% of the power transistor market share in 2025; battery charging and BMS advances at an 10.95% CAGR through 2031.
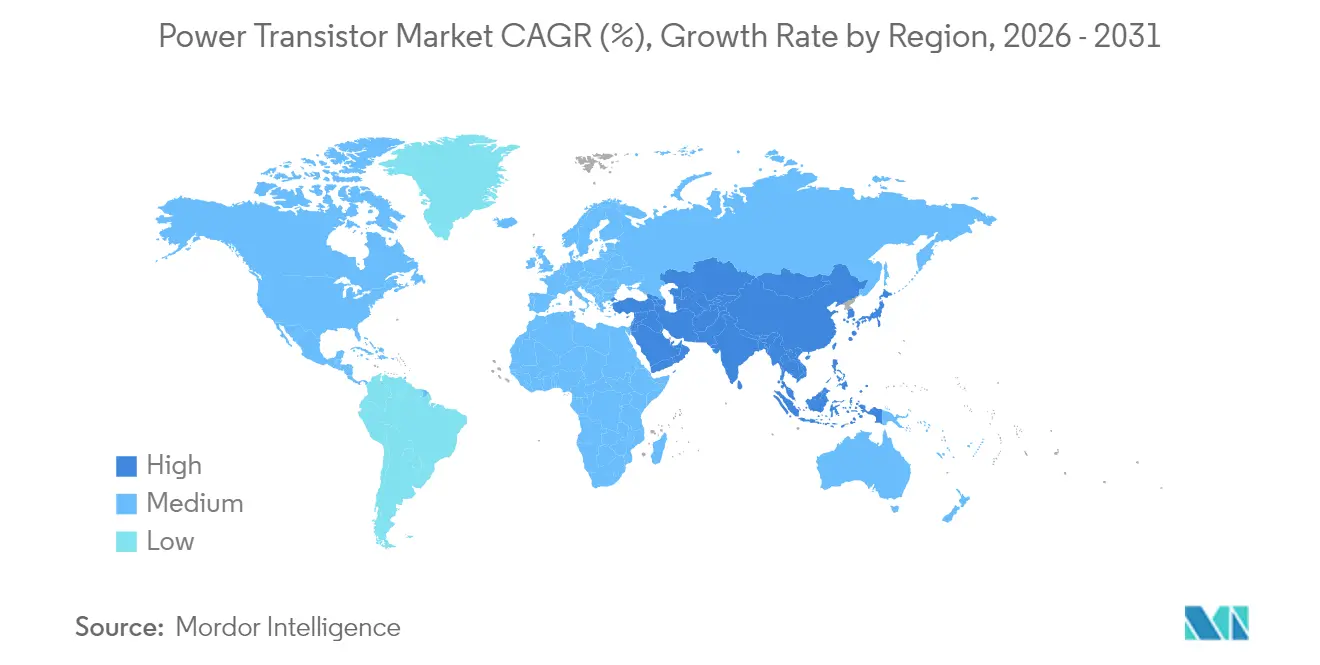
- By geography, Asia Pacific held 51.40% of revenue in 2025; the Middle East and Africa region grows the fastest at 8.45% CAGR to 2031.
Note: Market size and forecast figures in this report are generated using Mordor Intelligence’s proprietary estimation framework, updated with the latest available data and insights as of 2026.
Market Trends and Insights
Drivers Impact Analysis of Power Transistor Market*
| Driver | (~) % Impact on CAGR Forecast | Geographic Relevance | Impact Timeline |
|---|---|---|---|
| Accelerated EV demand for ≥600 V SiC IGBT modules | +1.5% | Asia Pacific, Europe | Medium term (2-4 years) |
| Rapid 5G roll-outs boosting RF GaN volumes | +1.3% | Asia Pacific, North America | Short term (≤2 years) |
| PLI & CHIPS incentives enlarging fab capacity | +1.1% | North America, India | Medium term (2-4 years) |
| ≥98% PSU efficiency race in data centers | +0.9% | North America, Europe, Asia Pacific | Short term (≤2 years) |
| Solar-plus-storage inverters adopting 1.2 kV SiC | +0.8% | Europe, Middle East & Africa | Medium term (2-4 years) |
| Automotive OEM vertical integration of modules | +0.5% | Japan, China | Long term (≥4 years) |
| Source: Mordor Intelligence | |||
Accelerated EV demand for ≥600 V SiC-based IGBT modules
SiC MOSFETs are displacing silicon IGBTs in 400 V and 800 V traction inverters because they deliver 40% lighter, 30% smaller assemblies and cut switching losses, which extends driving range. STMicroelectronics plans to commercialize fourth-generation STPOWER SiC MOSFETs in 2025, tailored for both voltage classes.[1] A billion-euro supply deal between ST and Semikron covering SiC eMPack modules for a German automaker from 2025 anchors long-term demand. Chinese, Japanese, and South Korean OEMs are likewise integrating captive SiC modules, tightening ties with substrate makers. As assembly volumes rise, learning-curve savings partially offset today’s SiC wafer premiums.
Rapid 5G roll-outs propelling RF GaN transistor volumes
Roll-out timelines for 5G macro and small-cell radios drive urgent need for high-efficiency RF front ends. GaN high-electron-mobility transistors (HEMTs) handle wide bandwidth and high drain voltages without compromising linearity, making them preferred over LDMOS or GaAs in new radio architectures. Wolfspeed’s 28 V, 30 W GaN HEMT die operates to 8 GHz, meeting telecom and satellite specifications while satisfying NASA reliability metrics.[2] Asia-Pacific carriers, particularly in China and South Korea, remain the volume anchors; North America follows with mid-band deployments that stipulate stringent efficiency targets to curb site-level power bills. With private-network and satellite-internet roll-outs ahead, RF GaN remains on an upward curve.
Government PLI and CHIPS incentives boosting regional fab capacity
Semiconductor industrial policies are shifting manufacturing footprints toward the United States and India. The CHIPS and Science Act underwrites >USD 450 billion in announced fab, R&D, and packaging projects that could triple U.S. capacity by 2032.[3] The National Semiconductor Technology Center strategy foresees an additional 238,000 skilled positions by 2030.[4] India’s production-linked incentive scheme targets local WBG capacity for mobility and solar segments, spurring joint ventures with global IDMs. These subsidies lower capital intensity, de-risk scale-up in 150 mm and 200 mm SiC lines, and shorten supply routes for domestic OEMs.
Data-center race for ≥98% PSU efficiency triggering super-junction MOSFET refresh
AI inference and training clusters raise rack-level power density beyond 100 kW, encouraging hyperscalers to refresh power-supply unit topologies. onsemi’s T10 PowerTrench® devices and EliteSiC 650 V MOSFETs enable architectures promising annual energy savings near 10 TWh. Navitas Semiconductor’s 8.5 kW GaN-based supply attains 97% efficiency in an 18 W/in³ form factor. Europe’s colocation sites and Asia’s hyperscale newcomers echo similar refresh cycles, accelerating demand for 600 V super-junction MOSFETs and 650 V GaN devices.
Restraints Impact Analysis of Power Transistor Market*
| Restraint | (~) % Impact on CAGR Forecast | Geographic Relevance | Impact Timeline |
|---|---|---|---|
| Chronic SiC substrate shortages | -0.8% | Global (highest in Asia Pacific, North America) | Medium term (2-4 years) |
| GaN automotive AEC-Q101 qualification lag | -0.7% | Global | Short term (≤2 years) |
| IGBT thermal-runaway risk above 175 °C | -0.5% | Asia Pacific, Europe | Medium term (2-4 years) |
| Multi-source export controls on WBG devices | -0.4% | Global (highest impact on China) | Medium term (2-4 years) |
| Source: Mordor Intelligence | |||
Chronic SiC substrate shortages inflating BOM costs
Fourteen 200 mm SiC fabs announced since 2024 remain insufficient to eliminate the wafer deficit through the decade. Limited boule yields raise epitaxial wafer prices and inflate power-module bills of material, slowing adoption in cost-sensitive solar and industrial inverters. STMicroelectronics is investing EUR 5 billion in Catania to create a fully integrated SiC complex, aiming for 15,000 wafers/week by 2033. Multi-year wafer-supply agreements, such as Infineon-Wolfspeed’s expanded pact, partially buffer availability, yet supply tightness persists until 200 mm crystal growth matures.
GaN device reliability qualification lag in automotive AEC-Q101
While GaN shows superior switching speeds and lower losses than SiC below 400 V, OEM adoption in on-board chargers and DC-DC converters is gated by stringent AEC-Q101 reliability demands. Distinct failure mechanisms-such as hot-electron trapping and dynamic RDS on degradation-require new test protocols and extended field data. Infineon’s roadmap highlights expanded qualification runs through 2025. Navitas’ GaNSafe IC family meets automotive surge and short-circuit thresholds, but large-scale car-model design-ins remain limited to 2026+ launches.
*Our forecasts treat driver/restraint impacts as directional, not additive. The impact forecasts reflect baseline growth, mix effects, and variable interactions.
Power Transistor Market Segment Analysis
By Product:
Wide-bandgap devices redefine performance limitsMOSFETs contributed 45.55% of revenue in 2025, underscoring their ubiquity from handset chargers to industrial drives. The power transistor market size for wide-bandgap power transistors is projected to climb from USD 8.53 billion in 2026 to USD 12.49 billion by 2031, translating to an 7.95% CAGR. GaN gets a further boost from Infineon’s CoolGaN G5 launch that embeds a Schottky diode, trimming dead-time and EMI.
Demand for IGBTs in traction inverters and industrial drives still rises, yet at a tempered rate as SiC options proliferate. Super-junction MOSFETs defend medium-voltage servers thanks to mature supply lines and cost position. RF & microwave transistors record healthy gains from telecom and satellite links as GaN displaces GaAs for higher-power services.

By Material:
GaN disrupts silicon’s dominanceSilicon accounted for 70.40% of 2025 shipments, but GaN revenue is forecast to expand at a 9.45% CAGR, the steepest across materials. The power transistor market share for GaN surpassed 7.25% in 2025 and is on track to achieve low-teens penetration by 2031. Consumer fast-chargers, motor drives, and 48 V data-center rails form the early-majority demand pool.
SiC’s stronghold remains applications above 600 V in EVs, solar, and storage. Market leader STMicroelectronics held 32.6% of SiC device revenue in 2024. Emerging candidates such as gallium oxide remain early-research propositions, yet they highlight ongoing material-science innovation.
By Type:
Field-effect transistors lead the innovation waveField-effect architectures captured 61.30% of 2025 revenue because power MOSFETs scale efficiently across voltage grades. The power transistor market size for FETs is set to expand steadily as design-ins migrate toward WBG platforms. Heterojunction bipolar transistors, though smaller, gain momentum in millimeter-wave 5G and low-Earth-orbit satellite payloads that prize high-frequency efficiency.
Bipolar-junction devices persist in legacy industrial controls where robustness trumps switching speed. Hybrid topologies that marry GaN gate drivers with SiC MOSFET output stages are surfacing, signaling convergent design approaches that favor system-centric optimization.
By Packaging:
Power modules enable system integrationDiscrete devices held 65.20% share in 2025, yet OEM preferences are tilting toward highly integrated packages that relieve thermal stress and cut assembly steps. BorgWarner’s double-sided cooled inverter module improves volumetric power density for EV drivetrains.
Power modules boast a 6.85% CAGR as automakers request turnkey traction inverters. Double-sintered copper and bond-wire-free substrates lengthen thermal cycles, while integrated gate drivers simplify system certification. Power ICs and integrated stages gain in mobile and infotainment where board area is scarce.
By Power Rating:
High-power segment accelerates with EV adoptionMedium-power devices maintained the largest share at 47.60% in 2025, reflecting their role in industrial motion and telecom rectifiers. High-power devices, however, post an 8.05% CAGR, the highest across voltage classes, on the back of fast-charging stations and 350 kW solar inverters. The power transistor market size for (above 600 V) devices is projected to reach USD 9.98 billion by 2031.
Low-power (Less than 40 V) GaN FETs challenge traditional silicon in synchronous rectification and point-of-load DC-DC modules, evident in EPC’s 40 V GaN family. Rapid electrification of two-wheelers and power tools in Asia sustains growth for this tier.
By End-User Industry:
Data centers challenge automotive dominanceAutomotive & EV/HEV absorbed 27.40% of 2025 revenue, cementing its lead with SiC traction inverters, on-board chargers, and battery management. Yet hyperscale and enterprise data-center operators, compelled to curtail electricity costs, form the fastest-growing vertical at 10.40% CAGR. The power transistor market share for data centers is set to exceed 15.20% by 2031.
Consumer electronics preserves double-digit revenue owing to high-volume smartphones and notebook adapters, amplified by GaN fast-charge proliferation. Industrial automation relies on variable-speed drives that integrate SiC for higher-efficiency pumps and compressors. Energy & power utilities adopt 1.2 kV SiC MOSFET stacks for solar and storage, while 5G networks continue as a durable RF transistor outlet.
By Application:
Battery systems drive electrification growthInverters & converters generated 25.10% of revenue in 2025 and remain indispensable across EV, solar, and UPS deployments. Battery charging & BMS applications log an 10.95% CAGR as pack capacities climb beyond 100 kWh and chemistries diversify. Infineon’s AI-enhanced battery algorithms paired with PSoC controllers underscore systemic moves to squeeze every watt-hour.
Motor control applications benefit from declining SiC MOSFET pricing, unlocking higher-efficiency industrial pumps. Power supplies & adapters transition to GaN to meet DOE Level VI and EU CoC Tier 3 consumption limits. RF power amplifiers expand within satellite broadband, while lighting drivers adopt compact FETs for dynamic dimming and automotive head-lamp arrays.
Geography Analysis
APAC Power Transistor Market
Asia Pacific generated 51.40% of power transistor market revenue in 2025 and holds undisputed volume leadership. China’s EV output surge, combined with expanding domestic SiC and GaN fabs, cements demand across the supply chain. Japan and South Korea add high-value automotive and consumer-device design-ins, while India accelerates foundry investments under its semiconductor mission. Joint ventures such as STMicroelectronics-Sanan for 200 mm SiC production exemplify the region’s bid to localize WBG capability. Thailand’s 27% rise in integrated-circuit imports during 2024 signals broader regional integration.
North America and Europe Power Transistor Market
North America and Europe jointly account for about 40% of the market, anchored in automotive power electronics, data-center infrastructure, and industrial automation. U.S. CHIPS Act incentives underpin a new wave of SiC and GaN fabs that prioritize automotive and defense supply resilience. Europe’s Critical Raw Materials Act and innovation programs target DC-DC converters, solid-state transformers, and battery modules, reinforcing its power electronics value chain. Both regions cultivate technical partnerships to advance 200 mm SiC crystal growth and zero-defect GaN epitaxy.
MEA Power Transistor Market
The Middle East & Africa represent a small but fastest-growing slice, with an 8.45% CAGR forecast to 2031. National programs such as Saudi Vision 2030 and the UAE’s G42 semiconductor push channel investment into renewable energy inverters, data-center clusters, and EV charging corridors. Abundant solar irradiation and favorable power tariffs provide a natural pull for high-voltage SiC device deployment, while local design hubs attract diaspora engineering talent.
Mordor Intelligence provides coverage of the power transistor market across other key regional markets, including Europe and Asia, each with their regulatory frameworks and demand patterns. Detailed country-level analysis extends to Japan and China incorporating local coverage and market participation, as required.
Value Chain Analysis
Upstream activity centers on raw materials and wafer supply for silicon, SiC, and GaN, supported by epitaxy services and specialized process equipment for high-voltage and wide-bandgap nodes. Power transistor vendors operate as integrated device manufacturers (Infineon Technologies, STMicroelectronics, onsemi, Texas Instruments) and as fab-lite specialists that rely on foundries for GaN-on-silicon capacity (for example, Navitas), with assembly, test, and packaging converting die into discrete devices and power modules for automotive, industrial, telecom, and data-center OEMs.
Midstream, device fabrication and packaging are the key bottlenecks for WBG scaling. Substrate availability, qualification cycles, and advanced packaging formats (low-inductance, higher-thermal-performance modules) affect lead times and cost. Partnerships increasingly focus on securing qualified manufacturing paths and integrating control with power: STMicroelectronics signed a GaN technology development and manufacturing agreement with Innoscience in March 2025, and GlobalFoundries and Navitas announced a strategic partnership in November 2025 to manufacture GaN-on-silicon at GlobalFoundries Burlington, Vermont, with development set for early 2026. Downstream, distribution is shaped by direct OEM design-ins and franchised electronics distribution, with system makers pushing multi-sourcing and platform-level power solutions (power stage plus control/firmware) to reduce total losses in EV inverters, fast chargers, and AI-server power supplies.
Competitive Landscape
The power transistor market is moderately concentrated: the top five suppliers-Infineon Technologies, STMicroelectronics, onsemi, Wolfspeed, and Texas Instruments-controlled roughly 65% of 2024 global revenue. Infineon’s USD 830 million purchase of GaN Systems in 2024 broadened its GaN IP portfolio and accelerated access to consumer and telecom customers. onsemi followed with a December 2024 acquisition of SiC JFET technology and in March 2025 made a USD 4.9 billion offer for Allegro MicroSystems, expanding its footprint in intelligent power and sensing.
Vertical integration is the dominant strategic theme. STMicroelectronics, Wolfspeed, and Infineon invest directly in crystal growth, epitaxy, device fabrication, and module assembly to shield customers from wafer tightness. Long-term take-or-pay wafer contracts run five to ten years, signaling trust in secular demand. Equipment partnerships focus on 200 mm WBG tooling, while packaging R&D aims at double-sided direct-bond copper substrates and embedded die.
Niche specialists, notably Navitas Semiconductor and Cambridge GaN Devices, leverage fab-lite models and proprietary GaN IC architectures to disrupt low- and mid-power arenas. Regional suppliers in China and Taiwan pursue cost disruption through high-throughput 150 mm lines. Geographic diversification of fabs in locations such as Arizona, New York, Dresden, Catania, and Gujarat-mitigates geopolitical risks and aligns producers with incentive programs linked to local hiring and sustainability metrics.
Power Transistor Industry Leaders
-
NXP Semiconductors N.V
-
Texas Instruments Incorporated
-
STMicroelectronics N.V.
-
Mitsubishi Electric Corporation
-
Toshiba Corporation
- *Disclaimer: Major Players sorted in no particular order

Power Transistor Market Companies Covered in this Report
- Infineon Technologies AG
- ON Semiconductor Corp.
- STMicroelectronics N.V.
- Mitsubishi Electric Corp.
- Texas Instruments Inc.
- Fuji Electric Co. Ltd.
- Renesas Electronics Corp.
- Toshiba Electronic Devices and Storage Corp.
- Wolfspeed Inc. (Cree)
- Navitas Semiconductor
- Broadcom Inc.
- Rohm Co. Ltd.
- Vishay Intertechnology
- Alpha and Omega Semiconductor
- Littelfuse Inc.
- IXYS Integrated Circuits Division
- Power Integrations Inc.
- Nexperia B.V.
- Microchip Technology Inc.
- GeneSiC Semiconductor
- Fairchild (onsemi legacy)
- NXP Semiconductors
Market Opportunities and Future Outlook
Near-term whitespace shows up where OEMs are refreshing power conversion platforms for AI data centers, electrified mobility, and grid-connected energy systems, particularly when wide-bandgap devices help address thermal and switching constraints. STMicroelectronics provides one product anchor, releasing 700 V PowerGaN transistors in May 2026 for high-efficiency power stages in AI servers and robotics. Toshiba also launched an 80 V N-channel power MOSFET for AI data center power supplies in June 2026 using its U-MOS11-H process, with a stated 26% lower on-resistance versus prior generations. Together, these launches point to opportunity in mid-voltage server power architectures (48 V rails, high-frequency conversion), where efficiency and power density requirements keep re-qualification cycles active and favor newer device and process generations.
Supply chain localization and capacity additions also open entry points for materials, packaging, and qualified manufacturing services, especially for WBG. In July 2026, Infineon opened its Smart Power Fab in Dresden, supported by a five billion euro investment to expand 300 mm manufacturing for power semiconductors. In July 2026, Robert Bosch commenced sample production of SiC semiconductors at Roseville, California, supported by a USD 225 million U.S. CHIPS Act direct funding agreement as part of a USD 2 billion investment. These capacity moves support second-source strategies, regional sourcing for automotive and infrastructure customers, and packaging/module ecosystems that can convert higher wafer output into automotive-grade and data-center-grade qualified devices.
Recent Industry Developments in Power Transistor Market
- June 2026: Toshiba Electronic Devices & Storage Corporation launched the TPM1R408RH 80 V N-channel power MOSFET for AI data center power supplies using its U-MOS11-H process. The device targets lower conduction losses through reduced on-resistance, supporting higher power density in server power conversion stages.
- May 2026: STMicroelectronics released a new series of 700 V PowerGaN transistors (HEMTs) within the STPOWER portfolio, with continuous current ratings spanning 6 A to 29 A. The launch expands GaN design options for high-efficiency power stages used in AI servers and robotics where fast switching and compact layouts are prioritized.
- May 2026: Toshiba Electronic Devices & Storage Corporation started shipping test samples of the TW007D120E 1200 V trench-gate SiC MOSFET aimed at next-generation AI data center power supply systems. Sampling supports customer evaluation and qualification of higher-voltage, higher-efficiency SiC devices for demanding power conversion platforms.
Power Transistor Market Report Scope and Research Methodology
Market Definition and Coverage
For this report, the market is defined as revenue earned from power transistors used to switch or control electrical power in end equipment, counted globally at the device level and reported in USD value terms.
Scope exclusions: We exclude passive components, full power modules that are not transistor-based, and small-signal transistors that are designed mainly for amplification rather than power switching.
Segments Covered in This Report
- By Product
- Low-Voltage FETs
- High-Voltage FETs
- Discrete IGBT
- IGBT Modules
- Super-Junction MOSFETs
- RF and Microwave Transistors
- Wide-Bandgap Power Transistors (SiC, GaN)
- By Material
- Silicon
- Silicon Carbide (SiC)
- Gallium Nitride (GaN)
- Gallium Arsenide (GaAs)
- Others
- By Type
- Bipolar Junction Transistor (BJT)
- Field-Effect Transistor (MOSFET, JFET)
- Heterojunction Bipolar Transistor (HBT)
- By Packaging
- Discrete Devices
- Power Modules
- Power ICs/Integrated Power Stages
- By Power Rating
- Low Power (Less than40 V)
- Medium Power (40-600 V)
- High Power (Above 600 V)
- By End-User Industry
- Automotive and EV/HEV
- Consumer Electronics and Mobile
- Industrial Automation and Motor Drives
- Energy and Power (Renewables, Smart Grid)
- Data Centers and HPC
- Telecom and 5G Infrastructure
- Aerospace and Defense
- By Application
- Inverters and Converters
- Motor Control and Drives
- Power Supplies and Adapters
- Battery Charging and BMS
- RF Power Amplifiers
- Lighting and Display Drivers
- By Geography
- North America
- United States
- Canada
- Mexico
- Europe
- Germany
- United Kingdom
- France
- Italy
- Spain
- Nordics (Denmark, Sweden, Norway, Finland)
- Rest of Europe
- Asia-Pacific
- China
- Japan
- South Korea
- India
- Southeast Asia
- Australia
- Rest of Asia-Pacific
- South America
- Brazil
- Argentina
- Rest of South America
- Middle East
- Gulf Cooperation Council Countries
- Turkey
- Rest of Middle East
- Africa
- South Africa
- Nigeria
- Rest of Africa
- North America
Data Sources, Market Sizing, and Validation
Desk Research
Desk research started by mapping demand and supply context for power transistors across key end uses such as EV powertrains, charging, renewables inverters, industrial drives, and power supplies. We referenced public sources like the International Energy Agency for EV and charging indicators, the International Renewable Energy Agency for renewable additions, World Semiconductor Trade Statistics for broader semiconductor cycle signals, UN Comtrade for trade patterns tied to relevant electronics categories, and IEEE and other peer-reviewed publications for technology adoption cues.
On the supply side, we reviewed company annual reports, 10-K style filings, investor presentations, association websites, and reputable press to track capacity expansion, device roadmaps, and packaging shifts. Where needed, we used a paid subscription covering company financials and another covering patent databases to cross-check timelines and confirm which transistor families were being emphasized in new designs. The sources named above are illustrative, and we also used other public documents and datasets for data collection, validation, and clarification.
Primary Interviews and Surveys
Primary interviews and surveys were used to validate what desk inputs could not fully explain, especially pricing moves, design-in cycles, and real shipment momentum by end equipment category. We spoke with device suppliers, distributors, OEM engineering and sourcing teams, and industry experts across APAC, EMEA, and the Americas so program qualification and ramp timelines could be tested against how accounts are awarded, qualified, and scaled.
Distribution of primary research fieldwork respondents
| Company type | Respondent position | Region |
|---|---|---|
| Top tier: 37% | CXOs: 12% | APAC: 44% |
| Mid tier: 44% | Functional/Unit leaders: 30% | EMEA: 29% |
| Smaller Players: 19% | Managers: 58% | Americas: 27% |
Market-Sizing & Forecasting
The core sizing was built using a top-down and bottom-up logic. First, the top-down build reconstructed the addressable demand pool by linking end-market output indicators to power conversion content, then translating that into annual device value using realistic adoption and replacement patterns. After that, we applied selective bottom-up checks using sampled shipment conversations, distributor channel checks, and ASP times volume sanity builds for key device families, with the total adjusted when gaps emerged.
Key market inputs used in the model included EV production and electrification mix, renewable and storage inverter deployments, industrial motor drive demand, telecom and data center power supply build rates, and the shift in device mix toward higher-efficiency options. Pricing was handled through an ASP curve that reflects wafer and packaging cost pressure, learning effects, and mix changes across low-voltage FETs, high-voltage FETs, and IGBT-related products. Where direct volume visibility was not available, we used conservative penetration bands informed by interviews and then tested these bands against independent demand signals.
For forecasting, we used scenario analysis supported by multivariate regression checks on the strongest demand drivers. The forward curve was also reviewed with primary respondents to avoid unrealistic step changes. The forecast accounts for design win lag, qualification cycles, and the fact that some demand moves with industrial cycles rather than purely with consumer electronics trends.
Data Validation & Update Cycle
Validation was done through stepwise triangulation, where modeled totals were compared against independent signals such as end-equipment shipment trends, trade directionality, and the timing of capacity expansions. When outliers appeared, we drilled into the specific assumption that caused the jump, then checked it again using at least one independent desk source and a fresh primary touchpoint.
Before sign-off, the model and narrative go through multiple analyst reviews so arithmetic, units, and scope boundaries remain consistent across regions and years. The report is refreshed annually, and interim updates are made when material events occur, such as major policy shifts, supply disruptions, or step changes in technology adoption. Right before delivery, we perform a final update pass so clients receive the latest market view available.
Mordor Intelligence's Global Power Transistor Market Size Versus Other Published Estimates
Published market sizes for power transistors can look far apart because each publisher draws the market boundary differently, then applies its own choices for base year, exchange rates, and price progression. Differences also come from whether values are counted at the discrete device level or bundled with adjacent power device categories.
By tracking end-equipment build indicators and refreshing the ASP and device-mix curve annually, Mordor Intelligence keeps the market total tied to transistor-only revenues, rather than counting adjacent power devices that sit outside the power transistor scope.
Benchmark comparison
| Source | Market Size | Gaps in Research Methodology |
|---|---|---|
| Mordor Intelligence | USD 22.63 B (2026) | |
| Industry Data Publisher A | USD 11.80 B (2024) | Uses a narrower counted value pool that appears closer to discrete-only revenues in select applications, and it may apply conservative ASP assumptions without fully reflecting newer EV and renewable design-ins. |
| Market Bulletin B | USD 16.26 B (2025) | Likely applies an aggressive growth path and may include adjacent power devices or broader component content per system, which lifts the starting value and speeds up the forecast curve. |
Overall, the spread in published numbers is mostly explained by what gets counted in-scope and how quickly prices and mix are assumed to move. Our method stays repeatable because the market total is built from clear demand drivers, checked with channel and supplier feedback, and then reconciled so the final value remains consistent with real-world adoption and cycle patterns.
Key Questions Answered in the Report
What is the current size of the power transistor market?
The power transistor market size stands at USD 22.63 billion in 2026 and is projected to reach USD 30.07 billion by 2031.
Which segment is growing fastest within the power transistor market?
Wide-bandgap power transistors, particularly GaN and SiC devices, exhibit the highest product-level CAGR at 7.95% through 2031.
Why is GaN gaining share in the power transistor industry?
GaN handles higher switching frequencies with lower conduction losses, enabling smaller, more efficient chargers, telecom radios, and data-center supplies, and is forecast to grow at a 9.45% CAGR to 2031.
Which end-user sector will add the most new revenue?
Data centers and high-performance computing, driven by AI workloads and stringent energy-efficiency targets, record the fastest CAGR at 10.40% to 2031.
What is the main supply-chain risk facing power transistor manufacturers?
Chronic shortages of SiC substrates constrain wafer availability, raise bill-of-materials costs, and may slow high-power module deployment until new 200 mm capacity ramps after 2026.
How concentrated is the competitive landscape?
The top five vendors control about 65% of global revenue, yielding a moderate concentration score of 6, with consolidation and vertical integration reshaping the field.