
Power Management System Market Size and Share
Market Overview
| Study Period | 2021 - 2031 |
|---|---|
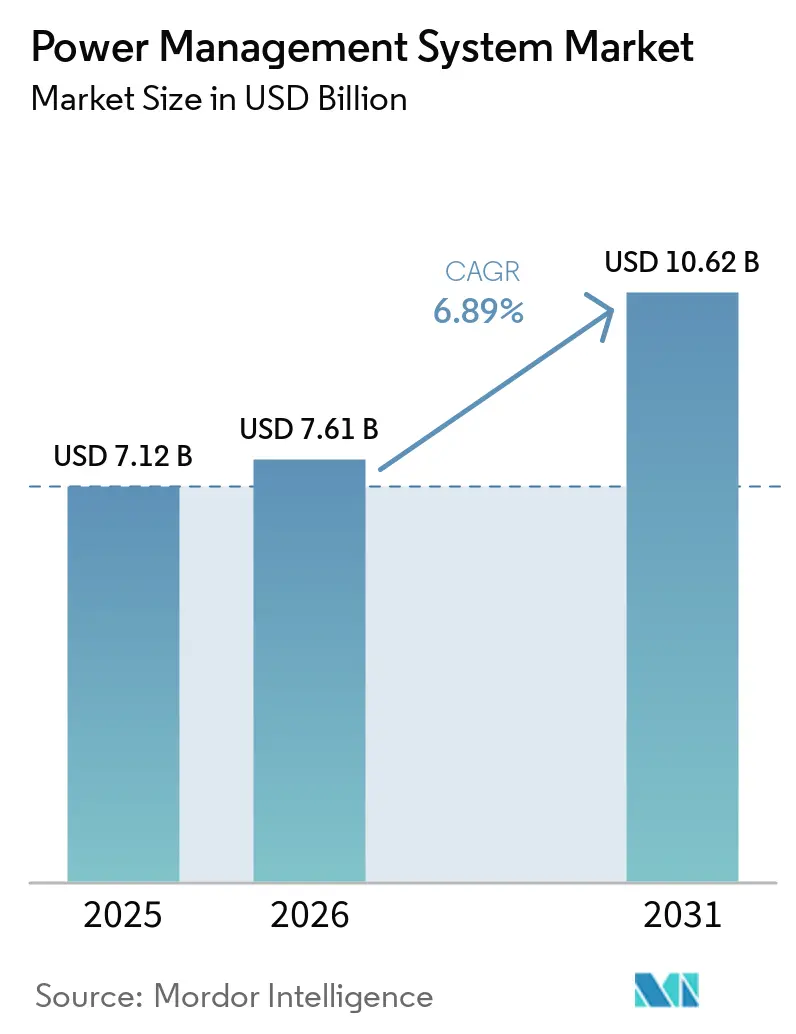
| Market Size (2026) | USD 7.61 Billion |
| Market Size (2031) | USD 10.62 Billion |
| Growth Rate (2026 - 2031) | 6.89 % |
| Fastest Growing Market | Asia Pacific |
| Largest Market | North America |
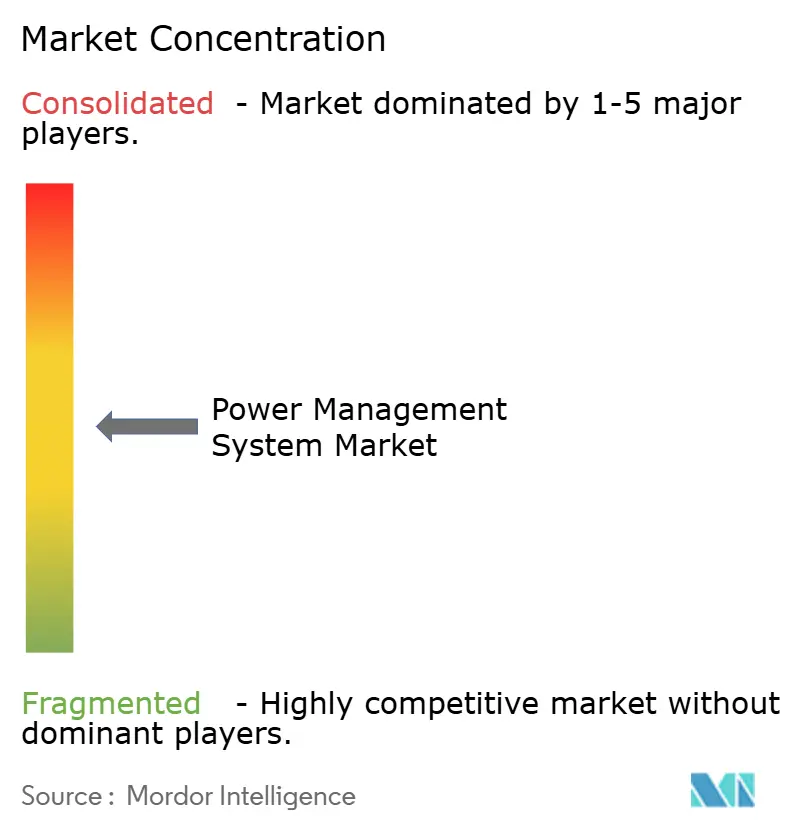
| Market Concentration | Medium |
Major Players *Disclaimer: Major Players sorted in no particular order Image © Mordor Intelligence. Reuse requires attribution under CC BY 4.0. | |
Power Management System Market Analysis by Mordor Intelligence
The Power Management System market size is expected to grow from USD 7.12 billion in 2025 to USD 7.61 billion in 2026 and is forecast to reach USD 10.62 billion by 2031 at 6.89% CAGR over 2026-2031.
Rising AI workloads, expanding renewable penetration, and the need for intelligent load orchestration underpin this momentum. North American hyperscale data center expansion, coupled with Asia-Pacific industrial automation mandates, accelerates demand for real-time optimization platforms. Simultaneously, supply-chain constraints in medium-voltage equipment elevate the strategic importance of software-defined energy management. Vendors respond through acquisitions that deepen analytics portfolios and fortify cybersecurity, positioning the power management system market for resilient growth.
Key Report Takeaways
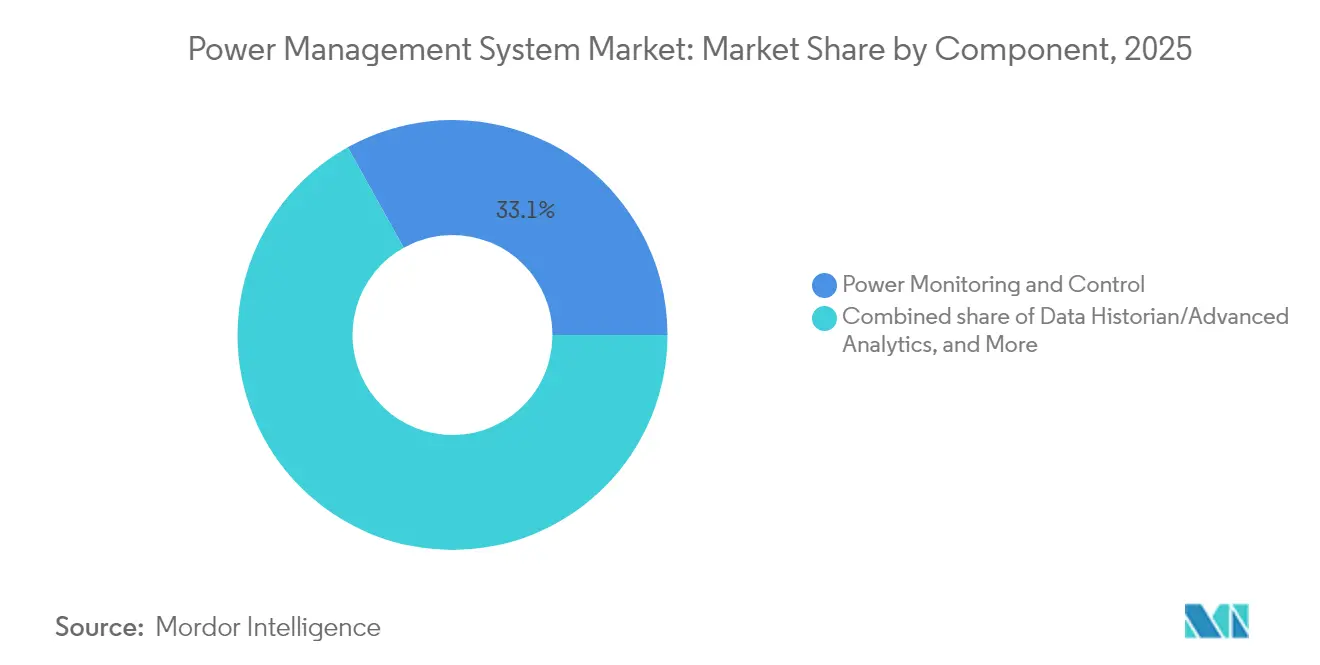
- By component, Power Monitoring & Control held 33.10% of the power management system market share in 2025, while Data Historian/Analytics is projected to post a 10.62% CAGR through 2031.
- By power architecture, centralized PMS captured 47.70% of the power management system market size in 2025; modular/hybrid PMS is anticipated to expand at a 9.37% CAGR through 2031.
- By end-user, utilities commanded 34.30% revenue share of the power management system market in 2025, whereas data centres are forecast to register a 10.05% CAGR over 2026-2031.
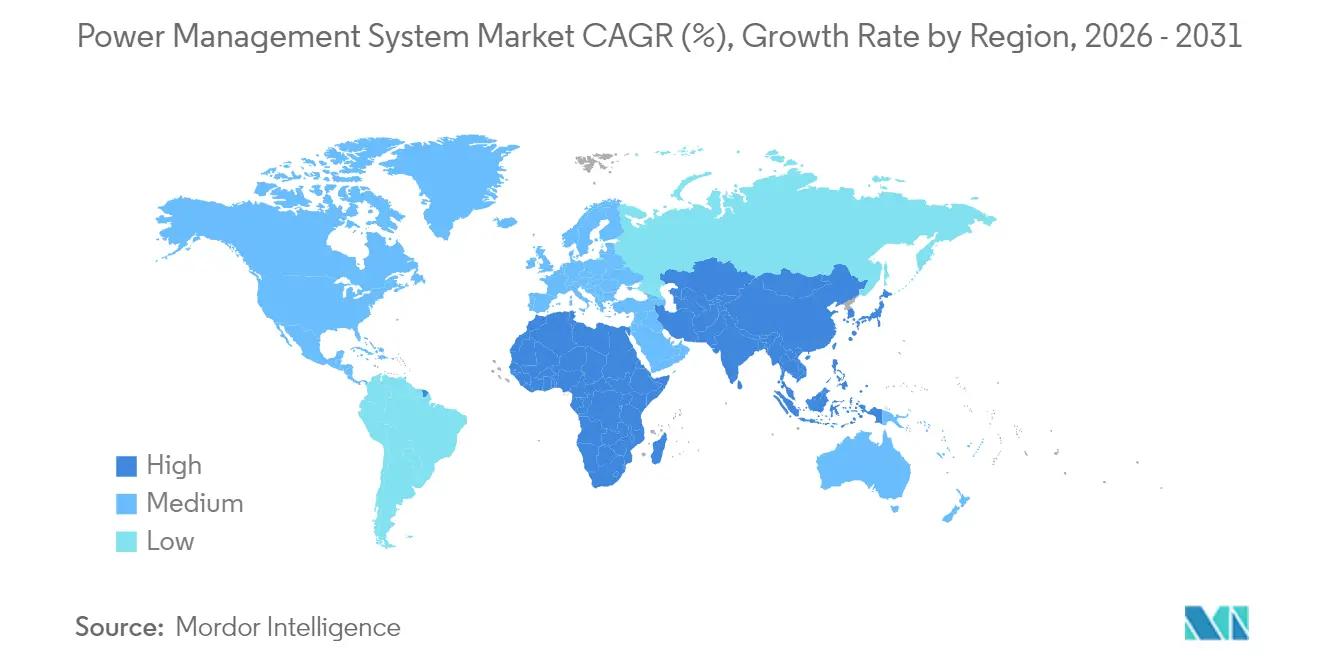
- By geography, North America led with 32.40% of 2025 revenue, but the Asia-Pacific region is poised for 8.98% CAGR growth through 2031.
Note: Market size and forecast figures in this report are generated using Mordor Intelligence’s proprietary estimation framework, updated with the latest available data and insights as of 2026.
Market Trends and Insights
Drivers Impact Analysis of Power Management System Market*
| Driver | (~) % Impact on CAGR Forecast | Geographic Relevance | Impact Timeline |
|---|---|---|---|
| Regulatory pressure for industrial-scale energy efficiency programs | +1.20% | Global (early gains in EU, Japan, California) | Medium term (2-4 years) |
| Rapid renewable-grid integration driving grid-stability solutions | +1.80% | Global, concentrated in APAC, North America, EU | Long term (≥ 4 years) |
| Exponential rise of hyperscale & AI data-center power demand | +2.10% | North America & EU, spill-over to APAC core | Short term (≤ 2 years) |
| Digitalisation/IIoT enabling real-time optimisation & analytics | +1.40% | Global, early adoption in North America, Germany | Medium term (2-4 years) |
| Wide-bandgap (SiC/GaN) semiconductors slash switching losses | +0.90% | Global, led by automotive and renewable sectors | Long term (≥ 4 years) |
| Corporate PPAs create micro-grid complexity needing PMS orchestration | +0.60% | North America, EU, emerging in APAC | Medium term (2-4 years) |
| Source: Mordor Intelligence | |||
Regulatory Pressure for Industrial-Scale Energy Efficiency Programs
Minimum performance standards now apply to commercial furnaces in the United States, requiring 80% thermal efficiency for gas-fired units and 81% for oil-fired systems. Japan’s Energy Efficiency Act obliges designated factories to appoint certified energy managers and submit annual performance reports, fostering systematic energy savings that have reached 26% in early deployments.(1)International Energy Agency, “Japan Energy Efficiency Act Analysis,” iea.orgSimilar mandates across the EU accelerate digital retrofits and strengthen the power management system market as plants race to document real-time energy performance.
Rapid Renewable-Grid Integration Driving Grid-Stability Solutions
Intermittent solar and wind are forecast to supply 57% of global service-load electricity by 2050, challenging conventional frequency-control paradigms. Flexible AC transmission systems paired with hybrid storage deliver 30% stability improvements and cut total harmonic distortion below 2% compared with legacy designs. These technical gains stimulate procurement of advanced orchestration software that balances variable supply and demand across microgrids, bolstering the power management system market.
Exponential Rise of Hyperscale & AI Data-Center Power Demand
AI training clusters push rack densities to 80-100 kW, versus 5-10 kW for legacy workloads. U.S. data center electricity demand is set to reach 35 GW within five years, with AI responsible for half of the incremental load.(2)Schneider Electric, “U.S. Data Center Demand Forecast,” se.comOperators adopt grid-independent microgrids and asset-level analytics, propelling immediate uptake of predictive energy management solutions across the power management system market.
Wide-Bandgap (SiC/GaN) Semiconductors Slash Switching Losses
SiC devices excel above 800 V, while GaN devices perform better below 400 V, offering superior high-frequency performance.(3)IEEE Spectrum, “SiC vs. GaN: The Future of Power Electronics,” ieee.orgEfficiency gains across inverters, chargers, and solid-state transformers make WBG devices central to renewable and EV ecosystems, indirectly fuelling demand for adaptive control layers within the power management system market.
Restraints Impact Analysis of Power Management System Market*
| Restraint | (~) % Impact on CAGR Forecast | Geographic Relevance | Impact Timeline |
|---|---|---|---|
| High upfront system & retrofit costs | -1.30% | Global, acute in emerging markets | Short term (≤ 2 years) |
| Escalating cyber-security & data-sovereignty risks | -0.80% | Global, heightened in critical infrastructure sectors | Medium term (2-4 years) |
| Transformer & switchgear supply-chain bottlenecks | -1.10% | Global, most severe in North America and EU | Short term (≤ 2 years) |
| Legacy OT / IT interoperability barriers | -0.70% | Global, concentrated in heavy industry and utilities | Long term (≥ 4 years) |
| Source: Mordor Intelligence | |||
High Upfront System & Retrofit Costs
Budget constraints slow adoption in price-sensitive economies where capital recovery timelines exceed typical board expectations. Equipment plus integration outlays can exceed USD 1 million for a mid-sized plant, pressuring CFOs to delay digital retrofits. Government incentives mitigate some burden, yet financing gaps persist, temporarily tempering the expansion of the power management system market.
Escalating Cyber-Security & Data-Sovereignty Risks
Expanded connectivity broadens attack surfaces. Air-gap strategies, once common in operational technology, are giving way to secure gateways that require IEC 62443-certified devices, such as ABB’s SL2-rated air circuit breaker. Compliance costs and concerns about breaches restrain full-scale cloud adoption among critical infrastructure owners.
*Our forecasts treat driver/restraint impacts as directional, not additive. The impact forecasts reflect baseline growth, mix effects, and variable interactions.
Power Management System Market Segment Analysis
By Component:
Data Analytics Drives Digital TransformationPower Monitoring & Control booked USD 2.36 billion in 2025, equivalent to 33.10% of the power management system market size. Legacy SCADA platforms remain indispensable for breaker status and feeder metering; however, operators are increasingly overlaying power monitoring system historian databases that unlock cross-site benchmarking. Data Historian/Advanced Analytics is projected to have the quickest trajectory, with a 10.62% CAGR, reaching USD 2.66 billion by 2031, as AI-driven predictive models reduce unplanned downtime and cut energy waste. Load Shedding and Management tools leverage optimisation algorithms that trim load overcut by 30% compared to rule-based logic, sharpening industrial resiliency. Generator Controls gain relevance in microgrid deployments, with GE’s PowerNode initiating protective load-sheds within 15 milliseconds while safeguarding cyber-perimeters through IEC 61850 GOOSE messaging.
Integrated suites now converge monitoring, historian, and optimisation modules into cloud-ready dashboards, with power system analysis software helping operators evaluate grid performance and optimize energy flows across complex facilities. Vendors embed secure APIs, allowing third-party developers to build applications on top of core data services. ABB’s SACE Emax 3 breaker showcases this shift by exposing energy-quality metrics directly into historian pipelines. As decarbonisation mandates tighten, analytics modules quantify avoided emissions and monetise demand-response credits, elevating their share of new-build specifications.


By Power-Architecture:
Hybrid Solutions Address Flexibility DemandsCentralised architectures accounted for 47.70% of 2025 revenue, favoured by utilities and oil & gas owners that value proven redundancy. However, modular/hybrid configurations are projected to achieve a 9.37% CAGR, as AI workloads and renewable intermittency necessitate edge-level autonomy. Distributed PMS nodes placed at the turbine level or rack level circumvent latency, maintaining critical control during WAN outages. Emerson’s Ovation 4.0 incorporates software-defined modules and generative AI guidance, illustrating the pivot to micro-services that reconfigure without site downtime.
Hybrid topologies combine central oversight with local agents, striking a balance between reliability and agility across complex estates. Multi-agent frameworks deployed in wind-solar-battery farms achieve significant peak shaving and frequency stabilisation. As a result, the power management system market gravitates toward libraries of containerized functions deployable in either data center pods or embedded gateway hardware. System integrators differentiate through reference-architecture blueprints that accelerate commissioning while maintaining cyber-hardening.
By End-User Industry:
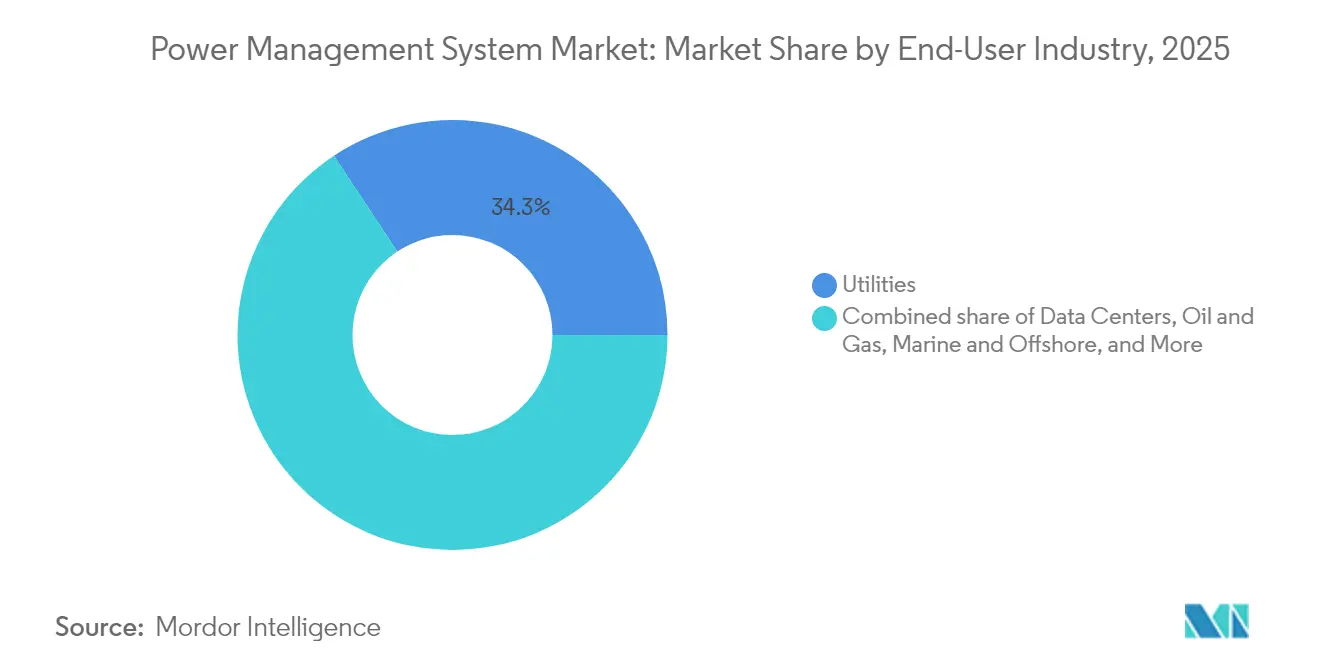
Data Centers Surge Amid Infrastructure ModernizationUtilities generated USD 2.44 billion in 2025, translating to 34.30% of the power management system market. Grid operators rely on fast-acting voltage-var supports and adaptive islanding logic to absorb 57% renewable penetration forecasts. Data centres, though on a smaller scale, will climb at a 10.05% CAGR as hyperscalers race to manage 500 MW-scale campuses with grid-independent power blocks. Oil & gas facilities are maintaining steady investments to electrify offshore platforms and reduce flare-gas emissions. Marine & offshore fleets install DC distribution and hybrid propulsion that trim fuel burn and cut maintenance costs.
Metals & mining initiatives realise up to a 10% energy-efficiency uplift through digital energy management; ArcelorMittal recovers 22% of blast-furnace gas, slashing CO₂ emissions by 340,000 tonnes annually. Chemical and pharmaceutical operations embed resource-efficiency indicators that shave more than 1% of total energy costs each year. Hospitals and telecom exchanges in the “Others” category benefit from common reference architectures that simplify ISO 50001 compliance, broadening the end-user base of the power management system market.
Geography Analysis
North America Power Management System Market
North America contributed 32.40% of 2025 revenue, underpinned by the Inflation Reduction Act and a pipeline of more than 30 GW in new data-center power agreements. Federal incentives have encouraged Schneider Electric to commit USD 700 million toward U.S. manufacturing expansion, enhancing domestic supply resilience. Canada’s Industry Partnership for Energy Conservation sponsors ISO 50001 adoption grants, while Mexican transformer investments mitigate regional bottlenecks.
Europe Power Management System Market
Europe maintains a stringent regulatory environment that mandates corporate sustainability reporting and tightens eco-design rules, sustaining steady demand across Germany, France, and the United Kingdom. Industrial automation upgrades in Germany deploy historian-driven OEE dashboards, whereas the U.K. pushes smart-grid pilots funded by Ofgem innovation programs. The Corporate Sustainability Reporting Directive drives enterprises to integrate granular energy data into ESG workflows, thereby strengthening the uptake of analytics throughout the power management system market.
APAC Power Management System Market
Asia-Pacific region is poised for a 8.98% CAGR. China’s national power market saw green-electricity trading exceed 220 TWh in early 2025, spurring utilities to adopt AI-enabled dispatch planning. India advances industrial energy efficiency under the Perform, Achieve, and Trade scheme and commits to achieving 11.4% transformer efficiency gains by 2027 through Japan’s Top Runner collaboration. Japan’s chemical clusters embrace factory-wide IIoT overlays, while Australia pilots integrated microgrids to support remote mining operations.

Regulatory Landscape
Regulation is increasingly targeting both energy-efficiency reporting and the secure operation of connected power-control assets, shaping how power management system specifications are written. In the United States, the Federal Energy Regulatory Commission (FERC) approved 11 modified Critical Infrastructure Protection (CIP) Reliability Standards in March 2026, with the changes effective May 26, 2026. This reinforces cybersecurity and compliance requirements for grid-connected monitoring and control environments. In parallel, Japan continues to enforce its Energy Efficiency Act obligations for designated factories to appoint certified energy managers and submit annual performance reports, supporting continuous monitoring, metering, and audit-ready data layers in industrial PMS deployments.
Policy activity is also expanding to product and software design rules and to large-load integration. The European Commission adopted Regulation (EU) 2025/2052 in October 2025, setting new ecodesign requirements for external power supplies and charging devices, with applicability from December 14, 2028. That affects upstream power conversion and measurement architectures that interface with management software. In April 2026, China MIIT issued Industrial Product Green Design Guidelines (2026 Edition), including requirements for BMS and EMS software to incorporate zero-carbon modules, tightening environmental design expectations for digital energy platforms. For grid operations, FERC issued show-cause orders in June 2026 to multiple RTOs/ISOs under FPA Section 206 on large-load integration rules, reinforcing the need for telemetry, controllability, and compliance-grade load orchestration for hyperscale and AI-driven demand centers.
Competitive Landscape
Moderate consolidation defines the ecosystem, with top suppliers expanding through targeted acquisitions. ABB’s acquisition of Siemens Gamesa’s power electronics division added 40 GW of installed renewable converter capacity, reinforcing its wind, solar, and storage offerings. In Q2 2025, ABB reported record USD 9.8 billion in orders, reflecting robust grid modernization spend. Schneider Electric’s USD 700 million U.S. program boosts switchgear and UPS capacity, directly addressing the AI-driven demand for data centers.
Technology differentiation now centres on AI-native platforms and cyber-resilience. Emerson’s Ovation 4.0 embeds Microsoft Azure OpenAI services, enabling conversational support for operators and accelerating mean time to remediation. Eaton is scaling high-power DC infrastructure through the acquisition of Resilient Power Systems, anticipating rapid electrification of mobility and edge-computing hubs.
White-space opportunities remain in microgrid orchestration for campuses with corporate PPAs. Start-ups are developing solid-state transformers and SiC-based converters that promise significant improvements in conversion efficiency. Incumbents counter by integrating open-API marketplaces, ensuring third-party innovators can plug analytics into base PMS installations, sustaining competitive dynamism across the power management system market.
Power Management System Industry Leaders
ComAp AS
Brush Group
ABB LIMITED
etap (Operation Technology Inc.)
Wartsila oyj abp
- *Disclaimer: Major Players sorted in no particular order
Power Management System Market Companies Covered in this Report
- ABB Ltd
- Siemens Energy
- Schneider Electric SE
- General Electric Vernova
- Mitsubishi Electric Corporation
- Eaton Corporation plc
- Emerson Electric Co.
- Wartsila Oyj Abp
- ComAp AS
- ETAP / Operation Technology Inc.
- Rockwell Automation
- Honeywell International Inc.
- Yokogawa Electric Corporation
- SEL Schweitzer Engineering Labs
- Kongsberg Gruppen ASA
- RH Marine Netherlands BV
- INTECH Process Automation Inc.
- Marine Control Services
- Delta Electronics Inc.
- Texas Instruments (PMIC business)

Market Opportunities and Future Outlook
Standards-driven interoperability is creating whitespace for vendors that can package compliance, integration, and verification tooling into PMS/EMS deployments. IEC 62933-5-2:2026 formalizes interface requirements for power conversion systems and energy management systems in energy storage applications, including support for virtual power plant dispatch instructions with millisecond-level response behavior. This raises the value of validated control stacks, test harnesses, and secure communications adapters bundled with PMS software. In mobility and electrified platforms, SAE International published Information Report J3311_202603 (March 2026), defining the Central System Power Manager concept for vehicle electrical and electronic architectures. That broadens the addressable set of power orchestration use cases beyond traditional industrial and utility sites toward embedded, multi-domain energy and thermal coordination.
Large solar-plus-storage and factory-scale energy storage buildouts are also expanding demand for multi-asset dispatch, analytics, and availability optimization, areas where PMS vendors can attach recurring software and services to hardware-heavy projects. Masdar reached financial close in July 2026 on a 5.2 GW solar plus 19 GWh storage project in Abu Dhabi (with BESS technology from BYD and Sungrow), reflecting the scale at which orchestration, grid-code compliance, and performance monitoring are procured alongside power conversion. Supply chain localization and consolidation are opening partnering routes as well. Waaree Energies opened a 5.15 GWh annual capacity BESS assembly facility in July 2026, and Nextpower launched an energy storage business in July 2026 after completing its Prevalon Energy acquisition, bringing a multi-gigawatt-hour deployed base into its portfolio. These moves increase the number of storage OEM and integrator ecosystems seeking standardized EMS/PMS integration, cybersecurity hardening, and fleet-level data historian and optimization modules aligned with utility and large-load requirements.
Recent Industry Developments in Power Management System Market
- April 2026: ComAp launched the InteliDrive 700 Marine, an engine supervision system designed to integrate with the InteliGen 1000 Marine power management system. The release strengthens end-to-end monitoring and control for hybrid and DC power architectures used in marine and offshore applications. It also improves coordination between propulsion-side supervision and onboard power optimization as fleets electrify auxiliary loads.
- July 2025: ABB launched the SL2-certified SACE Emax 3 breaker for critical infrastructure. By aligning low-voltage protection hardware with IEC 62443-oriented security expectations, the product supports safer connectivity between switchgear and supervisory power management layers. This helps asset owners standardize cyber-hardened components as PMS deployments shift toward more networked architectures.
- July 2024: Emerson released Ovation 4.0 for the power and water industries, introducing a software-defined architecture and generative AI integration. The platform directionally lowers friction for modular upgrades and multi-site standardization, which is increasingly relevant for operators adding renewables and distributed assets. It also reinforces the shift toward analytics-led operations in power management environments that span OT and IT systems.


Power Management System Market Report Scope and Research Methodology
Market Definition and Coverage
We size the global power management system market as revenues earned from power management hardware and integrated system solutions that monitor, control, and optimize electrical power flow, protection, and load sharing across industrial, commercial, marine, and similar end uses.
Scope exclusions: We exclude standalone energy billing software, general building automation platforms, and pure electrical components that are not sold as part of a power management system.
Segments Covered in This Report
- By Component
- Power Monitoring and Control
- Load Shedding and Management
- Energy Cost Accounting and Optimisation
- Switching and Safety Management
- Generator Controls
- Data Historian/Advanced Analytics
- By Power-Architecture
- Centralised PMS
- Distributed PMS
- Modular / Hybrid PMS
- By End-User Industry
- Utilities
- Data Centres
- Oil and Gas
- Marine and Offshore
- Metals and Mining
- Chemicals and Pharmaceuticals
- Others (Manufacturing, Healthcare, Telecom)
- By Geography
- North America
- United States
- Canada
- Mexico
- Europe
- Germany
- United Kingdom
- France
- Italy
- Spain
- NORDIC Countries
- Russia
- Rest of Europe
- Asia Pacific
- China
- India
- Japan
- South Korea
- ASEAN Countries
- Rest of Asia Pacific
- South America
- Brazil
- Argentina
- Chile
- Rest of South America
- Middle East and Africa
- Saudi Arabia
- United Arab Emirates
- South Africa
- Nigeria
- Egypt
- Rest of Middle East and Africa
- North America
Data Sources, Market Sizing, and Validation
Desk Research
Desk work started with a simple scope map so each revenue line is counted only once, and then we gathered public indicators that explain where power management demand is strongest. Common inputs came from sources such as International Energy Agency data on electricity trends, US Energy Information Administration releases, IEEE and other peer reviewed papers on power quality and protection, and statistics from agencies like Eurostat.
We also reviewed manufacturer product catalogs, investor presentations, and annual filings to understand where system level power management sits versus adjacent switchgear and monitoring products. Where company level splits were not disclosed, we used paid subscriptions that provide company financial intelligence and an import and export shipment level database to pressure test regional demand patterns. These desk sources are not exhaustive, and many other public documents were used to collect data, validate assumptions, and clarify definitions.
Primary Interviews and Surveys
Primary interviews and surveys were used to confirm what buyers actually procure as a power management system and how pricing moves with system complexity. We spoke with a mix of OEMs, distributors, EPC and integration partners, and end user electrical teams across APAC, EMEA, and the Americas, which helped us close gaps around typical project sizes, replacement cycles, and attach rates of monitoring and control modules.
Distribution of primary research fieldwork respondents
| Company type | Respondent position | Region |
|---|---|---|
| Top tier: 29% | CXOs: 15% | APAC: 43% |
| Mid tier: 56% | Functional/Unit leaders: 31% | EMEA: 34% |
| Smaller Players: 15% | Managers: 54% | Americas: 23% |
Market-Sizing & Forecasting
Sizing was built using top-down and bottom-up logic. We first reconstructed the demand pool by linking electrical infrastructure activity to power management system adoption, and then the totals were corroborated with selective bottom-up checks using sampled pricing and volumes from supplier and channel conversations.
Key inputs in the model included indicators such as industrial electricity consumption growth, capital spending signals tied to grid and facility upgrades, installed base expansion in data centers and critical facilities, the typical refresh cycle for controllers and protection modules, and average system value by application complexity (for example, marine load sharing systems tend to price differently than basic facility power control). When a data series was incomplete for a country, we used regional analogs and then adjusted with interview feedback so the gap handling stayed traceable.
For forecasting, scenario analysis was applied, anchored on expert views about electrification pace, efficiency compliance requirements, and project pipeline timing, and then checked against recent historical growth to avoid unrealistic step changes.
Data Validation & Update Cycle
Outputs were checked in several passes so the totals align with real world adoption signals. We compared implied spending per site and per installed capacity against independent metrics, and large variances were reviewed back to underlying assumptions like pricing, replacement cycle, and regional mix.
Before sign-off, analysts run consistency checks across regions and re-contact interviewees when a new contract cycle, regulation change, or sharp macro shift could move demand. Reports refresh annually, and interim updates are made when material events occur, followed by a final pre-delivery review so clients receive the latest updated view.
Mordor Intelligence's Global Power Management System Market Size Versus Other Published Estimates
Published market sizes for power management systems can look far apart, even when they seem to talk about the same thing, because the counted product scope and the timing of the base year often change from one study to another. Differences also come from how each publisher treats system level pricing, regional mix, and whether project based revenue is recognized at shipment, commissioning, or contract award.
The main gap comes from whether adjacent switchgear, basic power monitoring, and energy management software are folded into the same bucket, where Mordor Intelligence counts only power management hardware and integrated system revenues that directly control and protect power flow. Another driver is ASP progression, since some estimates apply one blended average price across end uses, while others separate higher value marine and critical facility systems from simpler industrial installations, and currency conversion timing can further widen the spread.
Benchmark comparison
| Source | Market Size | Gaps in Research Methodology |
|---|---|---|
| Mordor Intelligence | USD 7.61 B (2026) | |
| Global Industry Publisher A | USD 7.81 B (2025) | Uses a different base year and a broader demand window, and often treats project revenue recognition closer to contract timing, which can lift the earlier year value. |
| Research Platform B | USD 13.00 B (2023) | Appears to include a wider electronics oriented scope and higher level aggregation across power related components, which expands the revenue pool beyond system level power management solutions. |
The spread is mainly explained by what is counted and when it is counted, rather than by one single growth assumption. By keeping the scope tied to system level control and protection functions, and by checking pricing and replacement cycles with industry respondents, the estimate stays easier to reproduce and to reconcile with observable demand signals.


Key Questions Answered in the Report
What is the current size of the power management system market?
The power management system market size measured USD 7.61 billion in 2026 and is forecast to reach USD 10.62 billion by 2031.
Which segment is growing the fastest?
Data Historian/Advanced Analytics is projected to register a 10.62% CAGR through 2031, the highest among all component categories.
Why are data centres driving demand?
Rising AI workloads push rack densities to 80-100 kW, creating complex energy-management requirements that only advanced PMS platforms can satisfy.
Which region will add the most incremental revenue by 2031?
Asia-Pacific is expected to post the highest CAGR at 8.98%, propelled by industrial automation and renewable mandates across China, India, and Japan.
How are supply-chain constraints affecting the market?
Transformer lead times of up to 130 weeks and price hikes of 60-80% delay hardware installations, prompting greater investment in software-centric optimisation.
What role do wide-bandgap semiconductors play in PMS adoption?
SiC and GaN devices enhance conversion efficiency, enabling compact, high-temperature power electronics that integrate seamlessly into next-generation PMS architectures.
Page last updated on:


 Your data is secure and never sold or shared.


