
Market Overview
| Study Period | 2020 - 2031 |
|---|---|
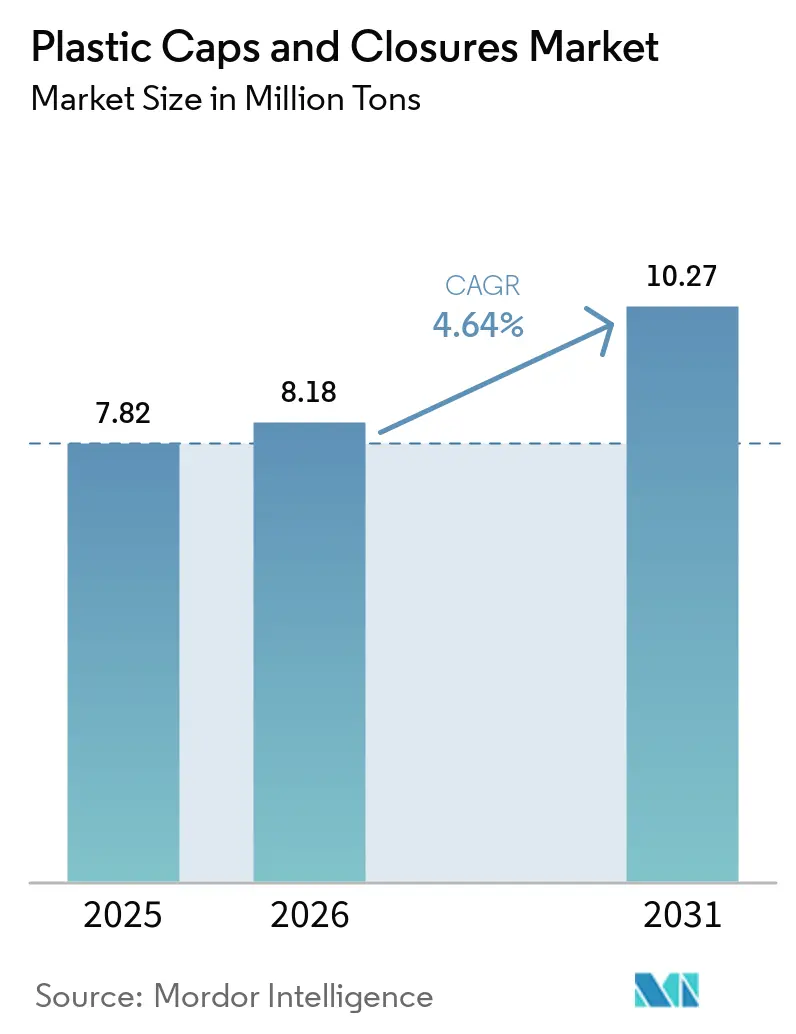
| Market Volume (2026) | 8.18 Million tons |
| Market Volume (2031) | 10.27 Million tons |
| Growth Rate (2026 - 2031) | 4.64 % |
| Fastest Growing Market | Middle East and Africa |
| Largest Market | Asia Pacific |
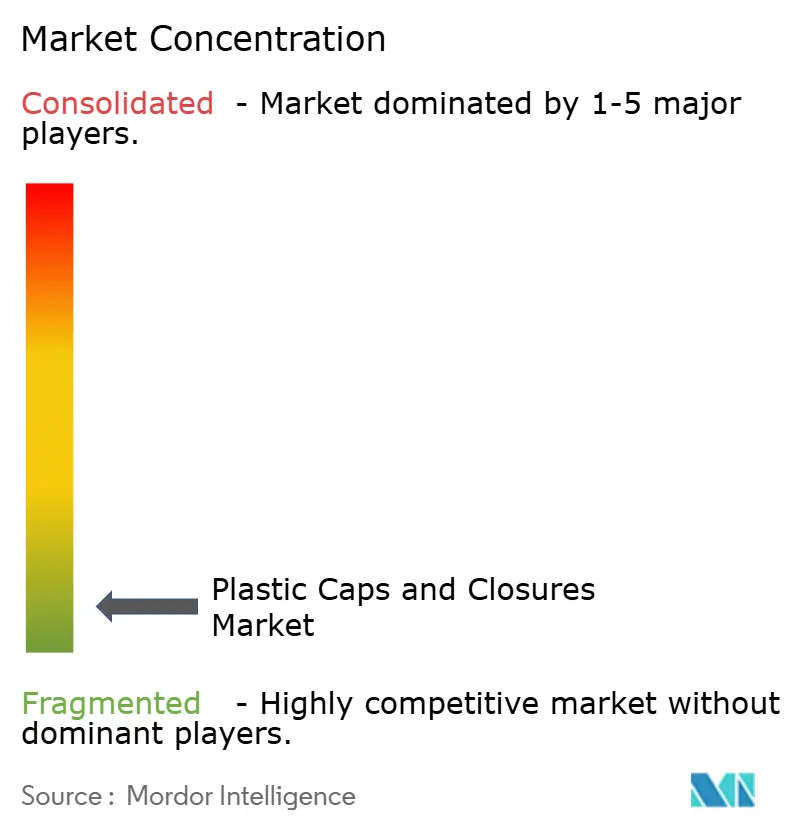
| Market Concentration | Low |
Major Players *Disclaimer: Major Players sorted in no particular order Image © Mordor Intelligence. Reuse requires attribution under CC BY 4.0. | |
Plastic Caps and Closures Market Analysis by Mordor Intelligence
The plastic caps and closures market size was valued at 7.82 million tons in 2025 and estimated to grow from 8.18 million tons in 2026 to reach 10.27 million tons by 2031, at a CAGR of 4.64% during the forecast period (2026-2031). Growth stems from tethered-cap mandates in Europe, surging aseptic PET bottling lines across ASEAN, and rapid pharmaceutical demand for child-resistant polypropylene closures. Consolidation, led by the Amcor–Berry Global combination, is reshaping competitive dynamics while manufacturers race to meet tougher Extended Producer Responsibility (EPR) fee structures. Raw-material volatility for propylene and ethylene remains a near-term headwind, yet sustained investment in compression-molding automation and recycled content is mitigating cost pressure. Across geographies, Asia-Pacific holds the largest share, Middle East and Africa records the fastest CAGR, and North America capitalizes on stringent safety regulations that favor high-value closure formats.
Key Report Takeaways
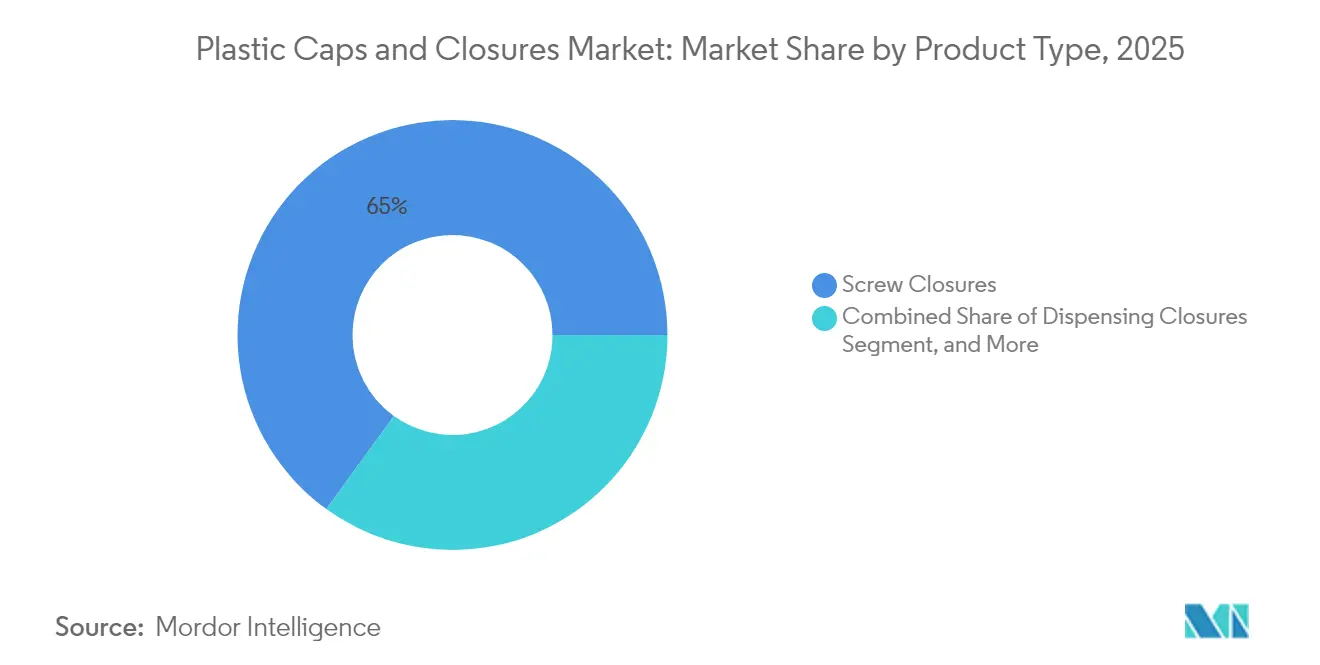
- By product type, screw closures held 65.02% of plastic caps and closures market share in 2025.
- By raw material, polypropylene accounted for 55.71% share of the plastic caps and closures market size in 2025.
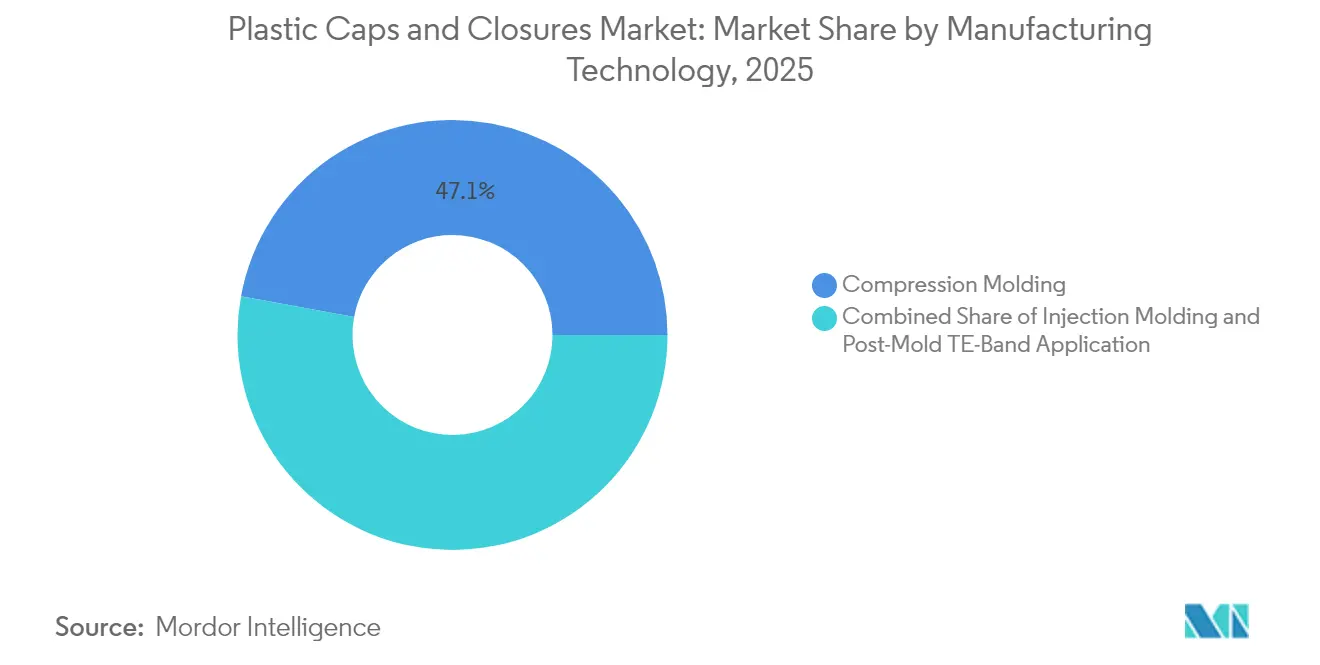
- By manufacturing technology, compression molding led with 47.12% plastic caps and closures market share in 2025.
- By end-use, beverages commanded 48.03% of the plastic caps and closures market size in 2025.
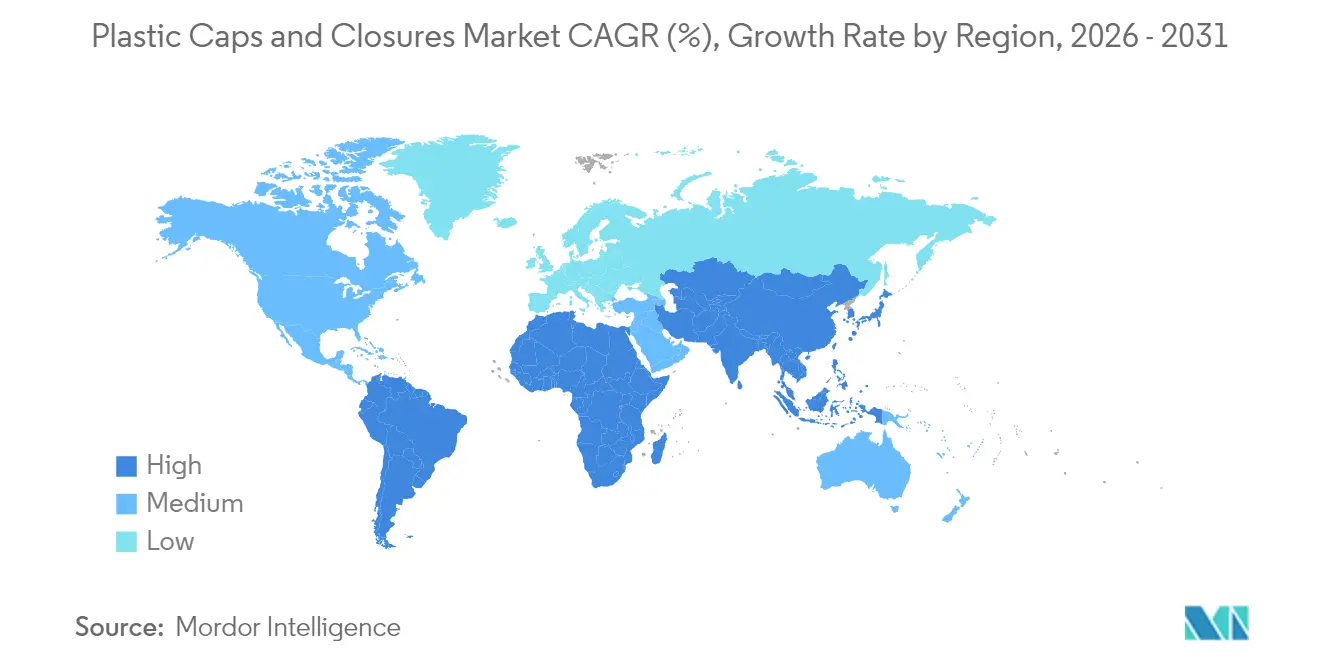
- By geography, the Middle East and Africa post the fastest 7.78% CAGR between 2026-2031 for the plastic caps and closures market size.
Note: Market size and forecast figures in this report are generated using Mordor Intelligence’s proprietary estimation framework, updated with the latest available data and insights as of 2026.
Global Plastic Caps and Closures Market Trends and Insights
Drivers Impact Analysis*
| Driver | (~) % Impact on CAGR Forecast | Geographic Relevance | Impact Timeline |
|---|---|---|---|
| EU Single-Use Plastics Directive Mandating Tethered Caps Adoption | +1.2% | Europe, with spillover to North America | Medium term (2-4 years) |
| Surge in Aseptic PET Bottling Lines Across ASEAN Beverage Plants | +0.8% | ASEAN core, spillover to broader Asia-Pacific | Long term (≥ 4 years) |
| Pharma Shift to Child-Resistant PP Closures in U.S. and Canada | +0.6% | North America | Short term (≤ 2 years) |
| Latin American Dairy Pivot Toward Gable-Top Cartons with Screw Caps | +0.4% | Latin America | Medium term (2-4 years) |
| Craft Beer Exports Fueling Crown-Closure Demand in Europe | +0.3% | Europe | Short term (≤ 2 years) |
| Source: Mordor Intelligence | |||
EU Single-Use Plastics Directive Mandating Tethered Caps Adoption
The July 2024 EU requirement that beverage containers below 3 liters carry tethered closures rewired design norms and forced widespread capital upgrades. Leading system suppliers introduced multiple attachment concepts that keep caps connected without compromising line speeds, enhancing litter-reduction goals while safeguarding consumer ergonomics. Brand owners in North America are trialing the same solutions ahead of pending Californian rules, signalling a global pivot toward attachment technology.
Surge in Aseptic PET Bottling Lines Across ASEAN Beverage Plants
New aseptic fillers extend shelf life up to 12 months and use 60.1% less plastic, driving demand for lightweight yet sterile closures. In the Indonesia plastic caps and closures market, companies such as Aptar Group Inc. and Pact Group Holdings Limited provide lightweight and functional tethered caps and closures for dairy, food, beverage, personal care, and healthcare applications. Projects in Vietnam and Indonesia illustrate the scale, with single facilities adding more than 20,000 tons of annual closure demand tied to recycled PET initiatives that back circular-economy targets.
Pharma Shift to Child-Resistant PP Closures in U.S. and Canada
Updated poison-prevention standards require 85% child-resistance without demonstration, prompting a migration toward precision-molded polypropylene designs that balance safety with adult accessibility. Regulatory synchrony between the United States, Canada, and Australia accelerates adoption across over-the-counter drug lines, boosting premium closure volumes.[1]Source: U.S. Consumer Product Safety Commission, “16 CFR 1700.15 — Poison prevention packaging standards,” ecfr.gov
Latin American Dairy Pivot Toward Gable-Top Cartons with Screw Caps
Regional processors embrace reclosable screw caps on gable-top formats to deliver convenience and sustainability. Investments exceeding USD 166 million in packaging upgrades underscore rising demand for closures that integrate recycled content and extend product freshness, aided by draft MERCOSUR standards on food-grade recycled PET.
Restraints Impact Analysis*
| Restraint | (~) % Impact on CAGR Forecast | Geographic Relevance | Impact Timeline |
|---|---|---|---|
| Volatile Propylene and Ethylene Contract Prices Impacting PP/PE Margins | -1.1% | Global | Short term (≤ 2 years) |
| Rising Aluminum ROPP Substitution in Premium Spirits, Cannibalising Plastic | -0.7% | Europe, North America | Medium term (2-4 years) |
| Tethered-Cap Retrofitting Costs for Legacy PET Lines | -0.5% | Europe, with spillover to other regions | Short term (≤ 2 years) |
| Intensifying EPR Fees on Multilayer Plastic in OECD Markets | -0.4% | OECD countries | Long term (≥ 4 years) |
| Source: Mordor Intelligence | |||
Volatile Propylene and Ethylene Contract Prices Impacting PP/PE Margins
Feedstock swings erode margin stability for closure manufacturers that rely heavily on polypropylene and polyethylene. Firms counter the cost shock through hedging, recycled-resin blends, and ongoing automation programs that compress conversion costs.[2]Source: OECD, “Extended producer responsibility and economic instruments,” oecd.org
Rising Aluminum ROPP Substitution in Premium Spirits, Cannibalising Plastic
Premium spirits brands favor aluminum for barrier performance and perceived quality, siphoning share from plastic closures in high-margin segments. Plastic suppliers respond with improved barrier coatings and premium aesthetics to protect value pools in Europe and North America.
*Our forecasts treat driver/restraint impacts as directional, not additive. The impact forecasts reflect baseline growth, mix effects, and variable interactions.
Segment Analysis
By Product Type: Screw Closures Dominate Through Versatility
Screw closures captured 65.02% of plastic caps and closures market share in 2025 thanks to universal compatibility with high-speed beverage, food, and pharmaceutical lines. High-speed beverage lines are a major application for plastic closures, supporting the beverage caps and closures market. Their low unit cost and dependable seal underpin enduring dominance, even as dispensing variants post a 6.18% CAGR through 2031. Dispensing formats gain favor in condiments and personal-care SKUs where portion control and hygiene boost consumer appeal. Tamper-evident and child-resistant formats benefit from stricter safety regulations that reshape over-the-counter drug packaging.
Crown and ROPP closures retain relevance in beer and premium spirits where tradition and shelf presence matter. Snap-on designs serve household chemicals seeking quick reclose functionality. Rising tethered-cap requirements are catalyzing redesign projects across all screw variants, linking closure innovation directly to compliance. End-users adopting light-weight bottles favor advanced thread profiles that cut resin use without compromising seal integrity, supporting the long-term outlook for screw formats in the plastic caps and closures market.


By Raw Material: Polypropylene Leadership Amid Bio-Based Innovation
Polypropylene held 55.71% share of the plastic caps and closures market size in 2025. Its chemical resistance, heat stability, and processability secure its place in food and pharmaceutical applications. High-density polyethylene supports industrial chemical packs that need impact tolerance, while low-density polyethylene is used in flexible snap closures. PET variants grow as single-material packages simplify recycling systems and enable tethered designs compliant with EU rules.
Bio-based and chemically recycled resins expand at 7.62% CAGR. Brands invest to meet EPR fee modulation and consumer sustainability expectations. Early commercial lines running plant-based polypropylene highlight the pathway to lower-carbon closures. Supply chain qualification, color stability, and cost parity remain hurdles, yet scaling chemistry improvements portend faster adoption beyond 2030 in the plastic caps and closures industry.
By Manufacturing Technology: Compression Molding Efficiency Drives Market Share
Compression molding generated 47.12% plastic caps and closures market share in 2025 because it delivers tight dimensional tolerances and low scrap rates. Multi-cavity presses now integrate in-mold slitting and camera vision, raising uptime and reducing labor. Injection molding keeps importance for intricate child-resistant and dispensing formats that require multi-component builds.
Post-mold tamper-evident band application advances at 5.71% CAGR. The retrofit-friendly method lets producers comply with new safety norms without full tool replacements. Continuous improvements in servo-controlled band applicators deliver cycle-time parity with legacy systems, pushing adoption across medium-volume pharmaceutical and food lines. The result is broader technology diversity serving distinct performance and cost envelopes in the plastic caps and closures market.
By End-Use Industry: Beverage Applications Lead Amid Pharmaceutical Growth
Beverages drove 48.03% of global volumes in 2025 and rely on lightweight screw, crown, and tethered formats to secure carbonated drinks, water, juice, and beer. High-speed fillers demand closures with precise torque retention and oxygen barrier properties, supporting the beverage segment’s scale economics.
Pharmaceutical closures register a 7.06% CAGR to 2031, propelled by aging demographics and stringent child-resistant laws. Updated U.S. and Canadian regulations heighten demand for torque-controlled polypropylene components with liner compatibility and traceable resin sourcing. Food, personal-care, and household chemical segments round out demand with tailored needs for dosing, fragrance retention, and chemical resistance. Collectively, varied application profiles sustain robust innovation pipelines and stable growth in the plastic caps and closures market.
Geography Analysis
Asia-Pacific accounted for 40.12% of global volumes in 2025, anchored by China’s scale, Japan’s quality standards, and India’s expanding beverage and pharma sectors. ASEAN’s aseptic investment wave further intensifies regional closure consumption, while circular-economy policies fast-track recycled PET uptake. Australia’s alignment with international pharma safety rules harmonizes regional trade and drives demand for specialized child-resistant formats.
Middle East and Africa post the fastest 7.78% CAGR to 2031. Diversification initiatives in Saudi Arabia and the United Arab Emirates invite foreign investment in packaging, while Turkey leverages its strategic export location. Nigeria’s population growth and South Africa’s manufacturing base increase closure demand for beverages and household products. Regional reforms encouraging local value addition support future capacity builds in the plastic caps and closures market.
Europe balances regulatory headwinds and sustainability opportunities. Tethered-cap rules enforce expensive line retrofits yet unlock design differentiation. Germany leads technical compliance projects, France drives premium design, and the United Kingdom’s EPR fee schedules reshape cost models. Spain and Italy utilize established food and beverage exports to sustain closure demand. Collective emphasis on circular-economy targets accelerates the shift toward mono-material and recycled-content caps, preserving market relevance despite slower macro growth.

Regulatory Landscape
Regulation-driven redesign and material choices are a key determinant of plastic cap and closure demand, with Europe leading the pace. The EU Single-Use Plastics Directive requirement for tethered caps on single-use plastic beverage containers up to 3 liters (effective July 2024) has sped up line retrofits and attachment-technology adoption across beverage closures, while design-for-recycling has become a parallel constraint as recyclability guidance and harmonised expectations tighten.
Beyond tethering, recycled-content and food-contact compliance frameworks are shaping resin selection and documentation. Regulation (EU) 2025/40 on packaging and packaging waste entered into force on 11 February 2025 and applies from 12 August 2026, reinforcing minimum recycled content targets and design-for-recycling criteria that influence mono-material cap strategies and PCR qualification. In the United States, food-contact and closure component compliance continues to anchor on FDA pathways such as 21 CFR requirements for applicable polymers and sealing materials, supported by ongoing FDA updates to its recycled plastics and food-contact submissions datasets (updated in July 2026), which affects how closure makers and brand owners substantiate PCR use in regulated end uses.
Value Chain Analysis
The value chain covers upstream petrochemical and recycled-resin supply (polypropylene, polyethylene, PET), additives and colorants, tooling and hot-runner suppliers, closure production using compression and injection molding, and downstream brand owners, fillers/contract packers, and retailers. Major resin and feedstock suppliers include companies such as Dow, ExxonMobil, LyondellBasell, Borealis, and SABIC, while conversion is carried out by global and regional closure specialists such as Berry Global, AptarGroup, Silgan Holdings, BERICAP, United Caps, and Guala Closures. Tooling and mold supply remains concentrated across established industrial clusters in Germany, Italy, Switzerland, and China, and lead times for injection molding tooling can become a practical constraint when large-scale tethered-cap redesign cycles coincide with beverage seasonal demand.
Downstream, brand-owner procurement and filling-line performance requirements drive spec lock-in around torque, seal integrity, and application speed, which keeps qualification cycles and regulatory documentation central to supplier selection. EPR fee structures and tethered-cap mandates are pushing more frequent design iterations and multi-site manufacturing strategies to keep supply close to filling operations and reduce logistics friction. Material and compliance complexity has increased the role of testing, declarations of compliance, and traceability systems, particularly for food, beverage, and pharmaceutical closures where PCR integration and food-contact requirements must be shown consistently across geographies.
Competitive Landscape
Amcor’s 2025 stock merger with Berry Global created the world’s largest rigid and flexible packaging supplier, unlocking USD 650 million in synergy savings and USD 180 million in annual R&D spending.Silgan Holdings, Crown Holdings, and AptarGroup follow with targeted acquisitions and capacity upgrades to deepen technology breadth and regional presence. Silgan’s purchase of Weener adds dispensing and specialty closure lines with EUR 20 million in anticipated synergies.
Players differentiate through tethered-cap intellectual property, compression-molding enhancements, and bio-based resin partnerships. Automation, inline vision inspection, and energy-efficient tooling dominate capital budgets, supporting margin preservation amid feedstock volatility. Strategic pursuit of EPR-driven material innovation and local-for-local production in emerging markets signals a competitive pivot toward resilience and sustainability in the plastic caps and closures market.
Plastic Caps and Closures Industry Leaders
Silgan Holdings Inc.
Aptar Group Inc.
BERICAP GmbH & Co. KG
Closure Systems International
Amcor PLC
- *Disclaimer: Major Players sorted in no particular order

Market Opportunities and Future Outlook
Compliance-led redesign is creating whitespace for high-speed tethered screw closures that preserve consumer usability while meeting EU requirements and tightening retailer and brand sustainability scorecards. The shift from the July 2024 tethered-cap requirement to the broader Packaging and Packaging Waste Regulation timeline, with Regulation (EU) 2025/40 applying from 12 August 2026, supports opportunities in mono-material designs, recycled-content compatible closure architectures, and qualification services that help brand owners align caps, bottles, and labels with design-for-recycling criteria.
Manufacturing footprint changes and specialty-portfolio expansion are also opening room for suppliers that can support regional supply, higher-value formats, and readiness for regulated end uses. Closure Systems International's May 2026 acquisition of two North American manufacturing facilities from Amcor (Erie, Pennsylvania and Hattiesburg, Mississippi) points to active capacity and network optimization around high-volume beverage and consumer applications, reinforcing the advantage of proximity to fillers for bulky, high-throughput closures. In pharma and dosing-led formats, the AptarGroup December 2025 Sommaplast deal also indicates continued demand for specialized closures and dispensers tied to compliance-heavy applications, while FDA dataset updates in July 2026 keep food-contact PCR substantiation and documentation as a differentiator for suppliers pursuing recycled content at scale.
Recent Industry Developments
- July 2026: AptarGroup expanded Aptar Closures portfolio of e-commerce-ready closures for beauty, personal care, and home care applications. The move targets higher performance in distribution and handling, aligning closure design with durability requirements seen in direct-to-consumer shipping. It also broadens differentiation beyond basic screw closures into functional formats that help protect brand owners against leakage and transit damage.
- December 2025: AptarGroup acquired Sommaplast, a Brazil-based provider of oral dosing pharma packaging solutions including closures and dispensing components. The acquisition strengthens Aptars position in regulated dosing and medication-adherence use cases where precision, compatibility, and documentation are critical. It also deepens Aptars manufacturing footprint and customer access in Latin America for higher-margin healthcare packaging.
- November 2024: BERICAP acquired the remaining 50% stake in BERICAP North America, taking full ownership of the business. Full control supports faster decision-making on capacity, product localization, and customer programs for beverage and industrial closures in the region. The step also reflects continued emphasis on regional manufacturing presence to improve service levels and reduce supply chain friction.


Research Methodology Framework and Report Scope
Market Definition and Coverage
For this study, the market covers plastic caps and closures used to seal and dispense products across consumer and industrial packaging, counted at the point where caps and closures are sold into packaging supply chains. Value is measured in USD for the defined period and geography.
Scope exclusions: Metal closures, glass stoppers, paper based closures, and the value of bottles, jars, pumps, and other primary containers are not counted.
Segmentation Overview
- By Product Type
- Screw Closures
- Dispensing Closures
- Child-Resistant Closures
- Tamper-Evident Closures
- Crown Closures
- ROPP (Roll-On Pilfer-Proof)
- Snap / Press-on Closures
- By Raw Material
- Polypropylene (PP)
- High-Density Polyethylene (HDPE)
- Low-Density Polyethylene (LDPE)
- Polyethylene Terephthalate (PET)
- Polyvinyl Chloride (PVC)
- Other Raw Material
- By Manufacturing Technology
- Compression Molding
- Injection Molding
- Post-Mold TE-Band Application
- By End-Use Industry
- Beverages
- Food
- Pharmaceuticals
- Personal Care and Cosmetics
- Household and Industrial Chemicals
- Other End-Use Industry
- By Geography
- North America
- United States
- Canada
- Mexico
- Europe
- United Kingdom
- Germany
- France
- Italy
- Spain
- Rest of Europe
- Asia-Pacific
- China
- Japan
- India
- South Korea
- Australia
- Rest of Asia-Pacific
- Middle East and Africa
- Middle East
- United Arab Emirates
- Saudi Arabia
- Turkey
- Rest of Middle East
- Africa
- South Africa
- Nigeria
- Rest of Africa
- Middle East
- South America
- Brazil
- Argentina
- Rest of South America
- North America
Data Sources, Market Sizing, and Validation
Desk Research
Desk research was used to set the market context and build clean starting points for demand and supply signals before we spoke with industry participants. We typically referenced public sources such as UN Comtrade trade statistics, the US International Trade Commission data tools, Eurostat packaging related series, and national statistics offices for beverage and food production indicators that drive closure demand.
To ground the model in operating conditions, we also reviewed company annual reports, investor presentations, and product catalogs, along with association and regulator materials such as packaging and recycling bodies, and policy notes around tethered caps and packaging waste rules. Where needed, paid subscriptions for company financials and intelligence, patent databases, and shipment-level import and export data were used to cross-check scale, product focus, and resin exposure. These desk sources are illustrative and not exhaustive, since many other public documents were also used for data collection, validation, and clarification.
Primary Interviews and Surveys
Primary work focused on interviews and short surveys with resin and closure ecosystem participants, including packaging converters, mold and tool specialists, brand and packaging managers, and distributors. Because this is a global market, inputs were checked across major consumption regions so gaps from public data, such as application mix and pricing ranges, could be filled and assumptions triangulated.
Distribution of primary research fieldwork respondents
| Company type | Respondent position | Region |
|---|---|---|
| Top tier: 28% | CXOs: 21% | APAC: 50% |
| Mid tier: 50% | Functional/Unit leaders: 24% | EMEA: 32% |
| Smaller Players: 22% | Managers: 55% | Americas: 18% |
Market-Sizing & Forecasting
Sizing was built using a top-down and bottom-up model. First, packaging demand indicators were translated into a closure consumption pool by end-use, then the result was validated using selective supplier roll-ups and channel checks. In practice, production and trade data were used to reconstruct likely regional consumption, followed by applying closure intensity assumptions for major pack types such as bottled beverages, packaged foods, and personal care.
Key inputs that informed the model included packaged beverage volumes, food and dairy output trends, pharma and OTC packaging activity, resin price direction for PP, HDPE, and LDPE, and the shift toward tethered caps in parts of Europe. Pricing was handled through a blended ASP approach that reflects resin movements, lightweighting trends, and mix changes across standard screw caps, dispensing closures, and specialty formats.
Forecasts were developed using scenario analysis supported by expert views on demand drivers, regulation timelines, and inflation effects on packaging. Where bottom-up datapoints were missing for smaller countries, proxy indicators such as beverage production and import dependence were used, and then adjusted back to realistic ranges during final reconciliation.
Data Validation & Update Cycle
Outputs were checked against independent signals such as resin consumption direction, packaging production trends, and regional trade balances, which helps identify sudden jumps that do not match real market behavior. Outliers were reviewed in a second pass, assumptions were re-tested, and clarifying follow-ups were triggered when a key variable, such as application mix or ASP movement, looked inconsistent.
Before sign-off, the model and narrative go through multi-step analyst reviews to keep the sizing logic, units, and conversions consistent across the report. The report is refreshed annually, with interim updates when material events occur, such as major regulation changes or notable capacity additions. Right before delivery, a final update pass is completed so clients receive the most current view.
Mordor Intelligence's Global Plastic Caps and Closures Market Market Size Versus Other Published Estimates
Published numbers for plastic caps and closures often do not match because the market can be defined in different ways, then priced with different assumptions. Differences usually come from what counts as a closure, what is bundled into packaging, which base year is used, and how price and mix are treated across regions.
Dispensing pumps and trigger sprayers are kept outside Mordor Intelligence's scope, and that single exclusion can shift totals because some sources group these dispensing systems together with closures and caps in personal care and household packaging. Gaps can also come from whether tethered caps are treated as a premium mix shift in ASPs, how resin price swings are carried into the forecast, and whether currency conversion is fixed to one year or updated as exchange rates move.
Benchmark comparison
| Source | Market Size | Gaps in Research Methodology |
|---|---|---|
| Mordor Intelligence | USD 52.06 B (2024) | |
| Trade Publisher A | USD 54.70 B (2024) | Often combines broader dispensing closure systems and uses a higher blended ASP assumption across specialty closures, which can lift the base year value. |
| Industry Research Group B | USD 50.42 B (2025) | Uses a different base year and may apply a more aggressive lightweighting effect on value, which reduces the measured USD total even if unit demand rises. |
Overall, the spread is mainly explained by scope packing and pricing logic rather than a disagreement on demand direction. By keeping inclusions explicit and tying assumptions to observable packaging indicators, the estimate stays traceable and easier to replicate when clients pressure-test the numbers.


Key Questions Answered in the Report
What is the current size of the plastic caps and closures market?
The market reached 8.18 million tons in 2026 and is forecast to hit 10.27 million tons by 2031, reflecting a 4.64% CAGR.
Which product type leads global demand?
Screw closures dominate with 65.02% share in 2025 thanks to versatility and compatibility with high-speed filling lines.
Why are tethered caps becoming mandatory in Europe?
EU rules aim to reduce litter by keeping caps attached to beverage containers under 3 liters, effective July 2024.
Which region grows fastest through 2031?
Middle East and Africa records the highest CAGR at 7.78% as governments diversify economies and expand consumer-goods production.
How will the Amcor–Berry Global merger affect competition?
The deal creates the sector’s largest supplier, unlocking USD 650 million in annual cost savings and intensifying R&D investment.
What challenges do manufacturers face from raw-material pricing?
Volatility in propylene and ethylene feedstocks pressures margins, prompting greater use of recycled resins and cost-efficient molding technologies.
Page last updated on:


 Your data is secure and never sold or shared.


