| Study Period | 2017 - 2030 |
| Base Year For Estimation | 2024 |
| Forecast Data Period | 2025 - 2030 |
| Market Size (2025) | USD 4.46 Billion |
| Market Size (2030) | USD 7.29 Billion |
| CAGR (2025 - 2030) | 10.32 % |
| Market Concentration | Low |
Major Players*Disclaimer: Major Players sorted in no particular order |

Biostimulants Market Analysis
The Biostimulants Market size is estimated at 4.46 billion USD in 2025, and is expected to reach 7.29 billion USD by 2030, growing at a CAGR of 10.32% during the forecast period (2025-2030).
The biostimulants industry is experiencing a significant transformation driven by the global shift towards sustainable agriculture practices. With organic agricultural land reaching 72.3 million hectares globally in 2021, farmers are increasingly adopting natural and biological solutions to enhance crop productivity. This transition is particularly evident in the growing adoption of amino acid-based biostimulants, which have emerged as the predominant product category due to their proven efficacy in improving crop yields and stress tolerance. The industry is witnessing a fundamental shift in farming practices, with greater emphasis on reducing chemical inputs while maintaining or improving agricultural productivity.
Technological advancements and product innovations are reshaping the biostimulants market, with manufacturers focusing on developing more effective and specialized solutions. Companies are investing heavily in research and development to create novel formulations that combine multiple bioactive compounds, enhancing their efficacy across different crop types and growing conditions. The industry has seen significant progress in the development of seaweed-based extracts and protein hydrolysates, which are showing promising results in improving nutrient uptake and stress tolerance in plants. These innovations are particularly important as farmers seek solutions that can help crops adapt to increasingly challenging environmental conditions.
Government policies and initiatives are playing a crucial role in driving market development, particularly in developed regions. The United States Department of Agriculture's commitment to organic farming is evident through its Organic Transition Initiative, which allocated USD 300 million in 2022 to support farmers transitioning to organic practices. Similarly, the European Commission has set an ambitious target of converting 25% of agricultural land to organic farming, demonstrating strong institutional support for sustainable agriculture practices. These policy frameworks are creating a favorable environment for biostimulant adoption and market growth.
The industry is witnessing significant consolidation and strategic partnerships as companies seek to strengthen their market position and expand their product portfolios. Major agricultural input companies are increasingly recognizing the potential of biostimulants, leading to strategic acquisitions and collaborations with specialized biotech firms. This trend is particularly evident in the amino acids segment, which accounts for 32% of the global market share, indicating the industry's focus on proven and effective solutions. The market is also seeing increased investment in distribution networks and technical support services to ensure proper product application and maximize benefits for farmers. The biostimulants market size is expected to expand as these strategic efforts continue to unfold.
Global Biostimulants Market Trends
The increasing awareness and Government initiatives is driving the organic production in North America and Europe.
- Organic agriculture has emerged as a significant contributor to sustainable food systems, with 187 countries practicing it globally. As of 2021, there are 72.3 million hectares of organic agricultural land globally, with an average increase of 2.9% across all regions from 2018 to 2021. Among these, organic arable land accounted for 14.4 million hectares in 2021, representing 19.9% of the total organic agricultural land. The strongest markets for organic farming are in North America and Europe, accounting for 41.0% of the global organic arable land in 2022. The total organic arable land in Europe was 6.5 million hectares in 2022, equivalent to 44.1% of the overall organic arable agricultural area. The most significant crops grown organically in North America and Europe are apples, strawberries, cereals, and olives, among others.
- Developing countries in the Asia-Pacific region are also joining the organic agriculture movement and becoming self-sufficient in producing and providing fresh organic produce to meet domestic demand. The Asia-Pacific region observed an increasing trend in organic farming, with an 18.8% increase in organic arable land from 2017 to 2022. The major initiatives by governments in the region have also played a vital role in boosting organic farming. For example, Japan's Basic Plan for Agriculture and Management in 2021 aims to triple the number of organic farmers and organic lands by 2030.
- Organic agriculture is becoming increasingly popular globally, with various countries adopting it to achieve sustainable food systems. The growth in organic agriculture is driven by the increasing awareness about the benefits of organic farming, such as promoting soil health, reducing environmental impacts, and producing healthier food.

Understand The Key Trends Shaping This Market
Download PDF
Per capita spending of organic food majorly observed in United States and Germany, attributed to the consumer demand for healthier and sustainable food
- The organic food market has experienced significant growth over the past decade, with global sales reaching USD 120.6 billion in 2020, up from USD 70.8 billion in 2012. The trend toward organic food is driven by several factors, including increasing consumer demand for healthier, more sustainable food options and growing awareness about the environmental impact of conventional agriculture.
- According to a survey conducted by the Organic Trade Association, in 2021, sales of organic fruits and vegetables increased by around 4.5% that year, accounting for 15% of the overall organic sales. North America currently dominates the market in terms of average spending on organic products, with per capita spending in the United States reaching USD 186.7 in 2021, the highest among North American countries. Europe is also expected to experience significant growth in the organic market, with Germany accounting for the highest per capita spending of USD 75.6 during the same year.
- While the organic food market is still dominated by developed countries with high levels of disposable income, it is also expected to grow in developing nations. For example, in the Asia-Pacific region, the increase in the number of working-class people is likely to contribute to market expansion. As the availability of organic products increases, prices become more affordable.
- The organic food market is experiencing significant growth globally and is expected to continue during the forecast period.

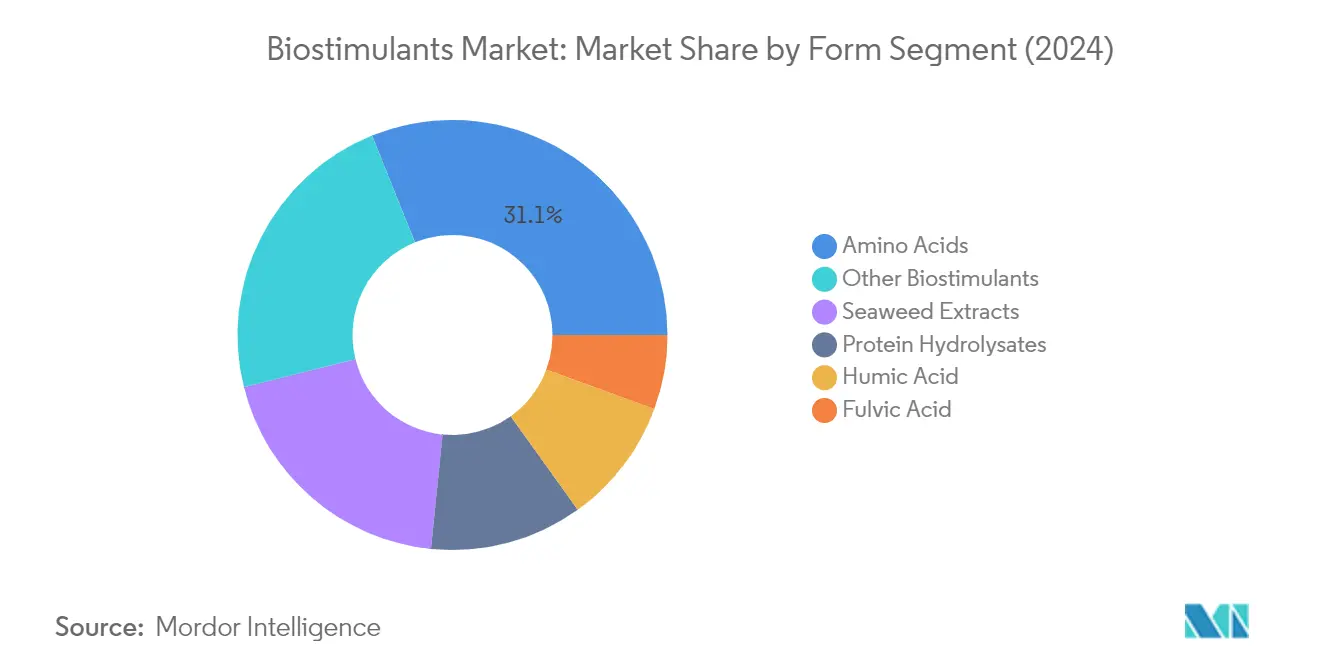
Segment Analysis: Form
Amino Acids Segment in Biostimulants Market
Amino acids have emerged as the dominant segment in the global amino acid-based biostimulants market, commanding approximately 31% of the market share in 2024. This significant market position can be attributed to their crucial role in enhancing plant growth and improving nutrient uptake, particularly in staple crops like wheat, rice, soybean, and corn/maize, which play a vital role in global food security. The efficacy of amino acids has been particularly notable in winter wheat crops, where they have demonstrated increased seed yield and grain numbers per ear. Their popularity is further enhanced by their ability to improve overall plant health and stress tolerance, with chelating amino acids proving especially effective in protecting plants from heavy metals while promoting micronutrient mobility and acquisition.
Humic Acid Segment in Biostimulants Market
The humic acid segment is experiencing remarkable growth in the plant biostimulants market, projected to expand at approximately 13% during the forecast period 2024-2029. This impressive growth trajectory is driven by humic acid's exceptional ability to improve soil fertility and enhance plant growth through various mechanisms. As a naturally occurring organic molecule found in humus, humic acid plays a crucial role in improving nutrient uptake and water retention in soil. The molecules present in humic acid bind to plant roots, helping them improve the uptake of nutrients and water, resulting in improved crop yields. The increasing awareness among farmers about the benefits of humic acid in sustainable agriculture practices and its effectiveness in both greenhouse and field conditions is further propelling its adoption across various agricultural applications.
Remaining Segments in Biostimulants Market Form Segmentation
The types of biostimulants market encompasses several other significant segments, including fulvic acid, protein hydrolysates, seaweed extracts, and other biostimulants, each serving unique functions in agricultural applications. Seaweed extracts have gained considerable traction due to their ability to enhance root growth and improve nutrition and water intake. Protein hydrolysates are valued for their role in improving crop performance by ensuring the synthesis of essential plant amino acids and nutrients. Fulvic acid, with its lower molecular weight and higher solubility compared to other humic substances, offers unique benefits in terms of nutrient absorption and plant growth stimulation. The other biostimulants category includes various plant growth regulators, chitosan, and microbial amendments that contribute to the overall market dynamics through their diverse applications in sustainable agriculture.
Segment Analysis: Crop Type
Row Crops Segment in Biostimulants Market
Row crops dominate the global biostimulants market, accounting for approximately 74% of the total market value in 2024. This segment's prominence is primarily driven by the extensive cultivation of staple crops like wheat, rice, soybean, and corn/maize, which play a crucial role in global food security. The segment is also experiencing the fastest growth trajectory, expected to grow at nearly 11% from 2024 to 2029. The increasing adoption of biostimulants in row crops is particularly notable in regions like Europe and North America, where farmers are increasingly focusing on sustainable agricultural practices. The effectiveness of biostimulants in enhancing nutrient uptake and utilization, particularly concerning nitrogen and phosphorus, has made them increasingly popular among row crop farmers. Additionally, their ability to increase the effectiveness of other agricultural inputs while reducing chemical fertilizer usage has contributed to their growing adoption in major agricultural regions worldwide.
Remaining Segments in Crop Type Segmentation
The horticultural crops and cash crops segments represent significant opportunities in the microbial biostimulants market, albeit with smaller market shares compared to row crops. The horticultural crops segment, which includes fruits, vegetables, and ornamental plants, demonstrates strong potential due to the increasing demand for high-quality produce and the growing trend toward organic farming practices. Biostimulants are particularly valuable in horticultural applications due to their ability to enhance fruit quality, size, and overall crop yield. The cash crops segment, while smaller, plays a vital role in the market, particularly in regions where crops like coffee, cotton, and sugarcane are predominant. These segments benefit from biostimulants' ability to improve stress tolerance, enhance nutrient uptake, and increase overall crop productivity, making them essential components of modern agricultural practices in both conventional and organic farming systems.
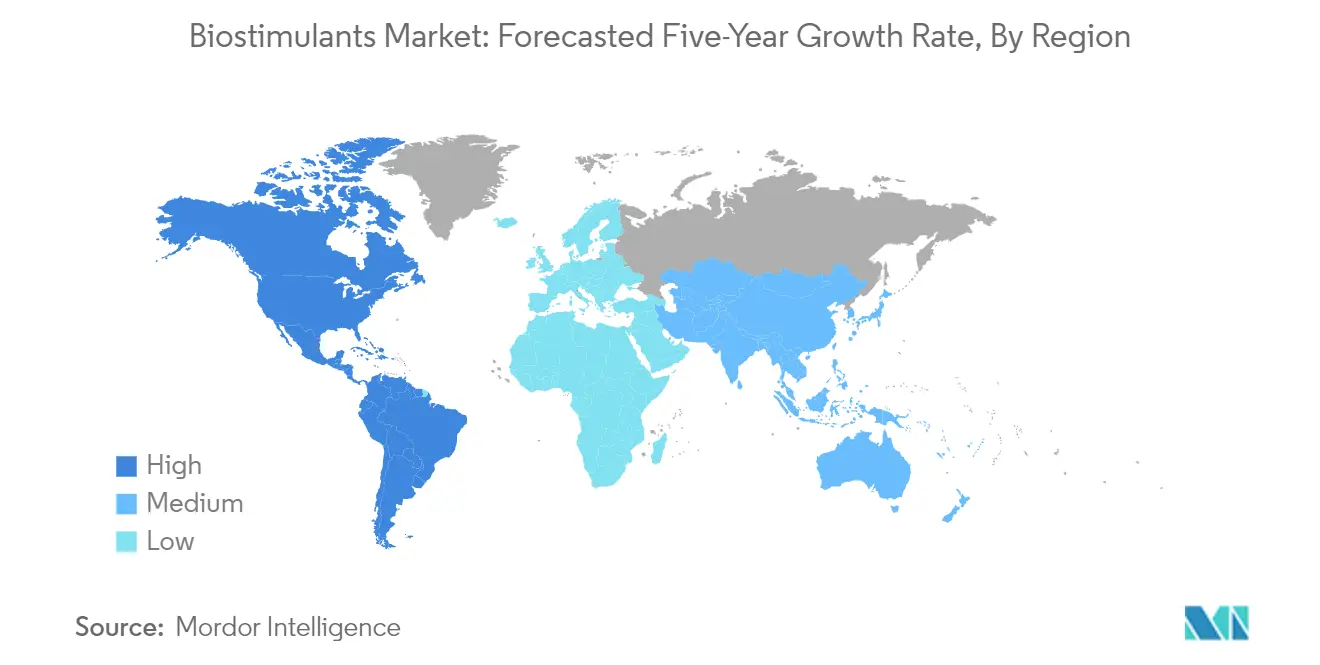
Biostimulants Market Geography Segment Analysis
Biostimulants Market in Africa
The African biostimulants market demonstrates significant potential for growth, particularly in key countries like Egypt, Nigeria, and South Africa. The region's agricultural sector is experiencing a transformation with increasing adoption of organic farming practices and sustainable agricultural solutions. While organic farming legislation is still developing in many African countries, there is growing awareness among farmers about the benefits of biostimulants in improving crop yields and quality. The market is characterized by varying levels of adoption across different countries, with some nations showing more advanced implementation of biostimulant technologies than others.
Biostimulants Market in Nigeria
Nigeria has emerged as the largest market for biostimulants in Africa, driven by its extensive agricultural sector and increasing focus on sustainable farming practices. The country accounts for approximately 40% of the African biostimulants market in 2024. Nigeria's dominance is particularly evident in the seaweed extract-based biostimulants segment, which has shown remarkable success in improving crop yields and stress tolerance. The country's agricultural landscape, characterized by diverse crop types including maize, cassava, guinea corn, yam beans, millet, and rice, provides numerous applications for biostimulant products. The government's support through various agricultural programs and initiatives has further strengthened the market position.
Biostimulants Market in Egypt
Egypt represents the fastest-growing market for biostimulants in Africa, with a projected growth rate of approximately 11% from 2024 to 2029. The country's agricultural sector is undergoing significant modernization, with increasing emphasis on sustainable farming practices. Egypt's favorable climate conditions and well-established irrigation systems provide an ideal environment for the application of biostimulants. The country has shown particular strength in the amino acid-based biostimulants segment, which has proven effective in improving nutrient uptake and utilization in various crops. The growing export market for organic produce and government support for sustainable agriculture practices continue to drive the adoption of biostimulants in Egyptian agriculture.
Biostimulants Market in Asia-Pacific
The Asia-Pacific region represents a dynamic market for biostimulants, characterized by diverse agricultural practices and varying levels of technology adoption across countries. The region encompasses major agricultural nations including China, India, Australia, Japan, Indonesia, the Philippines, Thailand, and Vietnam. Each country presents unique opportunities and challenges in the biostimulants market, influenced by factors such as government policies, agricultural practices, and environmental conditions. The region has witnessed significant growth in organic farming practices, particularly in countries like China and India, which has directly contributed to the increased adoption of biostimulants.
Biostimulants Market in China
China dominates the Asia-Pacific biostimulants market, accounting for approximately 28% of the regional market share in 2024. The country's leadership position is supported by its vast agricultural sector and growing emphasis on sustainable farming practices. China's focus on reducing chemical fertilizer usage and promoting organic farming has created a favorable environment for biostimulant adoption. The country has shown particular strength in humic acid and amino acid-based biostimulants, which have proven effective in improving soil health and crop productivity across various agricultural regions.
Biostimulants Market in India
India represents the fastest-growing market for biostimulants in the Asia-Pacific region, with a projected growth rate of approximately 11% from 2024 to 2029. The country's agricultural sector is undergoing a significant transformation with increasing adoption of organic farming practices. India's diverse agricultural landscape and government initiatives supporting sustainable agriculture have created substantial opportunities for biostimulant manufacturers. The country has shown particular success in the adoption of seaweed extract-based biostimulants, which have demonstrated significant benefits in improving crop yields and stress tolerance across various agro-climatic zones.
Biostimulants Market in Europe
Europe stands at the forefront of the global biostimulants market, with a well-established regulatory framework and strong emphasis on sustainable agriculture. The region encompasses key markets including France, Germany, Italy, the Netherlands, Russia, Spain, Turkey, and the United Kingdom. The European Union's ambitious targets for organic farming and reduction in chemical fertilizer usage have created a favorable environment for biostimulant adoption. The market is characterized by high levels of research and development activity, particularly in countries like Germany and France, leading to innovative biostimulant solutions.
Biostimulants Market in France
France leads the European biostimulants market, commanding approximately 18% of the regional market share in 2024. The country's strong position is underpinned by its advanced agricultural sector and early adoption of sustainable farming practices. French farmers have shown particular interest in amino acid-based biostimulants, which have demonstrated significant success in improving crop yields and quality. The country's well-developed organic farming sector and supportive regulatory environment have created optimal conditions for biostimulant market growth. The France biostimulants market by value by crop continues to expand, reflecting the country's commitment to sustainable agriculture.
Biostimulants Market in Italy
Italy emerges as the fastest-growing market for biostimulants in Europe, with a projected growth rate of approximately 7% from 2024 to 2029. The country's agricultural sector has shown strong commitment to organic farming practices, with a significant portion of agricultural land already under organic cultivation. Italian farmers have particularly embraced amino acid-based biostimulants, which have shown remarkable results in improving crop resilience and productivity. The country's focus on high-value crops and strong export orientation in agriculture continues to drive the adoption of biostimulant technologies. The Italy biostimulants market by value by crop is poised for further growth as these practices expand.
Biostimulants Market in Middle East
The Middle Eastern biostimulants market is characterized by unique agricultural challenges and opportunities, with Saudi Arabia and Iran emerging as key players in the region. The market is driven by the need to overcome harsh climatic conditions and water scarcity issues that affect agricultural productivity. Saudi Arabia leads the regional market, while Iran shows the fastest growth potential. The adoption of biostimulants in this region is particularly focused on improving crop resilience to abiotic stresses and enhancing water use efficiency in agriculture.
Biostimulants Market in North America
The North American biostimulants market encompasses the United States, Canada, and Mexico, characterized by advanced agricultural practices and growing emphasis on sustainable farming. The United States leads the regional market, while Mexico demonstrates the highest growth potential. The region's strong focus on research and development, coupled with increasing consumer demand for organic products, continues to drive innovation in biostimulant technologies. The market benefits from well-established regulatory frameworks and strong distribution networks across all three countries.
Biostimulants Market in South America
The South American biostimulants market, primarily driven by Brazil and Argentina, shows significant potential for growth due to the region's extensive agricultural activities and increasing focus on sustainable farming practices. Brazil maintains its position as the market leader, while Argentina demonstrates the strongest growth potential. The region's commitment to low-carbon agriculture and the need to address soil degradation issues have created favorable conditions for biostimulant adoption. Both countries have shown particular success in the application of seaweed extract-based biostimulants in major crops.
Get Analysis on Important Geographic Markets
Download PDF
Biostimulants Industry Overview
Top Companies in Biostimulants Market
The biostimulants market is characterized by companies actively pursuing product innovation and strategic expansion initiatives. Biostimulant companies are investing significantly in research and development to create novel formulations, particularly focusing on amino acid-based and seaweed extract products that enhance crop resilience and productivity. Strategic partnerships with agricultural universities and research institutions have become increasingly common to develop innovative crop solutions. Companies are also expanding their distribution networks globally while simultaneously strengthening their regional presence through local partnerships and dealer networks. The industry has witnessed a trend toward developing customized solutions for specific crop types and growing conditions, demonstrating operational agility in meeting diverse farmer needs. Digital integration through mobile applications and web platforms for product recommendations and usage guidance has emerged as another key innovation trend.
Fragmented Market with Growing Consolidation Trend
The global biostimulants market exhibits a fragmented structure with a mix of large multinational corporations and specialized regional players. Major agricultural input companies have established their presence through strategic acquisitions of specialized biostimulant manufacturers, while regional players leverage their local market knowledge and established distribution networks. The market is witnessing increased consolidation through mergers and acquisitions, as larger companies seek to expand their product portfolios and geographical reach.
The competitive landscape is characterized by a combination of diversified agricultural companies and pure-play biostimulant specialists. While global conglomerates benefit from extensive research capabilities and broad distribution networks, specialized players maintain their competitive edge through focused innovation and deep market expertise in specific regions or product categories. The industry has seen several strategic partnerships and joint ventures, particularly in emerging markets, as companies seek to combine technological expertise with local market access and distribution capabilities.
Innovation and Distribution Drive Market Success
Success in the biostimulants market increasingly depends on developing differentiated products with proven efficacy and establishing strong distribution networks. Companies need to invest in research and development to create innovative formulations that address specific crop needs and environmental challenges. Building strong relationships with farmers through technical support and demonstration of product benefits has become crucial. Regulatory compliance and obtaining necessary certifications are becoming increasingly important as markets mature and regulations evolve.
Market players must focus on developing integrated solutions that combine biostimulants with other agricultural inputs to provide comprehensive crop management solutions. Building digital capabilities for product tracking and application guidance can help companies differentiate their offerings. Companies need to establish strong partnerships with agricultural input distributors and develop effective marketing strategies to educate farmers about the benefits of biostimulants. Success also depends on maintaining price competitiveness while ensuring product quality and developing sustainable production processes to meet growing environmental concerns.
Among the top biostimulant companies in the world, those with a presence in India are particularly notable. Biostimulant companies in India are leveraging local expertise to cater to specific regional agricultural needs, contributing significantly to the global market's growth.
Biostimulants Market Leaders
-
Biolchim SpA
-
Coromandel International Ltd
-
Koppert Biological Systems Inc.
-
Trade Corporation International
-
Valagro
- *Disclaimer: Major Players sorted in no particular order

Need More Details on Market Players and Competitors?
Download PDF
Biostimulants Market News
- February 2022: Plant Response was acquired by The Mosaic Company, which is a global fertilizer manufacturer. This acquisition strengthened the company's global presence. Through the acquisition, the company develops new products and solutions for the customers in a sustainable way.
- September 2021: Tradecorp launched Biimore worldwide, a biostimulant obtained from a plant fermentation process. Biimore is made up of a unique combination of primary and secondary compounds, L-α amino acids, vitamins, sugars, and traces of other natural compounds.
- May 2021: Plant Response Inc. announced its acquisition of WISErg, which is a startup that upcycles nutrients from recovered food for use in fertilizer and nutrient-efficient products that enhance plant and soil health.
Free With This Report
Along with the report, We also offer a comprehensive and exhaustive data pack on Areas under organic cultivation, one of the key trends that affect the market size of agricultural biologicals. This data pack also includes areas under cultivation by crop types, such as Row Crops (Cereals, Pulses, and Oilseeds), Horticultural Crops (Fruits and Vegetables), and Cash Crops in North America, Europe, Asia-Pacific, South America and Africa.


Biostimulants Market Report - Table of Contents
1. EXECUTIVE SUMMARY & KEY FINDINGS
2. REPORT OFFERS
3. INTRODUCTION
- 3.1 Study Assumptions & Market Definition
- 3.2 Scope of the Study
- 3.3 Research Methodology
4. KEY INDUSTRY TRENDS
- 4.1 Area Under Organic Cultivation
- 4.2 Per Capita Spending On Organic Products
-
4.3 Regulatory Framework
- 4.3.1 Argentina
- 4.3.2 Australia
- 4.3.3 Brazil
- 4.3.4 Canada
- 4.3.5 China
- 4.3.6 Egypt
- 4.3.7 France
- 4.3.8 Germany
- 4.3.9 India
- 4.3.10 Indonesia
- 4.3.11 Italy
- 4.3.12 Japan
- 4.3.13 Mexico
- 4.3.14 Netherlands
- 4.3.15 Nigeria
- 4.3.16 Philippines
- 4.3.17 Russia
- 4.3.18 South Africa
- 4.3.19 Spain
- 4.3.20 Thailand
- 4.3.21 Turkey
- 4.3.22 United Kingdom
- 4.3.23 United States
- 4.3.24 Vietnam
- 4.4 Value Chain & Distribution Channel Analysis
5. MARKET SEGMENTATION (includes market size in Value in USD and Volume, Forecasts up to 2030 and analysis of growth prospects)
-
5.1 Form
- 5.1.1 Amino Acids
- 5.1.2 Fulvic Acid
- 5.1.3 Humic Acid
- 5.1.4 Protein Hydrolysates
- 5.1.5 Seaweed Extracts
- 5.1.6 Other Biostimulants
-
5.2 Crop Type
- 5.2.1 Cash Crops
- 5.2.2 Horticultural Crops
- 5.2.3 Row Crops
-
5.3 Region
- 5.3.1 Africa
- 5.3.1.1 By Country
- 5.3.1.1.1 Egypt
- 5.3.1.1.2 Nigeria
- 5.3.1.1.3 South Africa
- 5.3.1.1.4 Rest of Africa
- 5.3.2 Asia-Pacific
- 5.3.2.1 By Country
- 5.3.2.1.1 Australia
- 5.3.2.1.2 China
- 5.3.2.1.3 India
- 5.3.2.1.4 Indonesia
- 5.3.2.1.5 Japan
- 5.3.2.1.6 Philippines
- 5.3.2.1.7 Thailand
- 5.3.2.1.8 Vietnam
- 5.3.2.1.9 Rest of Asia-Pacific
- 5.3.3 Europe
- 5.3.3.1 By Country
- 5.3.3.1.1 France
- 5.3.3.1.2 Germany
- 5.3.3.1.3 Italy
- 5.3.3.1.4 Netherlands
- 5.3.3.1.5 Russia
- 5.3.3.1.6 Spain
- 5.3.3.1.7 Turkey
- 5.3.3.1.8 United Kingdom
- 5.3.3.1.9 Rest of Europe
- 5.3.4 Middle East
- 5.3.4.1 By Country
- 5.3.4.1.1 Iran
- 5.3.4.1.2 Saudi Arabia
- 5.3.4.1.3 Rest of Middle East
- 5.3.5 North America
- 5.3.5.1 By Country
- 5.3.5.1.1 Canada
- 5.3.5.1.2 Mexico
- 5.3.5.1.3 United States
- 5.3.5.1.4 Rest of North America
- 5.3.6 South America
- 5.3.6.1 By Country
- 5.3.6.1.1 Argentina
- 5.3.6.1.2 Brazil
- 5.3.6.1.3 Rest of South America
6. COMPETITIVE LANDSCAPE
- 6.1 Key Strategic Moves
- 6.2 Market Share Analysis
- 6.3 Company Landscape
-
6.4 Company Profiles (includes Global Level Overview, Market Level Overview, Core Business Segments, Financials, Headcount, Key Information, Market Rank, Market Share, Products and Services, and Analysis of Recent Developments).
- 6.4.1 Agriculture Solutions Inc.
- 6.4.2 Agrinos
- 6.4.3 Atlántica Agrícola
- 6.4.4 Biolchim SpA
- 6.4.5 Bionema
- 6.4.6 Coromandel International Ltd
- 6.4.7 Haifa Group
- 6.4.8 Koppert Biological Systems Inc.
- 6.4.9 Plant Response Biotech Inc.
- 6.4.10 Sigma Agriscience LLC
- 6.4.11 T Stanes and Company Limited
- 6.4.12 Trade Corporation International
- 6.4.13 UPL
- 6.4.14 Valagro
- 6.4.15 Vittia Group
7. KEY STRATEGIC QUESTIONS FOR AGRICULTURAL BIOLOGICALS CEOS
8. APPENDIX
-
8.1 Global Overview
- 8.1.1 Overview
- 8.1.2 Porter’s Five Forces Framework
- 8.1.3 Global Value Chain Analysis
- 8.1.4 Market Dynamics (DROs)
- 8.2 Sources & References
- 8.3 List of Tables & Figures
- 8.4 Primary Insights
- 8.5 Data Pack
- 8.6 Glossary of Terms
You Can Purchase Parts Of This Report. Check Out Prices For Specific Sections
Get Price Break-up Now
List of Tables & Figures
- Figure 1:
- AREA UNDER ORGANIC CULTIVATION IN HECTARES, GLOBAL, 2017 - 2022
- Figure 2:
- PER CAPITA SPENDING ON ORGANIC PRODUCTS IN USD, GLOBAL, 2017 - 2022
- Figure 3:
- GLOBAL BIOSTIMULANTS MARKET, VOLUME, METRIC TON, 2017 - 2029
- Figure 4:
- GLOBAL BIOSTIMULANTS MARKET, VALUE, USD, 2017 - 2029
- Figure 5:
- BIOSTIMULANTS CONSUMPTION IN METRIC TON, GLOBAL, 2017 - 2029
- Figure 6:
- BIOSTIMULANTS CONSUMPTION IN USD, GLOBAL, 2017 - 2029
- Figure 7:
- BIOSTIMULANTS CONSUMPTION VOLUME BY FORM IN %, GLOBAL, 2017 VS 2023 VS 2029
- Figure 8:
- BIOSTIMULANTS CONSUMPTION VALUE BY FORM IN %, GLOBAL, 2017 VS 2023 VS 2029
- Figure 9:
- AMINO ACIDS CONSUMPTION IN METRIC TON, GLOBAL, 2017 - 2029
- Figure 10:
- AMINO ACIDS CONSUMPTION IN USD, GLOBAL, 2017 - 2029
- Figure 11:
- AMINO ACIDS CONSUMPTION VALUE BY CROP TYPE IN %, GLOBAL, 2022 VS 2029
- Figure 12:
- FULVIC ACID CONSUMPTION IN METRIC TON, GLOBAL, 2017 - 2029
- Figure 13:
- FULVIC ACID CONSUMPTION IN USD, GLOBAL, 2017 - 2029
- Figure 14:
- FULVIC ACID CONSUMPTION VALUE BY CROP TYPE IN %, GLOBAL, 2022 VS 2029
- Figure 15:
- HUMIC ACID CONSUMPTION IN METRIC TON, GLOBAL, 2017 - 2029
- Figure 16:
- HUMIC ACID CONSUMPTION IN USD, GLOBAL, 2017 - 2029
- Figure 17:
- HUMIC ACID CONSUMPTION VALUE BY CROP TYPE IN %, GLOBAL, 2022 VS 2029
- Figure 18:
- PROTEIN HYDROLYSATES CONSUMPTION IN METRIC TON, GLOBAL, 2017 - 2029
- Figure 19:
- PROTEIN HYDROLYSATES CONSUMPTION IN USD, GLOBAL, 2017 - 2029
- Figure 20:
- PROTEIN HYDROLYSATES CONSUMPTION VALUE BY CROP TYPE IN %, GLOBAL, 2022 VS 2029
- Figure 21:
- SEAWEED EXTRACTS CONSUMPTION IN METRIC TON, GLOBAL, 2017 - 2029
- Figure 22:
- SEAWEED EXTRACTS CONSUMPTION IN USD, GLOBAL, 2017 - 2029
- Figure 23:
- SEAWEED EXTRACTS CONSUMPTION VALUE BY CROP TYPE IN %, GLOBAL, 2022 VS 2029
- Figure 24:
- OTHER BIOSTIMULANTS CONSUMPTION IN METRIC TON, GLOBAL, 2017 - 2029
- Figure 25:
- OTHER BIOSTIMULANTS CONSUMPTION IN USD, GLOBAL, 2017 - 2029
- Figure 26:
- OTHER BIOSTIMULANTS CONSUMPTION VALUE BY CROP TYPE IN %, GLOBAL, 2022 VS 2029
- Figure 27:
- BIOSTIMULANTS CONSUMPTION IN METRIC TON, GLOBAL, 2017 - 2029
- Figure 28:
- BIOSTIMULANTS CONSUMPTION IN USD, GLOBAL, 2017 - 2029
- Figure 29:
- BIOSTIMULANTS CONSUMPTION VOLUME BY CROP TYPE IN %, GLOBAL, 2017 VS 2023 VS 2029
- Figure 30:
- BIOSTIMULANTS CONSUMPTION VALUE BY CROP TYPE IN %, GLOBAL, 2017 VS 2023 VS 2029
- Figure 31:
- BIOSTIMULANTS CONSUMPTION BY CASH CROPS IN METRIC TON, GLOBAL, 2017 - 2029
- Figure 32:
- BIOSTIMULANTS CONSUMPTION BY CASH CROPS IN USD, GLOBAL, 2017 - 2029
- Figure 33:
- BIOSTIMULANTS CONSUMPTION VALUE BY FORM IN %, GLOBAL, 2022 VS 2029
- Figure 34:
- BIOSTIMULANTS CONSUMPTION BY HORTICULTURAL CROPS IN METRIC TON, GLOBAL, 2017 - 2029
- Figure 35:
- BIOSTIMULANTS CONSUMPTION BY HORTICULTURAL CROPS IN USD, GLOBAL, 2017 - 2029
- Figure 36:
- BIOSTIMULANTS CONSUMPTION VALUE BY FORM IN %, GLOBAL, 2022 VS 2029
- Figure 37:
- BIOSTIMULANTS CONSUMPTION BY ROW CROPS IN METRIC TON, GLOBAL, 2017 - 2029
- Figure 38:
- BIOSTIMULANTS CONSUMPTION BY ROW CROPS IN USD, GLOBAL, 2017 - 2029
- Figure 39:
- BIOSTIMULANTS CONSUMPTION VALUE BY FORM IN %, GLOBAL, 2022 VS 2029
- Figure 40:
- BIOSTIMULANTS CONSUMPTION IN METRIC TON, GLOBAL, 2017 - 2029
- Figure 41:
- BIOSTIMULANTS CONSUMPTION IN USD, GLOBAL, 2017 - 2029
- Figure 42:
- BIOSTIMULANTS CONSUMPTION VOLUME BY REGION IN %, GLOBAL, 2017 VS 2023 VS 2029
- Figure 43:
- BIOSTIMULANTS CONSUMPTION VALUE BY REGION IN %, GLOBAL, 2017 VS 2023 VS 2029
- Figure 44:
- BIOSTIMULANTS CONSUMPTION IN METRIC TON, AFRICA, 2017 - 2029
- Figure 45:
- BIOSTIMULANTS CONSUMPTION IN USD, AFRICA, 2017 - 2029
- Figure 46:
- BIOSTIMULANTS CONSUMPTION VOLUME BY COUNTRY IN %, AFRICA, 2017 VS 2023 VS 2029
- Figure 47:
- BIOSTIMULANTS CONSUMPTION VALUE BY COUNTRY IN %, AFRICA, 2017 VS 2023 VS 2029
- Figure 48:
- BIOSTIMULANTS CONSUMPTION IN METRIC TON, EGYPT, 2017 - 2029
- Figure 49:
- BIOSTIMULANTS CONSUMPTION IN USD, EGYPT, 2017 - 2029
- Figure 50:
- BIOSTIMULANTS CONSUMPTION VALUE BY FORM IN %, EGYPT, 2022 VS 2029
- Figure 51:
- BIOSTIMULANTS CONSUMPTION IN METRIC TON, NIGERIA, 2017 - 2029
- Figure 52:
- BIOSTIMULANTS CONSUMPTION IN USD, NIGERIA, 2017 - 2029
- Figure 53:
- BIOSTIMULANTS CONSUMPTION VALUE BY FORM IN %, NIGERIA, 2022 VS 2029
- Figure 54:
- BIOSTIMULANTS CONSUMPTION IN METRIC TON, SOUTH AFRICA, 2017 - 2029
- Figure 55:
- BIOSTIMULANTS CONSUMPTION IN USD, SOUTH AFRICA, 2017 - 2029
- Figure 56:
- BIOSTIMULANTS CONSUMPTION VALUE BY FORM IN %, SOUTH AFRICA, 2022 VS 2029
- Figure 57:
- BIOSTIMULANTS CONSUMPTION IN METRIC TON, REST OF AFRICA, 2017 - 2029
- Figure 58:
- BIOSTIMULANTS CONSUMPTION IN USD, REST OF AFRICA, 2017 - 2029
- Figure 59:
- BIOSTIMULANTS CONSUMPTION VALUE BY FORM IN %, REST OF AFRICA, 2022 VS 2029
- Figure 60:
- BIOSTIMULANTS CONSUMPTION IN METRIC TON, ASIA-PACIFIC, 2017 - 2029
- Figure 61:
- BIOSTIMULANTS CONSUMPTION IN USD, ASIA-PACIFIC, 2017 - 2029
- Figure 62:
- BIOSTIMULANTS CONSUMPTION VOLUME BY COUNTRY IN %, ASIA-PACIFIC, 2017 VS 2023 VS 2029
- Figure 63:
- BIOSTIMULANTS CONSUMPTION VALUE BY COUNTRY IN %, ASIA-PACIFIC, 2017 VS 2023 VS 2029
- Figure 64:
- BIOSTIMULANTS CONSUMPTION IN METRIC TON, AUSTRALIA, 2017 - 2029
- Figure 65:
- BIOSTIMULANTS CONSUMPTION IN USD, AUSTRALIA, 2017 - 2029
- Figure 66:
- BIOSTIMULANTS CONSUMPTION VALUE BY FORM IN %, AUSTRALIA, 2022 VS 2029
- Figure 67:
- BIOSTIMULANTS CONSUMPTION IN METRIC TON, CHINA, 2017 - 2029
- Figure 68:
- BIOSTIMULANTS CONSUMPTION IN USD, CHINA, 2017 - 2029
- Figure 69:
- BIOSTIMULANTS CONSUMPTION VALUE BY FORM IN %, CHINA, 2022 VS 2029
- Figure 70:
- BIOSTIMULANTS CONSUMPTION IN METRIC TON, INDIA, 2017 - 2029
- Figure 71:
- BIOSTIMULANTS CONSUMPTION IN USD, INDIA, 2017 - 2029
- Figure 72:
- BIOSTIMULANTS CONSUMPTION VALUE BY FORM IN %, INDIA, 2022 VS 2029
- Figure 73:
- BIOSTIMULANTS CONSUMPTION IN METRIC TON, INDONESIA, 2017 - 2029
- Figure 74:
- BIOSTIMULANTS CONSUMPTION IN USD, INDONESIA, 2017 - 2029
- Figure 75:
- BIOSTIMULANTS CONSUMPTION VALUE BY FORM IN %, INDONESIA, 2022 VS 2029
- Figure 76:
- BIOSTIMULANTS CONSUMPTION IN METRIC TON, JAPAN, 2017 - 2029
- Figure 77:
- BIOSTIMULANTS CONSUMPTION IN USD, JAPAN, 2017 - 2029
- Figure 78:
- BIOSTIMULANTS CONSUMPTION VALUE BY FORM IN %, JAPAN, 2022 VS 2029
- Figure 79:
- BIOSTIMULANTS CONSUMPTION IN METRIC TON, PHILIPPINES, 2017 - 2029
- Figure 80:
- BIOSTIMULANTS CONSUMPTION IN USD, PHILIPPINES, 2017 - 2029
- Figure 81:
- BIOSTIMULANTS CONSUMPTION VALUE BY FORM IN %, PHILIPPINES, 2022 VS 2029
- Figure 82:
- BIOSTIMULANTS CONSUMPTION IN METRIC TON, THAILAND, 2017 - 2029
- Figure 83:
- BIOSTIMULANTS CONSUMPTION IN USD, THAILAND, 2017 - 2029
- Figure 84:
- BIOSTIMULANTS CONSUMPTION VALUE BY FORM IN %, THAILAND, 2022 VS 2029
- Figure 85:
- BIOSTIMULANTS CONSUMPTION IN METRIC TON, VIETNAM, 2017 - 2029
- Figure 86:
- BIOSTIMULANTS CONSUMPTION IN USD, VIETNAM, 2017 - 2029
- Figure 87:
- BIOSTIMULANTS CONSUMPTION VALUE BY FORM IN %, VIETNAM, 2022 VS 2029
- Figure 88:
- BIOSTIMULANTS CONSUMPTION IN METRIC TON, REST OF ASIA-PACIFIC, 2017 - 2029
- Figure 89:
- BIOSTIMULANTS CONSUMPTION IN USD, REST OF ASIA-PACIFIC, 2017 - 2029
- Figure 90:
- BIOSTIMULANTS CONSUMPTION VALUE BY FORM IN %, REST OF ASIA-PACIFIC, 2022 VS 2029
- Figure 91:
- BIOSTIMULANTS CONSUMPTION IN METRIC TON, EUROPE, 2017 - 2029
- Figure 92:
- BIOSTIMULANTS CONSUMPTION IN USD, EUROPE, 2017 - 2029
- Figure 93:
- BIOSTIMULANTS CONSUMPTION VOLUME BY COUNTRY IN %, EUROPE, 2017 VS 2023 VS 2029
- Figure 94:
- BIOSTIMULANTS CONSUMPTION VALUE BY COUNTRY IN %, EUROPE, 2017 VS 2023 VS 2029
- Figure 95:
- BIOSTIMULANTS CONSUMPTION IN METRIC TON, FRANCE, 2017 - 2029
- Figure 96:
- BIOSTIMULANTS CONSUMPTION IN USD, FRANCE, 2017 - 2029
- Figure 97:
- BIOSTIMULANTS CONSUMPTION VALUE BY FORM IN %, FRANCE, 2022 VS 2029
- Figure 98:
- BIOSTIMULANTS CONSUMPTION IN METRIC TON, GERMANY, 2017 - 2029
- Figure 99:
- BIOSTIMULANTS CONSUMPTION IN USD, GERMANY, 2017 - 2029
- Figure 100:
- BIOSTIMULANTS CONSUMPTION VALUE BY FORM IN %, GERMANY, 2022 VS 2029
- Figure 101:
- BIOSTIMULANTS CONSUMPTION IN METRIC TON, ITALY, 2017 - 2029
- Figure 102:
- BIOSTIMULANTS CONSUMPTION IN USD, ITALY, 2017 - 2029
- Figure 103:
- BIOSTIMULANTS CONSUMPTION VALUE BY FORM IN %, ITALY, 2022 VS 2029
- Figure 104:
- BIOSTIMULANTS CONSUMPTION IN METRIC TON, NETHERLANDS, 2017 - 2029
- Figure 105:
- BIOSTIMULANTS CONSUMPTION IN USD, NETHERLANDS, 2017 - 2029
- Figure 106:
- BIOSTIMULANTS CONSUMPTION VALUE BY FORM IN %, NETHERLANDS, 2022 VS 2029
- Figure 107:
- BIOSTIMULANTS CONSUMPTION IN METRIC TON, RUSSIA, 2017 - 2029
- Figure 108:
- BIOSTIMULANTS CONSUMPTION IN USD, RUSSIA, 2017 - 2029
- Figure 109:
- BIOSTIMULANTS CONSUMPTION VALUE BY FORM IN %, RUSSIA, 2022 VS 2029
- Figure 110:
- BIOSTIMULANTS CONSUMPTION IN METRIC TON, SPAIN, 2017 - 2029
- Figure 111:
- BIOSTIMULANTS CONSUMPTION IN USD, SPAIN, 2017 - 2029
- Figure 112:
- BIOSTIMULANTS CONSUMPTION VALUE BY FORM IN %, SPAIN, 2022 VS 2029
- Figure 113:
- BIOSTIMULANTS CONSUMPTION IN METRIC TON, TURKEY, 2017 - 2029
- Figure 114:
- BIOSTIMULANTS CONSUMPTION IN USD, TURKEY, 2017 - 2029
- Figure 115:
- BIOSTIMULANTS CONSUMPTION VALUE BY FORM IN %, TURKEY, 2022 VS 2029
- Figure 116:
- BIOSTIMULANTS CONSUMPTION IN METRIC TON, UNITED KINGDOM, 2017 - 2029
- Figure 117:
- BIOSTIMULANTS CONSUMPTION IN USD, UNITED KINGDOM, 2017 - 2029
- Figure 118:
- BIOSTIMULANTS CONSUMPTION VALUE BY FORM IN %, UNITED KINGDOM, 2022 VS 2029
- Figure 119:
- BIOSTIMULANTS CONSUMPTION IN METRIC TON, REST OF EUROPE, 2017 - 2029
- Figure 120:
- BIOSTIMULANTS CONSUMPTION IN USD, REST OF EUROPE, 2017 - 2029
- Figure 121:
- BIOSTIMULANTS CONSUMPTION VALUE BY FORM IN %, REST OF EUROPE, 2022 VS 2029
- Figure 122:
- BIOSTIMULANTS CONSUMPTION IN METRIC TON, MIDDLE EAST, 2017 - 2029
- Figure 123:
- BIOSTIMULANTS CONSUMPTION IN USD, MIDDLE EAST, 2017 - 2029
- Figure 124:
- BIOSTIMULANTS CONSUMPTION VOLUME BY COUNTRY IN %, MIDDLE EAST, 2017 VS 2023 VS 2029
- Figure 125:
- BIOSTIMULANTS CONSUMPTION VALUE BY COUNTRY IN %, MIDDLE EAST, 2017 VS 2023 VS 2029
- Figure 126:
- BIOSTIMULANTS CONSUMPTION IN METRIC TON, IRAN, 2017 - 2029
- Figure 127:
- BIOSTIMULANTS CONSUMPTION IN USD, IRAN, 2017 - 2029
- Figure 128:
- BIOSTIMULANTS CONSUMPTION VALUE BY FORM IN %, IRAN, 2022 VS 2029
- Figure 129:
- BIOSTIMULANTS CONSUMPTION IN METRIC TON, SAUDI ARABIA, 2017 - 2029
- Figure 130:
- BIOSTIMULANTS CONSUMPTION IN USD, SAUDI ARABIA, 2017 - 2029
- Figure 131:
- BIOSTIMULANTS CONSUMPTION VALUE BY FORM IN %, SAUDI ARABIA, 2022 VS 2029
- Figure 132:
- BIOSTIMULANTS CONSUMPTION IN METRIC TON, REST OF MIDDLE EAST, 2017 - 2029
- Figure 133:
- BIOSTIMULANTS CONSUMPTION IN USD, REST OF MIDDLE EAST, 2017 - 2029
- Figure 134:
- BIOSTIMULANTS CONSUMPTION VALUE BY FORM IN %, REST OF MIDDLE EAST, 2022 VS 2029
- Figure 135:
- BIOSTIMULANTS CONSUMPTION IN METRIC TON, NORTH AMERICA, 2017 - 2029
- Figure 136:
- BIOSTIMULANTS CONSUMPTION IN USD, NORTH AMERICA, 2017 - 2029
- Figure 137:
- BIOSTIMULANTS CONSUMPTION VOLUME BY COUNTRY IN %, NORTH AMERICA, 2017 VS 2023 VS 2029
- Figure 138:
- BIOSTIMULANTS CONSUMPTION VALUE BY COUNTRY IN %, NORTH AMERICA, 2017 VS 2023 VS 2029
- Figure 139:
- BIOSTIMULANTS CONSUMPTION IN METRIC TON, CANADA, 2017 - 2029
- Figure 140:
- BIOSTIMULANTS CONSUMPTION IN USD, CANADA, 2017 - 2029
- Figure 141:
- BIOSTIMULANTS CONSUMPTION VALUE BY FORM IN %, CANADA, 2022 VS 2029
- Figure 142:
- BIOSTIMULANTS CONSUMPTION IN METRIC TON, MEXICO, 2017 - 2029
- Figure 143:
- BIOSTIMULANTS CONSUMPTION IN USD, MEXICO, 2017 - 2029
- Figure 144:
- BIOSTIMULANTS CONSUMPTION VALUE BY FORM IN %, MEXICO, 2022 VS 2029
- Figure 145:
- BIOSTIMULANTS CONSUMPTION IN METRIC TON, UNITED STATES, 2017 - 2029
- Figure 146:
- BIOSTIMULANTS CONSUMPTION IN USD, UNITED STATES, 2017 - 2029
- Figure 147:
- BIOSTIMULANTS CONSUMPTION VALUE BY FORM IN %, UNITED STATES, 2022 VS 2029
- Figure 148:
- BIOSTIMULANTS CONSUMPTION IN METRIC TON, REST OF NORTH AMERICA, 2017 - 2029
- Figure 149:
- BIOSTIMULANTS CONSUMPTION IN USD, REST OF NORTH AMERICA, 2017 - 2029
- Figure 150:
- BIOSTIMULANTS CONSUMPTION VALUE BY FORM IN %, REST OF NORTH AMERICA, 2022 VS 2029
- Figure 151:
- BIOSTIMULANTS CONSUMPTION IN METRIC TON, SOUTH AMERICA, 2017 - 2029
- Figure 152:
- BIOSTIMULANTS CONSUMPTION IN USD, SOUTH AMERICA, 2017 - 2029
- Figure 153:
- BIOSTIMULANTS CONSUMPTION VOLUME BY COUNTRY IN %, SOUTH AMERICA, 2017 VS 2023 VS 2029
- Figure 154:
- BIOSTIMULANTS CONSUMPTION VALUE BY COUNTRY IN %, SOUTH AMERICA, 2017 VS 2023 VS 2029
- Figure 155:
- BIOSTIMULANTS CONSUMPTION IN METRIC TON, ARGENTINA, 2017 - 2029
- Figure 156:
- BIOSTIMULANTS CONSUMPTION IN USD, ARGENTINA, 2017 - 2029
- Figure 157:
- BIOSTIMULANTS CONSUMPTION VALUE BY FORM IN %, ARGENTINA, 2022 VS 2029
- Figure 158:
- BIOSTIMULANTS CONSUMPTION IN METRIC TON, BRAZIL, 2017 - 2029
- Figure 159:
- BIOSTIMULANTS CONSUMPTION IN USD, BRAZIL, 2017 - 2029
- Figure 160:
- BIOSTIMULANTS CONSUMPTION VALUE BY FORM IN %, BRAZIL, 2022 VS 2029
- Figure 161:
- BIOSTIMULANTS CONSUMPTION IN METRIC TON, REST OF SOUTH AMERICA, 2017 - 2029
- Figure 162:
- BIOSTIMULANTS CONSUMPTION IN USD, REST OF SOUTH AMERICA, 2017 - 2029
- Figure 163:
- BIOSTIMULANTS CONSUMPTION VALUE BY FORM IN %, REST OF SOUTH AMERICA, 2022 VS 2029
- Figure 164:
- GLOBAL BIOSTIMULANTS MARKET, MOST ACTIVE COMPANIES, BY NUMBER OF STRATEGIC MOVES, 2017-2022
- Figure 165:
- GLOBAL BIOSTIMULANTS MARKET, MOST ADOPTED STRATEGIES, 2017-2022
- Figure 166:
- GLOBAL BIOSTIMULANTS MARKET SHARE(%), BY MAJOR PLAYERS
Biostimulants Industry Segmentation
Amino Acids, Fulvic Acid, Humic Acid, Protein Hydrolysates, Seaweed Extracts are covered as segments by Form. Cash Crops, Horticultural Crops, Row Crops are covered as segments by Crop Type. Africa, Asia-Pacific, Europe, Middle East, North America, South America are covered as segments by Region.| Form | Amino Acids | |||
| Fulvic Acid | ||||
| Humic Acid | ||||
| Protein Hydrolysates | ||||
| Seaweed Extracts | ||||
| Other Biostimulants | ||||
| Crop Type | Cash Crops | |||
| Horticultural Crops | ||||
| Row Crops | ||||
| Region | Africa | By Country | Egypt | |
| Nigeria | ||||
| South Africa | ||||
| Rest of Africa | ||||
| Asia-Pacific | By Country | Australia | ||
| China | ||||
| India | ||||
| Indonesia | ||||
| Japan | ||||
| Philippines | ||||
| Thailand | ||||
| Vietnam | ||||
| Rest of Asia-Pacific | ||||
| Europe | By Country | France | ||
| Germany | ||||
| Italy | ||||
| Netherlands | ||||
| Russia | ||||
| Spain | ||||
| Turkey | ||||
| United Kingdom | ||||
| Rest of Europe | ||||
| Middle East | By Country | Iran | ||
| Saudi Arabia | ||||
| Rest of Middle East | ||||
| North America | By Country | Canada | ||
| Mexico | ||||
| United States | ||||
| Rest of North America | ||||
| South America | By Country | Argentina | ||
| Brazil | ||||
| Rest of South America | ||||
Need A Different Region or Segment?
Customize Now
Market Definition
- AVERAGE DOSAGE RATE - The average application rate is the average volume of biostimulants applied per hectare of farmland in the respective region/country.
- CROP TYPE - Crop type includes Row crops (Cereals, Pulses, Oilseeds), Horticultural Crops (Fruits and vegetables) and Cash Crops (Plantation Crops, Fibre Crops and Other Industrial Crops)
- FUNCTION - The Crop Protection function of agirucultural biological include products that prevent or control various biotic and abiotic stress.
- TYPE - Biostimulants boost crop growth and yield by preventing or controlling various abiotic stresses.
| Keyword | Definition |
|---|---|
| Cash Crops | Cash crops are non-consumable crops sold as a whole or part of the crop to manufacture end-products to make a profit. |
| Integrated Pest Management (IPM) | IPM is an environment-friendly and sustainable approach to control pests in various crops. It involves a combination of methods, including biological controls, cultural practices, and selective use of pesticides. |
| Bacterial biocontrol agents | Bacteria used to control pests and diseases in crops. They work by producing toxins harmful to the target pests or competing with them for nutrients and space in the growing environment. Some examples of commonly used bacterial biocontrol agents include Bacillus thuringiensis (Bt), Pseudomonas fluorescens, and Streptomyces spp. |
| Plant Protection Product (PPP) | A plant protection product is a formulation applied to crops to protect from pests, such as weeds, diseases, or insects. They contain one or more active substances with other co-formulants such as solvents, carriers, inert material, wetting agents or adjuvants formulated to give optimum product efficacy. |
| Pathogen | A pathogen is an organism causing disease to its host, with the severity of the disease symptoms. |
| Parasitoids | Parasitoids are insects that lay their eggs on or within the host insect, with their larvae feeding on the host insect. In agriculture, parasitoids can be used as a form of biological pest control, as they help to control pest damage to crops and decrease the need for chemical pesticides. |
| Entomopathogenic Nematodes (EPN) | Entomopathogenic nematodes are parasitic roundworms that infect and kill pests by releasing bacteria from their gut. Entomopathogenic nematodes are a form of biocontrol agents used in agriculture. |
| Vesicular-arbuscular mycorrhiza (VAM) | VAM fungi are mycorrhizal species of fungus. They live in the roots of different higher-order plants. They develop a symbiotic relationship with the plants in the roots of these plants. |
| Fungal biocontrol agents | Fungal biocontrol agents are the beneficial fungi that control plant pests and diseases. They are an alternative to chemical pesticides. They infect and kill the pests or compete with pathogenic fungi for nutrients and space. |
| Biofertilizers | Biofertilizers contain beneficial microorganisms that enhance soil fertility and promote plant growth. |
| Biopesticides | Biopesticides are natural/bio-based compounds used to manage agricultural pests using specific biological effects. |
| Predators | Predators in agriculture are the organisms that feed on pests and help control pest damage to the crops. Some common predator species used in agriculture include ladybugs, lacewings, and predatory mites. |
| Biocontrol agents | Biocontrol agents are living organisms used to control pests and diseases in agriculture. They are alternatives to chemical pesticides and are known for their lesser impact on the environment and human health. |
| Organic Fertilizers | Organic fertilizer is composed of animal or vegetable matter used alone or in combination with one or more non-synthetically derived elements or compounds used for soil fertility and plant growth. |
| Protein hydrolysates (PHs) | Protein hydrolysate-based biostimulants contain free amino acids, oligopeptides, and polypeptides produced by enzymatic or chemical hydrolysis of proteins, primarily from vegetal or animal sources. |
| Biostimulants/Plant Growth Regulators (PGR) | Biostimulants/Plant Growth Regulators (PGR) are substances derived from natural resources to enhance plant growth and health by stimulating plant processes (metabolism). |
| Soil Amendments | Soil Amendments are substances applied to soil that improve soil health, such as soil fertility and soil structure. |
| Seaweed Extract | Seaweed extracts are rich in micro and macronutrients, proteins, polysaccharides, polyphenols, phytohormones, and osmolytes. These substances boost seed germination and crop establishment, total plant growth and productivity. |
| Compounds related to biocontrol and/or promoting growth (CRBPG) | Compounds related to biocontrol or promoting growth (CRBPG) are the ability of a bacteria to produce compounds for phytopathogen biocontrol and plant growth promotion. |
| Symbiotic Nitrogen-Fixing Bacteria | Symbiotic nitrogen-fixing bacteria such as Rhizobium obtain food and shelter from the host, and in return, they help by providing fixed nitrogen to the plants. |
| Nitrogen Fixation | Nitrogen fixation is a chemical process in soil which converts molecular nitrogen into ammonia or related nitrogenous compounds. |
| ARS (Agricultural Research Service) | ARS is the U.S. Department of Agriculture's chief scientific in-house research agency. It aims to find solutions to agricultural problems faced by the farmers in the country. |
| Phytosanitary Regulations | Phytosanitary regulations imposed by the respective government bodies check or prohibit the importation and marketing of certain insects, plant species, or products of these plants to prevent the introduction or spread of new plant pests or pathogens. |
| Ectomycorrhizae (ECM) | Ectomycorrhiza (ECM) is a symbiotic interaction of fungi with the feeder roots of higher plants in which both the plant and the fungi benefit through the association for survival. |
Need More Details on Market Definition?
Ask a Question
Research Methodology
Mordor Intelligence follows a four-step methodology in all our reports.
- Step-1: Identify Key Variables: In order to build a robust forecasting methodology, the variables and factors identified in Step-1 are tested against available historical market numbers. Through an iterative process, the variables required for market forecast are set and the model is built on the basis of these variables.
- Step-2: Build a Market Model: Market-size estimations for the forecast years are in nominal terms. Inflation is not a part of the pricing, and the average selling price (ASP) is kept constant throughout the forecast period.
- Step-3: Validate and Finalize: In this important step, all market numbers, variables and analyst calls are validated through an extensive network of primary research experts from the market studied. The respondents are selected across levels and functions to generate a holistic picture of the market studied.
- Step-4: Research Outputs: Syndicated Reports, Custom Consulting Assignments, Databases & Subscription Platforms.

Get More Details On Research Methodology
Download PDF


