
Market Overview
| Study Period | 2020 - 2031 |
|---|---|
| Market Size (2026) | USD 73.11 Billion |
| Market Size (2031) | USD 104.69 Billion |
| Growth Rate (2026 - 2031) | 7.47 % |
| Fastest Growing Market | Asia-Pacific |
| Largest Market | North America |
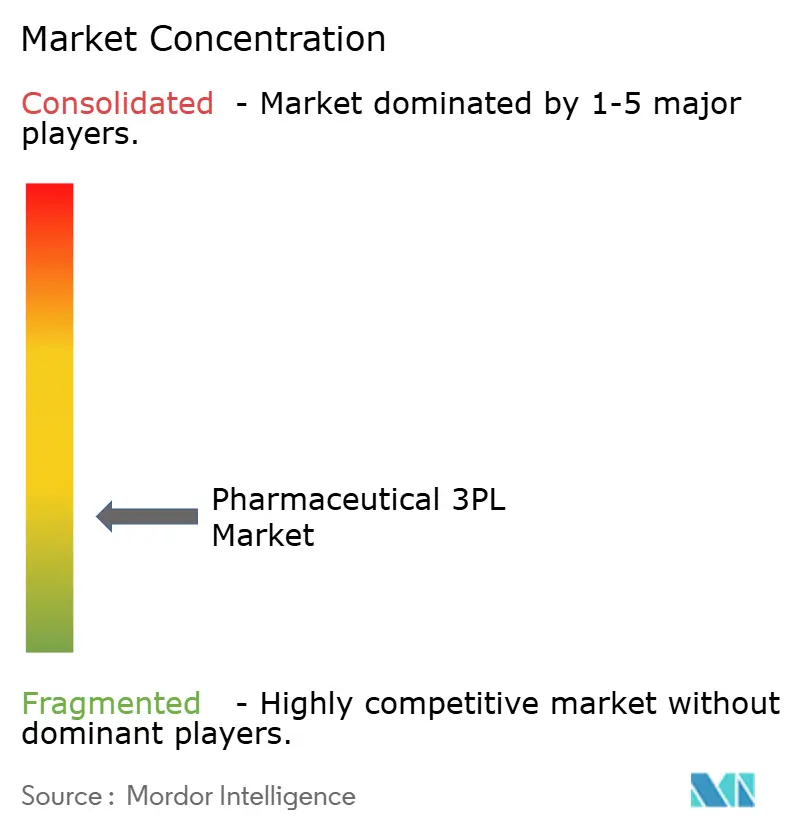
| Market Concentration | Low |
Major Players *Disclaimer: Major Players sorted in no particular order Image © Mordor Intelligence. Reuse requires attribution under CC BY 4.0. | |
Pharmaceutical 3PL Market Analysis by Mordor Intelligence
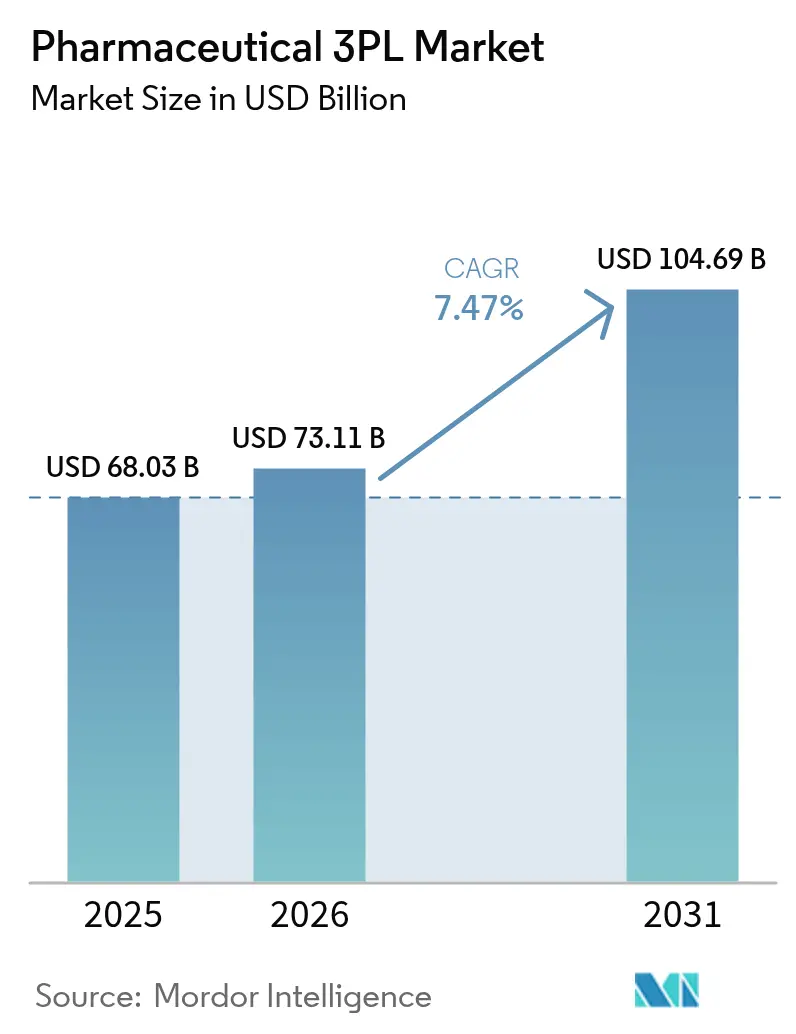
The Pharmaceutical 3PL Market size was valued at USD 68.03 billion in 2025 and estimated to grow from USD 73.11 billion in 2026 to reach USD 104.69 billion by 2031, at a CAGR of 7.47% during the forecast period (2026-2031). The growth reflects the widening range of temperature-sensitive products, tougher distribution regulations, and heightened outsourcing by small and mid-sized drug makers. Competitive intensity is rising as integrators expand dedicated healthcare networks, and investments in digital monitoring technologies deliver end-to-end shipment visibility. Demand for ultra-cold capabilities, driven by cell and gene therapies, is pulling 3PL capital toward cryogenic freezers, liquid-nitrogen shippers, and real-time IoT tracking. In parallel, the surge in e-pharmacies is parceling supply chains and pushing last-mile operators to guarantee product integrity down to the patient's doorstep. Asia-Pacific’s manufacturing build-out and government healthcare spending amplify these trends, making the region the fastest-growing arena for specialized logistics contracts.
Key Report Takeaways
- By service type, Domestic Transportation Management held 45.65% of the Pharmaceutical 3PL Market share in 2025. The Pharmaceutical 3PL Market for Value-Added Warehousing & Distribution is forecast to grow at an 8.31% CAGR between 2026-2031.
- By temperature type, non-cold chain services accounted for 63.25% of the Pharmaceutical 3PL market size in 2025. The Pharmaceutical 3PL Market for cold-chain offerings is expanding at a 10.14% CAGR between 2026-2031.
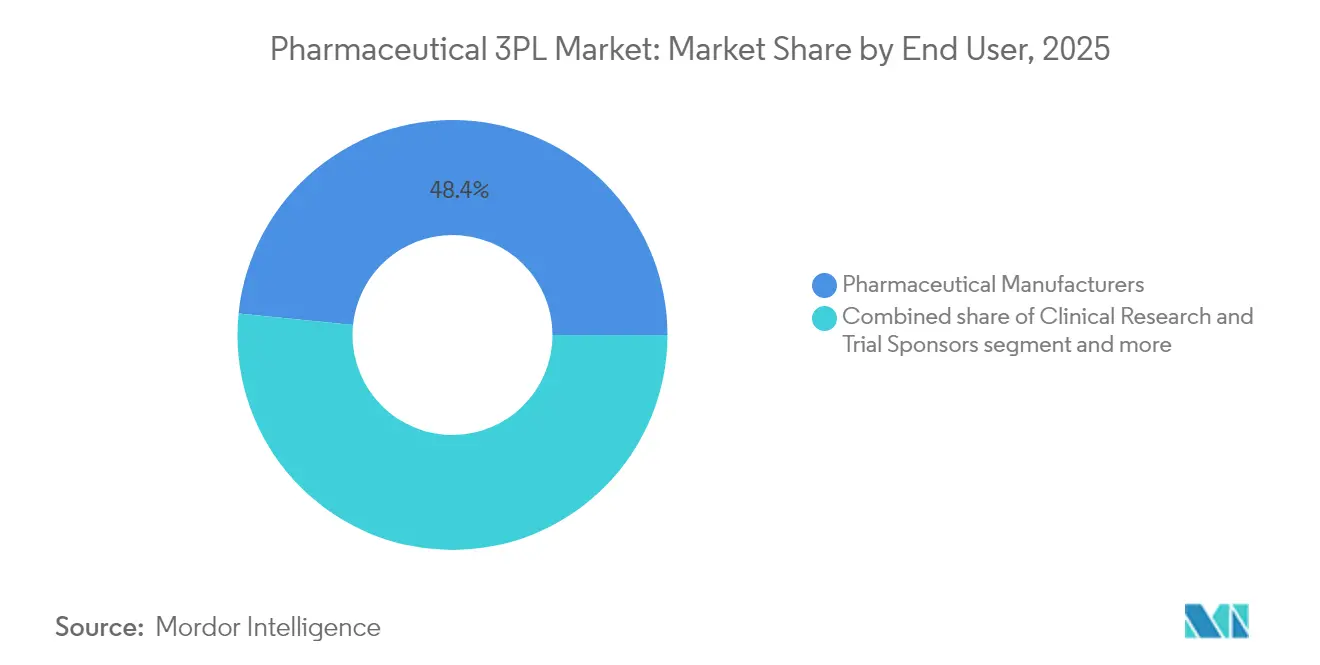
- By end user, pharmaceutical manufacturers commanded 48.40% of the Pharmaceutical 3PL market size in 2025. The Pharmaceutical 3PL Market for the e-pharmacy channel is advancing at an 11.22% CAGR between 2026-2031.
- Prescription drugs accounted for 54.20% of the pharmaceutical 3PL market in 2025, while cell and gene therapies are projected to grow at a 12.32% CAGR from 2026 to 2031.
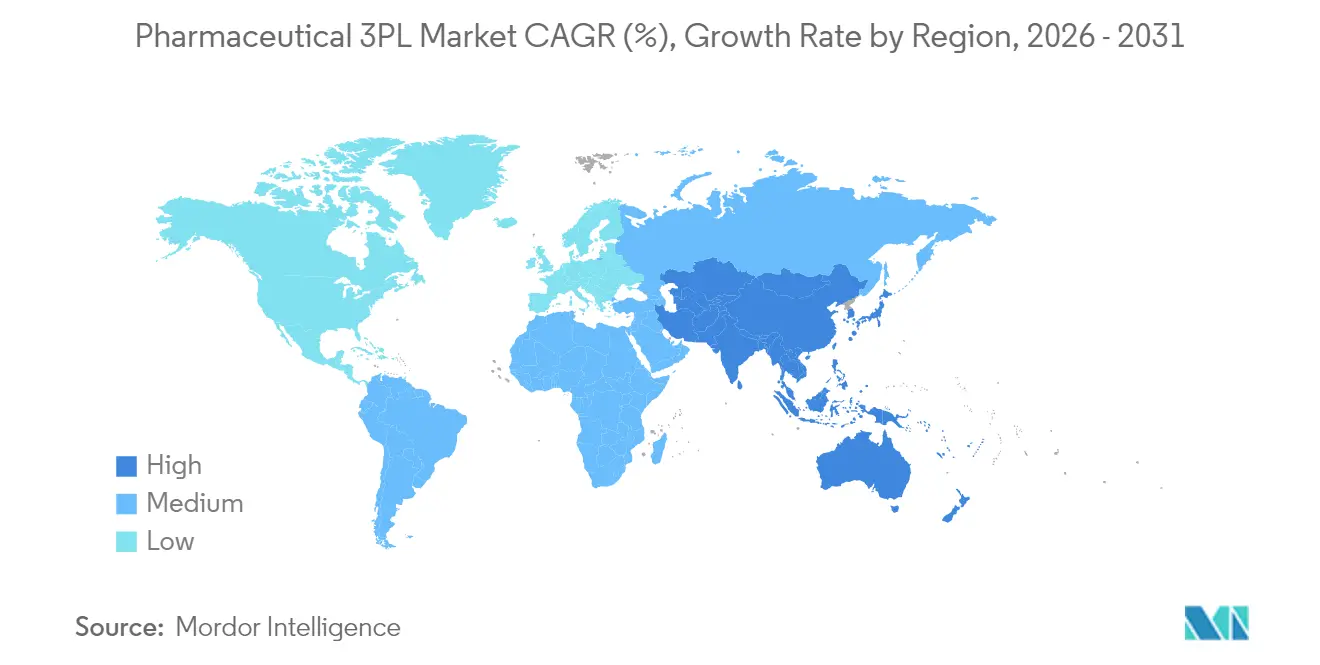
- By region, North America led with 33.40% of the Pharmaceutical 3PL market revenue share in 2025. The Pharmaceutical 3PL Market for Asia-Pacific is projected to post the fastest 10.65% CAGR between 2026-2031.
Note: Market size and forecast figures in this report are generated using Mordor Intelligence’s proprietary estimation framework, updated with the latest available data and insights as of 2026.
Market Trends and Insights
Drivers Impact Analysis of Pharmaceutical 3PL Market*
| Driver | (~) % Impact on CAGR Forecast | Geographic Relevance | Impact Timeline |
|---|---|---|---|
| Specialty biologics need cold-chain rigor | +2.1% | North America, Europe, global deployments | Medium term (2-4 years) |
| SME pharma outsourcing in emerging regions | +1.3% | Asia-Pacific, South America, Middle East | Medium term (2-4 years) |
| GDP-driven real-time monitoring | +1.0% | Europe, North America, global | Short term (≤ 2 years) |
| E-pharmacy parcelization | +1.8% | North America, Europe, developed Asia-Pacific | Short term (≤ 2 years) |
| Post-COVID vaccine pipeline | +0.9% | Global | Medium term (2-4 years) |
| IoT & blockchain visibility | +1.2% | North America, Europe, global | Medium term (2-4 years) |
| Source: Mordor Intelligence | |||
Rise of Specialty Biologics Requiring Strict Cold-Chain Compliance
Half of all vaccine doses are still lost each year because temperature excursions ruin potency, wasting USD 35 billion and exposing compliance gaps in many distribution networks[1]Patheon, “Cold Chain Challenges in Vaccine Distribution,” patheon.com. Biologics now span refrigerated, frozen, and cryogenic regimes, driving carriers to invest in GDP-certified hubs, active containers, and continuous-monitor data loggers. DHL, for example, is enlarging its Specialized Pharma Network and GDP-approved sites to double life-science revenue above EUR 10 billion (USD 11.43 billion) by 2030. These facilities combine redundant refrigeration, qualified packaging, and in-transit telemetry, allowing manufacturers to shorten inventory buffers and accelerate launch cycles.
SME Pharma Outsourcing to 3PLs in Emerging Countries
Mid-tier drug firms in India, Vietnam, and Brazil often lack the capital to install validated freezers, serialization scanners, or GDP-qualified staff. Outsourcing to regional specialists gives them compliant infrastructure on demand, improving release timelines and freeing working capital. In China, alliances between China Resources Pharmaceutical and more than 60 multinational suppliers signal robust demand for integrated storage and distribution services tailored to smaller product volumes. Vendors offering multi-tenant warehouses, batch-level traceability, and customs-brokerage support enjoy a clear advantage when courting these clients.
Stringent GDP Regulations Driving Real-Time Monitoring Investments
The European Medicines Agency resumed on-site GDP inspections during 2024 and now targets high-risk distributors first, pushing logistics operators to maintain validated temperature records at the lane level[2]European Medicines Agency, “GDP Inspections Resume Post-COVID,” ema.europa.eu. In the United States, FDA inspectors carried out 776 GDP audits in 2023, the highest tally since the pandemic. Providers are installing IoT sensors that feed control-tower dashboards, enabling proactive diversion when thresholds drift. Blockchain pilots further ensure immutable audit trails, satisfying both DSCSA mandates and rising customer expectations for verifiable provenance.
E-pharmacy Parcelization Boosting Last-Mile Temperature-Control Needs
Direct-to-patient platforms dispatch smaller, more frequent shipments that must stay within label-specific ranges across suburban and rural addresses. CoverMyMeds notes U.S. virtual pharmacies increasingly tap UPS and FedEx clinical solutions to meet next-day delivery targets while preserving cold-chain integrity[3]. The model pushes 3PLs to blend insulated shippers, reusable gel packs, and real-time routing algorithms to manage cost without sacrificing compliance. Hub-and-spoke micro-fulfilment centers near demand clusters reduce transit time and risk as prescription volumes migrate online.
Restraints Impact Analysis of Pharmaceutical 3PL Market*
| Restraint | (~) % Impact on CAGR Forecast | Geographic Relevance | Impact Timeline |
|---|---|---|---|
| Cold-chain infrastructure deficit | –1.5% | Africa, parts of Asia-Pacific, South America | Long term (≥ 4 years) |
| Cost pressure from tendering models | –0.8% | Europe, emerging markets | Medium term (2-4 years) |
| Cross-border regulatory divergence | –1.2% | Major trade lanes | Medium term (2-4 years) |
| GDP-trained labor shortage | –0.7% | North America, Europe | Short term (≤ 2 years) |
| Source: Mordor Intelligence | |||
Cold-Chain Infrastructure Deficit in Developing Regions
Limited GDP-compliant storage and inconsistent power grids constrain vaccine outreach across sub-Saharan Africa and parts of Southeast Asia. Portable solar freezers and community distribution hubs are emerging stopgaps, yet capacity lags behind the booming pipeline of temperature-sensitive medicines. Multinational 3PLs face higher set-up costs and longer payback horizons, dampening expansion pace despite compelling public-health needs.
Cross-Border Regulatory Divergence Complicating Trade Flows
Rules such as the Windsor Framework oblige distributors serving Northern Ireland to comply with both UK and EU GDP statutes, triggering duplicate audits and documentation. Similar dual standards arise in GCC states and Mercosur countries, extending transit times and raising inventory buffers. Firms with strong regulatory affairs benches and multilingual control tower staff can mitigate these bottlenecks, but smaller brokers risk fines or shipment delays.
*Our forecasts treat driver/restraint impacts as directional, not additive. The impact forecasts reflect baseline growth, mix effects, and variable interactions.
Pharmaceutical 3PL Market Segment Analysis
By Service Type:
Value-Added Warehousing & Distribution AcceleratesThe service-mix within the pharmaceutical 3PL market remains skewed toward Domestic Transportation Management, which accounted for 45.65% revenue in 2025. Yet the Value-Added Warehousing & Distribution sub-category is set to expand at an 8.31% CAGR, reflecting drug makers’ appetite for single-window partners able to store, kit, relabel, and comply with stringent sampling requirements. Providers differentiate by offering modular clean-rooms, serialization lines, and GDP-audited custody processes. The pharmaceutical 3PL market size for warehousing services should therefore outpace line-haul revenues as manufacturers incorporate postponement strategies and later-stage customization closer to end markets. Advanced warehouse-management systems, vertical racking, and energy-efficient refrigeration improve both cost and carbon metrics, reinforcing customer loyalty.
Domestic Transportation Management retains the scale advantage thanks to its embedded role in the daily replenishment of hospitals and pharmacies. However, pricing remains competitive and heavily dependent on fuel surcharges. International Transportation Management grows more slowly as cross-border regulatory divergence and modal congestion lengthen cycle times. Market leaders funnel capital into freight-forwarding control towers and customs-broker platforms, but smaller operators seek niche differentiation by specializing in clinical trials or named-patient imports, cushioning margin compression within the broader pharmaceutical 3PL market.


By Temperature Type:
Cold Chain Outpaces AmbientNon-cold services dominated 63.25% of 2025 revenue but are projected to lose mix as temperature-controlled lanes post a robust 10.14% CAGR. Ambient lanes nonetheless remain critical for over-the-counter analgesics, generics, and bulk excipients, constraining price hikes due to abundant carrier capacity. Conversely, cryogenic moves for cell & gene therapies command premium yields, often five to seven times higher than refrigerated tariffs. Such disparities compel operators to segment fleets and warehouses by lane-specific margin profiles, sharpening the strategic focus across the pharmaceutical 3PL market.
Infrastructural investment concentrates on hybrid cold rooms that flex between 2 °C and –20 °C, backed by dual-redundant compressors and real-time validation. Where the pharmaceutical 3PL market share for frozen lanes approaches regulatory thresholds, carriers trial passive containers with phase-change materials to shrink dry-ice carbon footprints. Digital twin simulations flag potential bottlenecks, helping planners reroute around weather disruptions while maintaining validated temperature brackets.
By End User:
E-Pharmacies Transform FulfilmentManufacturers still supplied 48.40% of the 2025 revenue pool, leveraging the pharmaceutical 3PL market for compliant storage and bulk distribution to wholesalers and hospital networks. Yet the direct-to-consumer subsector of e-pharmacies will climb at an 11.22% CAGR, fueled by prescription digitization and insurer incentives for home delivery. This shift multiplies stock-keeping units and accelerates pick-cycles, prompting 3PLs to retrofit facilities with automated dispensers, vision-based QA checks, and secure locker loading bays.
Traceability legislation obliges serial-level scanning for each outbound parcel, raising the data burden. Providers that pair IoT beacons with AI route optimization can curtail spoilage risk and improve on-time performance, winning repeat business from tele-health platforms. The pharmaceutical 3PL industry, therefore, pivots from pallet-centric operations to parcelled networks, increasing demand for small-format insulated shippers and reusable packaging pools that trim waste and align with ESG goals.
By Product Type:
Cell & Gene Therapies Stretch LogisticsPrescription medicines delivered 54.20% of 2025 revenue, underpinned by long-established supply chains and predictable order patterns. The cold-chain subset within this segment nevertheless expands as biologics gain label share. Meanwhile, cell and gene therapies post a 12.32% CAGR and trigger unprecedented handling complexity across the pharmaceutical 3PL market size. Each personalized batch travels under chain-of-identity controls at cryogenic temperatures below –150 °C, leaving no room for replacement in case of excursion.
3PLs invest in vapour-phase LN2 shippers, redundant temperature probes, and 24/7 command centers staffed by life-science engineers. World Courier reports that nearly 60% of CGT developers expect cryogenic-transport demand to surge, validating this CapEx trajectory. The pharmaceutical 3PL market share for CGT lanes thus rises disproportionately to shipment volume, contributing outsized profitability but requiring rigorous SOP governance to pass sponsor audits and regulatory inspections.
Geography Analysis
North America Pharmaceutical 3PL Market
North America accounted for 33.40% of global revenue in 2025, buoyed by robust biologics pipelines, advanced cold-chain capacity, and integrated regulatory frameworks. UPS alone targets USD 20 billion in healthcare logistics turnover by 2026, a goal underwritten by acquisitions such as Frigo-Trans, which bolsters multi-temperature offerings across continental corridors. The United States’ DSCSA rollout and Canada’s tightened Health Canada guidelines sustain demand for serialization, track-and-trace, and GDP-qualified personnel. As a result, the region’s pharmaceutical 3PL market cultivates premium-priced lanes and remains a bellwether for service innovation.
APAC Pharmaceutical 3PL Market
Asia-Pacific will post the strongest 10.65% CAGR through 2031, propelled by manufacturing scale-ups in China and India and widened insurance coverage in Indonesia, Thailand, and Vietnam. China Resources Pharmaceutical’s partnerships with Pfizer and AstraZeneca illustrate the shift toward integrated warehousing and distribution platforms that span B2B and direct-to-patient channels. Japanese incumbents such as ALPS LOGISTICS and MITSUI-SOKO broaden cryogenic networks, while Singapore’s GDP-certified free-trade zone warehousing reinforces the city-state’s hub status. Infrastructure gaps persist in secondary cities, but national logistics corridors, highway upgrades, and customs digitalization narrow the service-level divide.
Europe Pharmaceutical 3PL Market
Europe maintains a sizeable share underpinned by strict GDP oversight and resilient life-science clusters in Germany, Switzerland, and Ireland. The European Medicines Agency’s resumed inspections stress continuous temperature documentation, spurring carriers to retrofit fleets with calibrated IoT sensors. Cross-border complexity after Brexit and the Windsor Framework forces distributors serving Northern Ireland to dual-qualify processes under both EU and UK statutes, elevating compliance overhead. Operational resilience remains high as trans-European rail and road corridors integrate with well-established air-cargo gateways at Frankfurt, Amsterdam-Schiphol, and Liege.

Regulatory Landscape
Pharmaceutical 3PL operations are shaped by overlapping distribution-quality and traceability requirements that vary by lane and product category. In the United States, the FDA-administered Drug Supply Chain Security Act (DSCSA) continues to drive package-level traceability and interoperability requirements across manufacturers, wholesalers, and dispensers, increasing compliance complexity for 3PLs that operate hubs, repack, or manage exception handling. In March 2026, the FDA published a final rule to standardize the National Drug Code (NDC) to a uniform 12-digit format, which raises data-governance and master-data alignment needs across warehouse systems, labeling workflows, and downstream EDI integrations.
In Europe, 3PLs handling medicines must operate under authorization from national competent authorities and comply with EU Good Distribution Practice (GDP) guidance referenced through EudraLex. The European Medicines Agency resumed on-site GDP inspections during 2024 with a focus on higher-risk distributors, reinforcing the need for validated temperature records and auditable deviation management. Global operators also align shipping and packaging controls with WHO storage and transport guidance for pharmaceuticals, and air logistics programs increasingly reference temperature-control frameworks used across the industry to support harmonized handling of time- and temperature-sensitive products on key lanes.
Value Chain Analysis
The pharmaceutical 3PL value chain covers inbound handling of finished medicines (and, in some models, clinical-trial materials), GDP-compliant storage, order configuration (labeling, kitting, serialization-related scanning), and multi-modal distribution to wholesalers, hospitals, retail pharmacies, and direct-to-patient channels. Upstream variability in supply availability and lane stability flows through to downstream inventory posture, where 3PLs buffer volatility through multi-tenant warehousing and control-tower execution that coordinates carriers, packaging, and compliance documentation. As therapies shift toward higher value products and tighter temperature bands, specialized packaging suppliers (active containers, qualified shippers, phase-change materials), sensor and IoT data providers, and quality assurance services are becoming core value-chain enablers alongside transport capacity.
Network design and execution increasingly emphasize temperature-controlled cross-docks, airport-adjacent handling, and real-time visibility to reduce dwell time and excursion risk. UPS Healthcare’s early 2026 expansion of a global footprint of temperature-controlled cross-dock facilities illustrates this operational pivot. In 2026, new GDP-certified air-cargo corridors on key transatlantic connections also strengthen controlled handoffs between European pharma hubs and US gateways. At the same time, disruption-driven routing changes on critical maritime chokepoints have increased the value of 3PLs that combine compliance-led warehousing with agile freight-forwarding and exception management.
Competitive Landscape
Competition in the pharmaceutical 3PL market balances scale economics against niche specialization. DHL Supply Chain, UPS Healthcare, and FedEx Custom Critical anchor the top tier, leveraging multi-continent networks, GDP-compliant facilities, and aggressive acquisition pipelines. DHL’s USD 2.2 billion five-year investment plan targets network densification and doubled life-science revenue by 2030, aided by its 2025 takeover of Cryopdp, a clinical-trial courier. UPS mirrors that strategy with purchases of temperature-controlled specialists Frigo-Trans and BPL, consolidating capabilities across Europe and North America.
Mid-cap players such as World Courier, Marken, and GEODIS carve defensible niches by excelling in time-critical therapeutic areas, clinical-trial supply, and value-added analytics. Their agility and therapy-specific know-how often attract biotech sponsors seeking bespoke solutions outside global integrators’ standardized playbooks. Technology differentiators include blockchain-enabled provenance, digital twins for route simulation, and AI-assisted demand forecasting. Barriers to entry rise as certification costs, cryogenic infrastructure, and cybersecurity mandates escalate, yet regional champions still emerge by mastering local regulatory requirements and building pharmacist-level competence among frontline staff.
Long-run competitive advantage hinges on continuous innovation in packaging sustainability, carbon-neutral lane design, and integrated billing-plus-compliance dashboards. Partnerships with packaging manufacturers, sensor providers, and cloud analytics firms will dictate future winners as the pharmaceutical 3PL market shifts from transactional freight transactions to data-rich, risk-managed supply chain orchestration.
Pharmaceutical 3PL Industry Leaders
DHL Supply Chain & Global Forwarding
Kuehne + Nagel International AG
UPS Healthcare
FedEx Logistics
DB Schenker
- *Disclaimer: Major Players sorted in no particular order
Pharmaceutical 3PL Market Companies Covered in this Report
- DHL Supply Chain and Global Forwarding
- Kuehne + Nagel International AG
- UPS Healthcare
- FedEx Logistics
- DB Schenker
- Nippon Express Co., Ltd.
- CEVA Logistics
- Kerry Logistics Network
- Agility Logistics
- XPO Logistics
- Yusen Logistics
- Movianto (Walden Group)
- SF Express (Health)
- DSV Panalpina A/S
- Catalent Clinical Supply Services
- JAS Worldwide Pharma and Healthcare
- Bolloré Logistics
- Sinotrans
- Bomi Group
- Biocair
- GEODIS
- World Courier (Cencora)
- Marken
- Fiege Pharma Logistics
- Kintetsu World Express
- Almac Group Clinical Services

Market Opportunities and Future Outlook
Cold-chain densification around major pharma clusters and air gateways is an identifiable whitespace as product mixes move toward biologics and specialized injectables, and as direct-to-patient models increase small-lot shipment frequency. In June 2026, UPS announced a USD 48 million investment in 27 temperature-controlled freight cross-dock facilities globally, which highlights the operational premium placed on fast, validated handoffs across lanes. Capacity additions also appear in dedicated temperature-controlled warehousing in Europe and the United States, including Movianto expanding its Aalst, Belgium site and Langham Logistics opening a large cold-chain facility in Plainfield, Indiana, both geared toward multi-temperature storage and higher-throughput fulfillment.
A second opportunity area centers on compliance-led digital execution, where GDP documentation, lane qualification, and temperature excursion governance increasingly depend on integrated data capture across packaging, transport, and warehousing. Updates to USP transportation-related general chapters, including Mean Kinetic Temperature evaluation and lane mapping/qualification workstreams, reinforce demand for standardized lane qualification, continuous monitoring, and audit-ready data retention. In tenders that evaluate both service performance and compliance assurance across domestic and cross-border networks, 3PLs that combine temperature-controlled infrastructure with validated monitoring, exception workflows, and customer-facing reporting (including serialization-adjacent scanning in parcel workflows for e-pharmacy fulfillment) can strengthen their positioning.
Recent Industry Developments in Pharmaceutical 3PL Market
- June 2026: UPS announced a USD 48 million investment in 27 temperature-controlled freight cross-dock facilities across its global network. The move expands rapid handoff points for time- and temperature-sensitive medicines, tightening transit windows and reducing excursion exposure on multi-leg routes. It also raises the competitive baseline for mid-sized providers that lack comparable cross-dock density.
- May 2026: Kuehne+Nagel opened a temperature-controlled airfreight cross-dock facility in Hyderabad, India, to support pharma manufacturing export flows and GxP-compliant distribution. The added capability strengthens controlled airport-adjacent handling in a major production region, supporting faster consolidation and reduced dwell time for temperature-sensitive shipments. This builds out a more standardized healthcare operating model across emerging-market nodes.
- April 2024: DHL Supply Chain expanded pharma logistics operations in France, adding capacity and capabilities oriented to regulated healthcare distribution. The investment supports GDP-compliant handling closer to key French life-science clusters and improves service continuity for domestic and regional European lanes. It also reflects integrators prioritizing dedicated healthcare infrastructure in mature European markets where inspection intensity and documentation expectations are high.


Pharmaceutical 3PL Market Report Scope and Research Methodology
Market Definition and Coverage
This market covers third party logistics services used to store, handle, and move finished pharmaceutical and biopharmaceutical products under compliant distribution practices, across domestic and international routes, including temperature-sensitive shipments.
Scope exclusions: We exclude bulk active-ingredient freight, primary drug packaging line activity, and captive in-house logistics operations that are not billed as third party services.
Segments Covered in This Report
- By Service Type
- Domestic Transportation Management (DTM)
- Roadways
- Railways
- Airways
- Waterways
- International Transportation Management (ITM)
- Roadways
- Railways
- Airways
- Waterways
- Value-Added Warehousing and Distribution (VAWD)
- Domestic Transportation Management (DTM)
- By Temperature Type
- Cold Chain
- Non-cold Chain
- By End User
- Pharmaceutical Manufacturers
- Biotech and Biosimilar Manufacturers
- Clinical Research and Trial Sponsors
- Hospitals and Retail Pharmacies
- Healthcare Distributors and Wholesalers
- E-pharmacies and Direct-to-Patient Services
- By Product Type
- Prescription Drugs
- OTC and Consumer Health Products
- Biopharmaceuticals and Biosimilars (ex-CGT)
- Cell and Gene Therapies
- Vaccines and Blood-derived Products
- Veterinary Pharmaceuticals and Animal Health Products
- Medical Devices, Diagnostics and Combination Products
- Clinical-trial Materials (Investigational Medicinal Products)
- Others
- By Region
- North America
- United States
- Canada
- Mexico
- South America
- Brazil
- Argentina
- Chile
- Rest of South America
- Europe
- Germany
- United Kingdom
- France
- Spain
- Italy
- Netherlands
- Russia
- Rest of Europe
- Asia-Pacific
- China
- India
- Japan
- South Korea
- Singapore
- Vietnam
- Indonesia
- Australia
- Rest of Asia-Pacific
- Middle East
- United Arab Emirates
- Saudi Arabia
- Turkey
- Israel
- Rest of Middle East
- Africa
- South Africa
- Egypt
- Nigeria
- Kenya
- Rest of Africa
- North America
Data Sources, Market Sizing, and Validation
Desk Research
Desk work starts by mapping how much medicine is being produced and shipped, and what portion typically moves through outsourced logistics partners, because that gives us a practical demand pool. We refer to public datasets and guidance such as WHO materials on medicines and supply chains, World Bank logistics and trade indicators, UN Comtrade trade flows for pharmaceuticals, and FDA and EMA GDP related guidance that shapes handling requirements and cost intensity.
To translate demand signals into a revenue view, we also review public annual reports and investor presentations of listed logistics and distribution groups, plus reputable industry press and association publications that discuss cold chain capacity additions and regulatory changes. Where needed, we use paid subscriptions for company financials and intelligence, patent databases for packaging and temperature-control developments, and an import and export shipment-level database to cross-check lane activity. These examples are not exhaustive, and many other public and paid sources were also used to collect data, validate assumptions, and clarify gaps.
Primary Interviews and Surveys
Primary interviews and surveys are used to pressure-test our assumptions on outsourcing penetration, cold chain share, and typical pricing progression before the model is finalized. We spoke with a mix of logistics providers, pharma and biotech supply chain teams, and distribution and quality leaders across major trade lanes, so the inputs reflect operating constraints, not just published narratives.
Distribution of primary research fieldwork respondents
| Company type | Respondent position | Region |
|---|---|---|
| Top tier: 30% | CXOs: 15% | APAC: 46% |
| Mid tier: 52% | Functional/Unit leaders: 37% | EMEA: 36% |
| Smaller Players: 18% | Managers: 48% | Americas: 18% |
Market-Sizing & Forecasting
Market sizing is built with a top-down structure where global pharmaceutical production and trade activity are reconstructed into logistics demand, which is then filtered by the share typically outsourced to 3PLs and the mix of temperature handling needed. Once that backbone is in place, we corroborate it with selective bottom-up checks such as sampled provider revenue splits, lane-based volume times typical rate bands, and warehouse capacity signals, and then adjust totals where the checks consistently point to a gap.
Inputs that matter in this market include the cold chain versus ambient shipment mix, the share of biologics and specialty medicines in overall volumes, air versus ocean and road mode preferences, GDP compliance and serialization handling intensity, and typical storage dwell time in hubs. Forecasts are developed using scenario analysis, where core drivers like biologics growth and cold chain capacity expansion are varied within ranges aligned with expert feedback. When bottom-up information is incomplete for smaller countries or niche services, we fill gaps using proxy relationships (trade flows, healthcare spend direction, and infrastructure indicators) and keep the logic consistent across regions.
Data Validation & Update Cycle
Validation is done through several passes so the final numbers are not the output of one spreadsheet run. We compare the model results against independent signals such as pharma trade growth, cold chain infrastructure announcements, and the direction of outsourced logistics spend shared by interviewees, and then investigate outliers by geography and service type.
Before sign-off, a second analyst reviews the assumptions and checks for currency and unit consistency, and follow-up calls are triggered when a variance cannot be explained by a documented driver. Reports are refreshed annually, with interim updates when material events change pricing, capacity, or regulation, and a final pre-delivery review is completed so clients receive the most current view.
Mordor Intelligence's Global Pharmaceutical 3pl Market Sizing Compared With Other Published Estimates
It is normal to see different market values for pharmaceutical 3PL because publishers may not align on what counts as third party logistics revenue, which years are treated as the base, and how temperature-controlled complexity is priced. Differences also show up when one estimate is anchored on service revenue and another leans more on broader pharma logistics spending.
Key gap drivers in this market usually come from timing and pricing mechanics, where currency conversion dates, inflation pass-through assumptions, and the way cold chain premiums are applied can shift the total materially. By refreshing FX timing and rate logic during the final validation pass (instead of relying on a static average) and then re-checking against trade and cold chain signals, Mordor Intelligence keeps the 2025 value tied to an auditable demand pool rather than an aggressive spending envelope.
Benchmark comparison
| Source | Market Size | Gaps in Research Methodology |
|---|---|---|
| Mordor Intelligence | USD 68.03 B (2025) | |
| Global Consultancy A | USD 137.25 B (2024) | Uses a broader service boundary that can blend pharma logistics spend with adjacent activities, and the base year is earlier, which also changes the inflation and FX context used for the value. |
| Industry Newswire B | USD 137.50 B (2024) | Relies on a press-summary estimate with limited visibility on how cold chain premiums and service mix were applied, and it does not clearly document the currency timing used to normalize global revenues. |
The spread in figures mainly reflects year selection and how each publisher treats pricing uplift for cold chain and value-added handling, not just different growth opinions. When the scope is kept to billed 3PL services and the conversion and rate assumptions are checked against real shipment and capacity signals, the resulting total is easier to trace and repeat across updates.


Key Questions Answered in the Report
What is the projected growth rate of the pharmaceutical 3PL market between 2026 and 2031?
The pharmaceutical 3PL market is forecast to expand at a 7.47% CAGR, rising from USD 73.11 billion in 2026 to USD 104.69 billion by 2031.
Which service segment is expected to grow the fastest?
Value-Added Warehousing & Distribution leads with an 8.31% CAGR, reflecting demand for integrated storage, inventory and packaging services.
Why is Asia-Pacific the fastest-growing region for pharmaceutical 3PL services?
Manufacturing scale-ups in China and India, rising healthcare spending and ongoing infrastructure upgrades lift the region toward a 10.65% CAGR.
How are e-pharmacies changing pharmaceutical logistics?
E-pharmacies increase parcel-level, temperature-controlled deliveries directly to patients, boosting last-mile complexity and driving 11.22% CAGR for this end-user segment.
What technologies are most critical for ensuring compliance in pharmaceutical logistics?
IoT sensors for real-time monitoring, blockchain for immutable traceability and digital-twin analytics for proactive lane management are now central to GDP compliance.
What makes cell & gene therapy logistics uniquely challenging for 3PLs?
These therapies require cryogenic conditions below –150 °C, strict chain-of-identity processes and rapid, individualized delivery windows, demanding specialized infrastructure and 24/7 oversight.
Page last updated on:


 Your data is secure and never sold or shared.


