Market Overview
| Study Period | 2021 - 2031 |
|---|---|
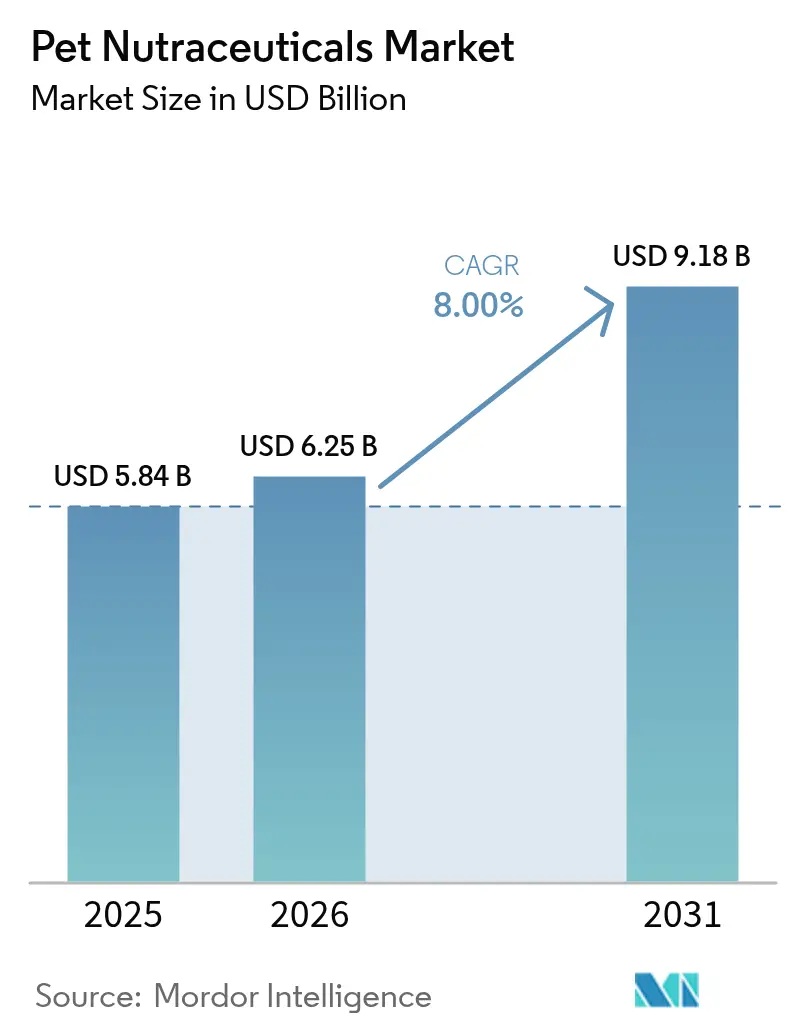
| Market Size (2026) | USD 6.25 Billion |
| Market Size (2031) | USD 9.18 Billion |
| Growth Rate (2026 - 2031) | 8.00% CAGR |
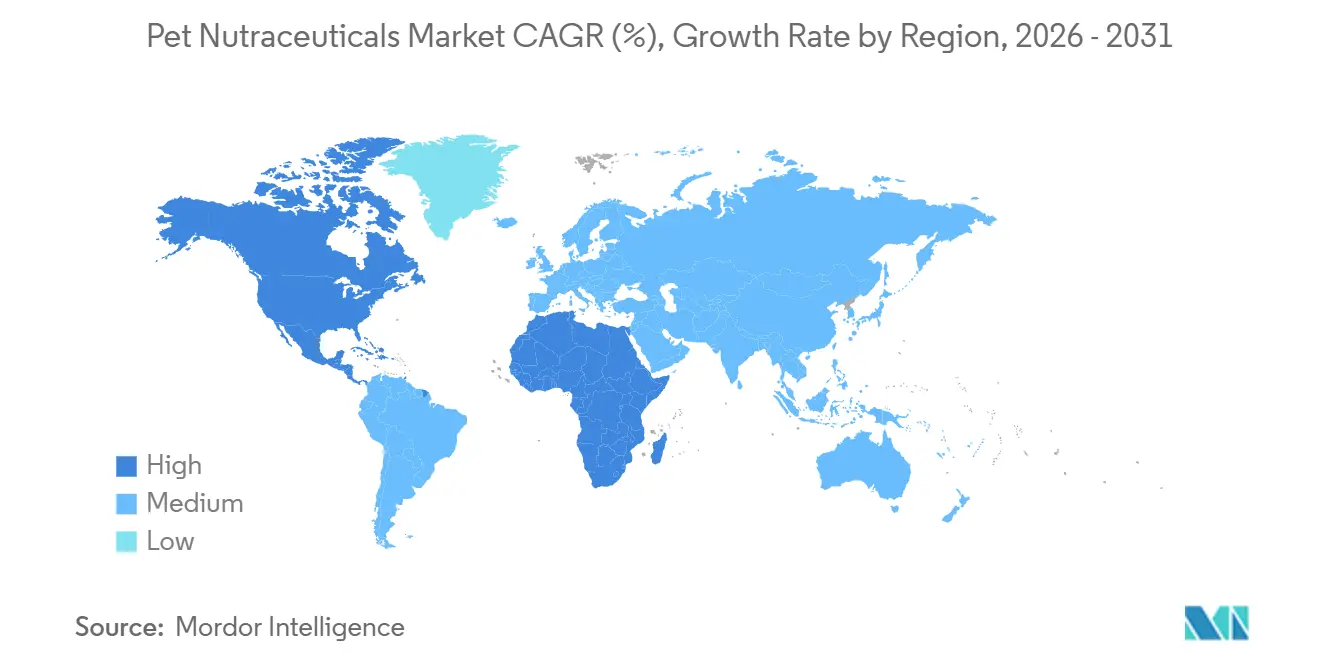
| Fastest Growing Market | Africa |
| Largest Market | North America |
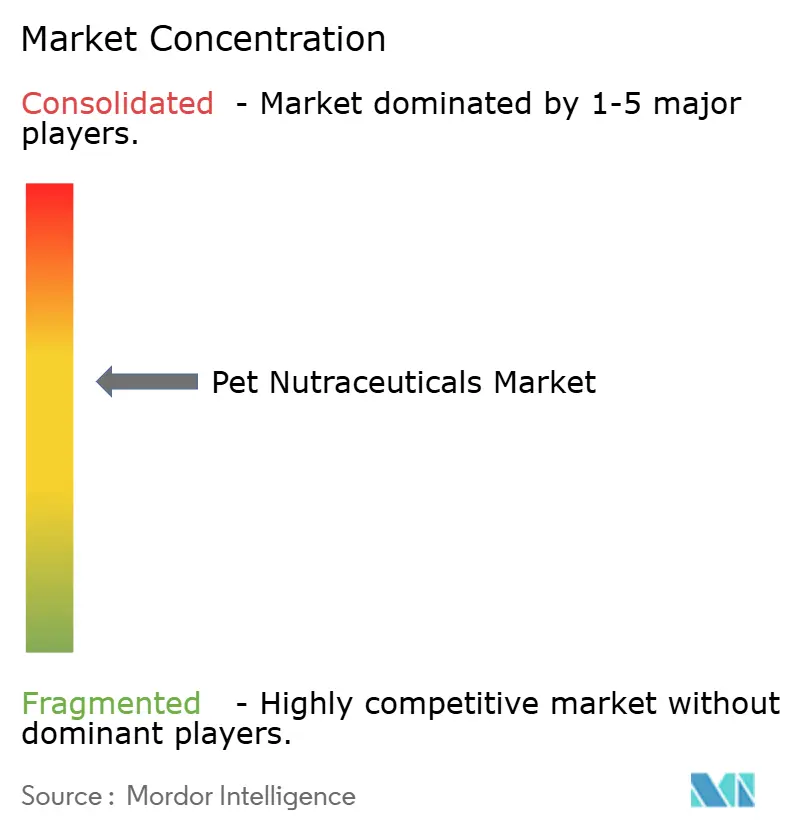
| Market Concentration | Medium |
Major Players
*Disclaimer: Major Players sorted in no particular order Image © Mordor Intelligence. Reuse requires attribution under CC BY 4.0. |
|
Pet Nutraceuticals Market Analysis by Mordor Intelligence
The pet nutraceuticals market size is projected to expand from USD 5.84 billion in 2025 to USD 6.25 billion in 2026 and further reach USD 9.18 billion by 2031, registering a CAGR of 8.0% during 2026–2031. The growing adoption of precision-nutrition protocols that align veterinary diagnostics with consumer-grade wearables is expanding the addressable base of health-focused pet owners. North America dominated 2025 revenue, driven by high veterinary clinic density and strong willingness to pay for condition-specific formulations. Africa is projected to be the fastest-growing region through 2031, as urbanization, mobile commerce, and rising disposable incomes accelerate the adoption of supplements in Nigeria, Kenya, and South Africa. Dogs remained the leading pet segment in terms of demand in 2025, yet cat-focused products are expanding on the back of new urinary and joint formulations that address species-specific metabolic needs. Vitamins and minerals sub-product revenue continues to underpin baseline wellness regimens even as probiotics and omega-3s garner media visibility.
Key Report Takeaways
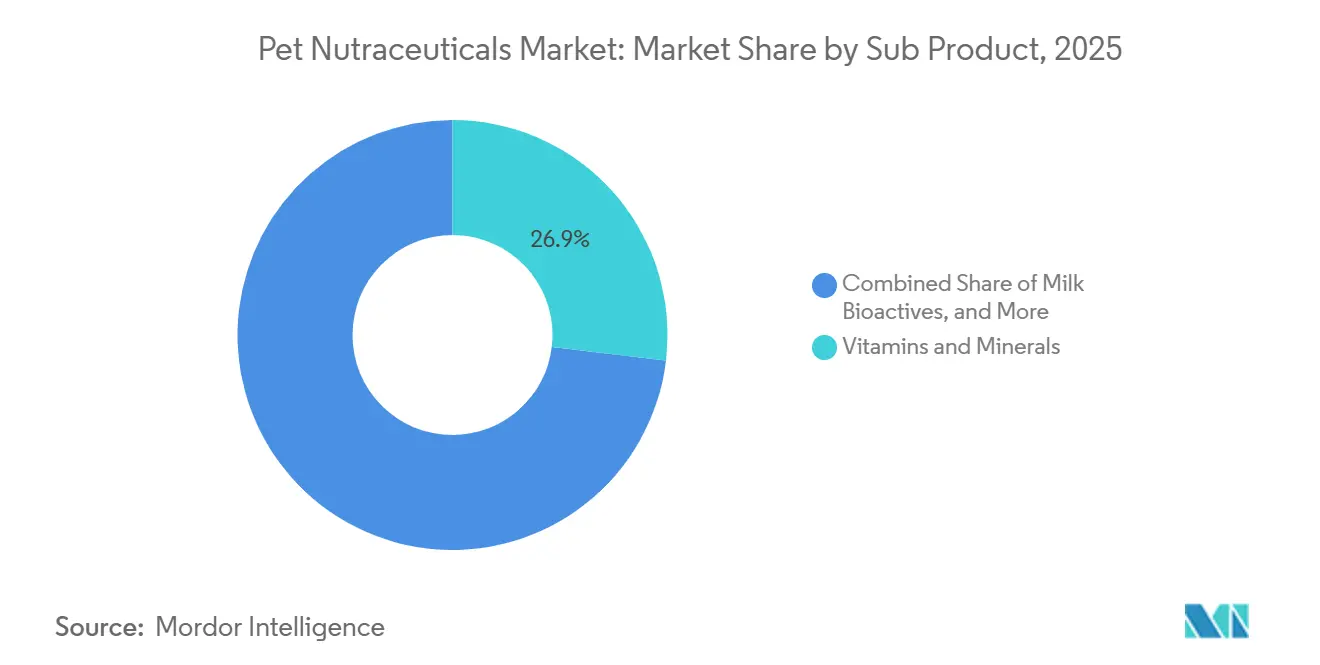
- By sub product, vitamins and minerals led with 26.9% of the pet nutraceuticals market share in 2025 and are forecast to grow at an 8.5% CAGR to 2031.
- By pets, dogs captured 58.1% of the pet nutraceuticals market size in 2025, whereas cats recorded the highest projected CAGR of 8.9% through 2031.
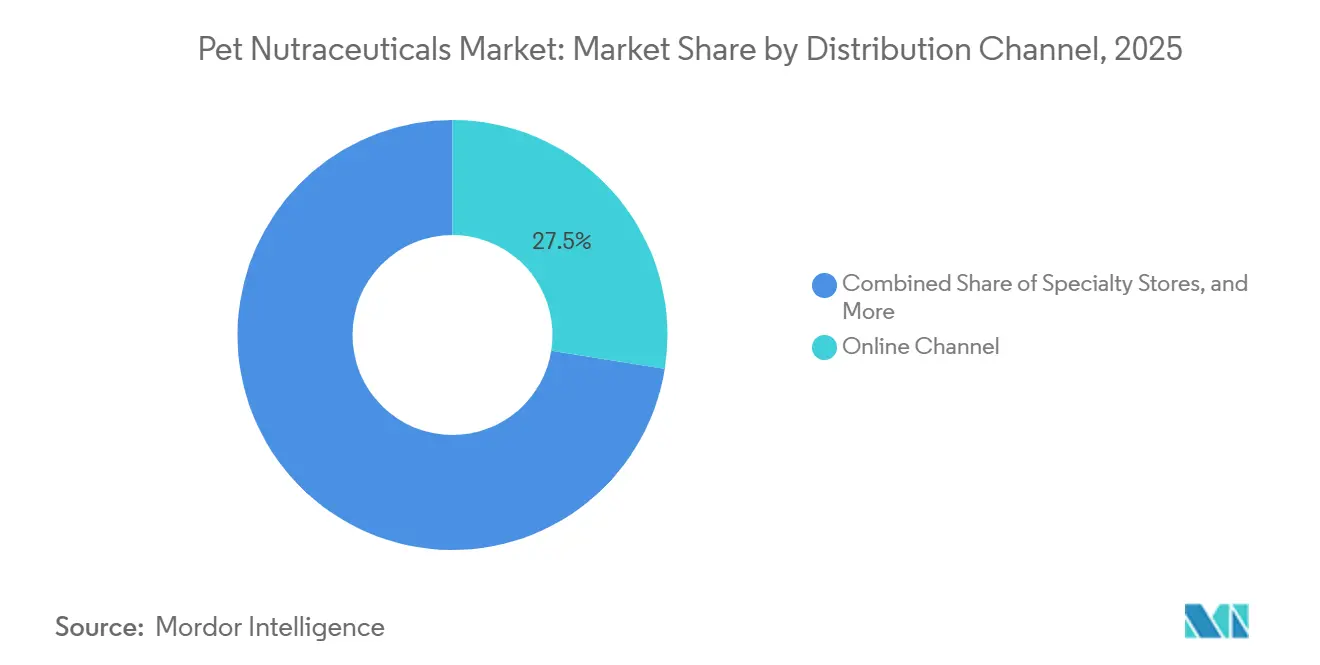
- By distribution channel, the online channel accounted for 27.5% of 2025 sales, yet it is advancing at an 8.8% CAGR between 2026 and 2031.
- By geography, North America commanded a 40.9% share of the 2025 baseline, whereas the Africa region is on track for a leading 10.2% CAGR through 2031.
- Market concentration is moderate, with the top five companies, Mars, Incorporated, Vetoquinol SA (Soparfin SCA), Nestlé Purina PetCare Company (Nestlé S.A.), Alltech, Inc., and Archer Daniels Midland Company, collectively holding a significant market share in 2025.
Note: Market size and forecast figures in this report are generated using Mordor Intelligence’s proprietary estimation framework, updated with the latest available data and insights as of 2026.
Global Pet Nutraceuticals Market Trends and Insights
Drivers Impact Analysis*
| Driver | (~) % Impact on CAGR Forecast | Geographic Relevance | Impact Timeline |
|---|---|---|---|
| Rising incidence of pet obesity and chronic diseases | +1.3% | North America, Europe, and global spillover | Medium term (2-4 years) |
| Humanization of pets drives functional-nutrition demand | +1.1% | North America, Europe, and urban Asia-Pacific | Long term (≥ 4 years) |
| Premiumization elevates spend on wellness products | +1.0% | North America, Western Europe, and Australia | Medium term (2-4 years) |
| Post-pandemic pet ownership among Gen Z boosts supplement purchases | +0.9% | North America, Europe, and urban Asia-Pacific | Short term (≤ 2 years) |
| Veterinary clinic data analytics enabling personalized nutraceutical regimens | +0.7% | North America, Western Europe, and Japan | Long term (≥ 4 years) |
| E-commerce subscription models expand reach | +0.6% | Global with early gains in North America, Europe, and China | Medium term (2-4 years) |
| Source: Mordor Intelligence | |||
Understand The Key Trends Shaping This Market
Download PDF
Rising Incidence of Pet Obesity and Chronic Diseases
Pet obesity rates in the United States are increasing, posing a significant health concern for veterinarians and pet owners. In 2024, 33% of cat owners and 35% of dog owners in the United States reported their pets as overweight or obese, up from 28% for cats and 17% for dogs in 2023 [1]Source: Association for Pet Obesity Prevention, “2024 Pet Obesity and Nutrition Survey Highlights,” petobesityprevention.org. This trend has increased the demand for weight-management supplements containing L-carnitine and fiber blends. Veterinary practices now embed body-condition scoring into routine visits, normalizing nutraceutical prescriptions for chronic disease prevention. A 2024 study published in the Indian Journal of Animal Research, conducted in Gujarat, India, reported an overall incidence of renal disorders in dogs of 5.96%. The highest occurrence was observed in the 6-8 years age group (9.62%) and in male dogs (6.61%). Among dog breeds, the Labrador Retriever showed the highest incidence (9.68%), followed by the German Shepherd (7.24%). The pivot from episodic treatment to preventive supplementation mirrors the broader human wellness economy and underpins sustained product demand.
Humanization of Pets Drives Functional-Nutrition Demand
In 2025, a significant portion of pet owners in the United States emphasized that their pets' diets were as important as their own, reflecting a growing focus on ingredient transparency. Premium buyers closely examined product labels for allergens and artificial additives, driving the adoption of clean-label nutraceuticals. Functional claims, such as cognitive support and immune modulation, gained traction as they mirrored human supplement categories, promoting cross-purchasing within households. Millennials and Generation Z spent more per pet annually compared to baby boomers and preferred brands that disclosed clinical trial data. Demand shifted toward novel proteins, such as insect meal, which addressed sustainability concerns.
Premiumization Elevates Spend on Wellness Products
Annual spending on pets in the United States increased from USD 123.6 billion in 2021 to USD 151.9 billion in 2024, surpassing inflation and demonstrating higher price elasticity in the premium segment [2]Source: American Pet Products Association, "Total U.S. Pet Industry Expenditures," americanpetproducts.org. This growth reflects rising consumer demand for high-quality, health-focused pet products. Veterinarian-endorsed joint chews are priced significantly higher than generic multivitamins, yet they continue to achieve strong sales due to their perceived quasi-pharmaceutical value and targeted health benefits. Innovations in bioavailability, such as liposomal delivery and time-release matrices adapted from human nutraceuticals, justify higher price points and contribute to margin growth. These advancements enhance the effectiveness of supplements, making them more appealing to consumers. Additionally, clinical evidence and transparent sourcing further drive the premium segment's sustained growth, as consumers increasingly prioritize scientifically backed, ethically produced products for their pets.
Veterinary Clinic Data Analytics Enabling Personalized Nutraceutical Regimens
Cloud-based practice management systems integrating lab results and wearable data have gained notable adoption. These platforms leverage machine learning to provide personalized supplement protocols tailored to specific factors such as breed, age, and biomarker trends. These systems often offer greater value than standard products. The use of continuous biomarker monitoring enables the creation of feedback loops that refine dosage and formulation over time, strengthening customer loyalty and building a robust data-driven competitive advantage that is challenging for competitors to replicate.
Restraints Impact Analysis*
| Restraint | (~) % Impact on CAGR Forecast | Geographic Relevance | Impact Timeline |
|---|---|---|---|
| Fragmented regulatory definitions across regions | -0.9% | United States, European Union, and Asia-Pacific | Long term (≥ 4 years) |
| Premium pricing limits uptake in developing markets | -0.7% | India, Southeast Asia, South America, and Africa | Medium term (2-4 years) |
| Shelf-life instability in probiotic soft chews | -0.6% | Peru, China, and global supply chain | Medium term (2-4 years) |
| Raw-material cost volatility | -0.5% | Warm-climate markets worldwide | Short term (≤ 2 years) |
| Source: Mordor Intelligence | |||
Fragmented Regulatory Definitions Across Regions
The Federal Food, Drug, and Cosmetic Act in the United States permits structure-function claims but prohibits disease claims unless approved as drugs. This regulation ensures that products making health-related claims are thoroughly evaluated for safety and efficacy before reaching consumers. It also provides a framework for manufacturers to market their products while maintaining compliance with federal standards. In contrast, the European Union Regulation 767/2009 mandates pre-market dossiers, a process that can take up to 24 months [3]Source: European Food Safety Authority, “Pet Food Additives under Regulation 767/2009,” efsa.europa.eu. The Asia-Pacific region presents a more diverse regulatory landscape: Japan requires specific functional labeling, China enforces product registration, and India classifies supplements as a subcategory of feed, offering limited guidance on novel bioactives. Manufacturers managing parallel formulations incur compliance costs, which can delay international product launch timelines.
Premium Pricing Limits Uptake in Developing Markets
In developing markets, the high cost of premium pet nutraceuticals limits their widespread adoption, highlighting a disparity between the growing "pet humanization" trend and consumers' purchasing capacity. In 2025, the average spending per person on pets in India was significantly lower than in the United States, which limits the adoption of supplements priced in the monthly range considered relatively high. In Southeast Asia, a majority of pet owners prioritize essential nutrition over wellness-focused products. Similarly, in South America, households with moderate incomes allocate a small share of their budgets to pet care. Smaller packaging formats with lower price points are gaining popularity, but they reduce profit margins and weaken the perception of premium positioning.
*Our updated forecasts treat driver/restraint impacts as directional, not additive. The revised impact forecasts reflect baseline growth, mix effects, and variable interactions.
Segment Analysis
By Sub Product: Vitamins and Minerals Dominate the Market
Vitamins and minerals are the largest sub-product segment, accounting for 26.9% of the pet nutraceuticals market share in 2025 and forecast to rise at an 8.5% CAGR through 2031, benefiting from veterinarian adoption in senior-pet wellness plans. Multivitamins rich in B-complex and chelated zinc serve as first-step interventions for owners entering the category, often bundled with glucosamine to widen efficacy perceptions. Omega-3 fatty acids sourced from fish and algae support inflammatory and cardiac conditions, though raw-material volatility pressures gross margins. Proteins and peptides, notably collagen hydrolysates, support joint integrity, while milk bioactives, such as lactoferrin, appeal to breeders prioritizing immunity.
Probiotics are in growing demand due to increasing clinical evidence of strain-specific digestive and behavioral outcomes. Guaranteed colony-forming unit counts between 1 and 10 billion per dose differentiate premium labels, such as Nutramax Laboratories, Inc.s’ offerings. Encapsulation advances that extend shelf life to 24 months mitigate a key restraint, and veterinarian endorsements elevate credibility. Specialized herbals like turmeric and ashwagandha fill functional gaps in multi-condition soft chews, broadening the pet nutraceuticals market.
Note: Segment shares of all individual segments available upon report purchase
Get Detailed Market Forecasts at the Most Granular Levels
Download PDF
By Pets: Dogs Dominate Spend, Cats Outpace Growth
Dogs are the largest pet type and accounted for 58.1% of the pet nutraceuticals market size in 2025, driven by higher body weight and a greater incidence of osteoarthritis in large breeds such as Labrador Retrievers and German Shepherds. Mobility chews with glucosamine, chondroitin, and omega-3 oils remain staples, while behavioral supplements featuring L-theanine address urban separation anxiety that affects a significant number of dogs.
Cats exhibit the fastest growth trajectory, with an 8.9% CAGR through 2031. Species-specific formulations meet unique nutritional requirements, like taurine and arachidonic acid, that felines cannot synthesize. Urinary tract and renal support chews combine cranberry extract and omega-3 fatty acids to address chronic kidney concerns prevalent in older cats. The introduction of palatable soft-chew formats is reducing dosing friction and expanding the addressable feline base in the pet nutraceuticals market.
By Distribution Channel: Online Channel Reshape Retail
The online channel is the largest distribution channel, accounting for 27.5% of the pet nutraceuticals market share in 2025 and advancing fastest at an 8.8% CAGR through 2031, reshaping the pet nutraceuticals market through data-driven personalization and subscription economics. Platforms such as Chewy and Amazon profile purchase history to recommend bundles, lifting average order value. Direct-to-consumer brands bypass retailer markups that can exceed 50%, redirecting savings into formulation improvements and customer acquisition, thereby further expanding their market share in pet nutraceuticals.
Specialty stores, including independent retailers and chains such as Petco and PetSmart, benefit from in-store veterinary consultants and product sampling, which encourage the adoption of premium products. Their curated assortments build trust, particularly among first-time buyers seeking advice on condition-specific products. Supermarkets and hypermarkets cater to price-sensitive consumers with mass-market multivitamins and basic joint supplements. Their market share is declining as consumers shift to channels offering wider assortments and subscription-based convenience. Convenience stores and other outlets, such as veterinary clinics and farm supply stores, address residual demand. Veterinary clinics, in particular, play a significant role in the sales of prescription-like supplements through veterinarians' endorsements.
Note: Segment shares of all individual segments available upon report purchase
Get Detailed Market Forecasts at the Most Granular Levels
Download PDF
Geography Analysis
North America is the largest geography and accounted for 40.9% of the pet nutraceuticals market share in 2025, as high clinic density, permissive labeling rules from the Food and Drug Administration, and elevated disposable income drove supplement penetration. Canada adds incremental upside through bilingual packaging mandates that favor transparent ingredient lists, while Mexico leverages a growing middle class to lift baseline multivitamin demand. The high density of veterinary clinics in North America enables professional recommendations, significantly increasing supplement adoption rates compared to regions with limited veterinary access.
Africa is forecast to grow at a 10.2% pace through 2031, as rising middle-class populations in Nigeria, Kenya, and South Africa embrace premium pet care and leverage mobile commerce platforms to expand product access. Growing veterinary infrastructure, coupled with localization of e-commerce fulfillment centers, shortens delivery times and improves cold-chain integrity for heat-sensitive probiotics. Government initiatives that formalize feed and supplement regulations are also improving consumer confidence, accelerating the adoption of condition-specific products.
Europe experienced growth led by Germany, the United Kingdom, and France, driven by premiumization, organic certification, and clean-label initiatives. Regulation 767/2009 lengthens the time-to-market but signals quality, enabling compliant brands to charge premiums. Eastern European countries, including Poland, recorded faster growth amid rising urban pet ownership, although veterinary access remains limited and constrains the use of prescription-driven categories. The Asia-Pacific region is projected to experience growth, driven by countries such as China, Japan, Australia, and India, where pet humanization is gaining momentum among urban millennials and Gen Z. In 2024, China's Ministry of Agriculture and Rural Affairs introduced updated pet food regulations that define functional ingredient thresholds, reducing compliance uncertainties and encouraging multinational companies to enter the market. In Japan, the aging pet population is increasing the demand for joint and cognitive supplements, while Australia's high frequency of veterinary visits provides multiple opportunities for professional recommendations.
Get Analysis on Important Geographic Markets
Download PDF
Competitive Landscape
The pet nutraceuticals market remains moderately concentrated, with the top five companies, Mars, Incorporated, Vetoquinol SA (Soparfin SCA), Nestlé Purina PetCare Company (Nestlé S.A.), Alltech, Inc., and Archer Daniels Midland Company, collectively holding a significant market share in 2025. Mars, Incorporated and Nestlé Purina PetCare Company (Nestlé S.A.) bundle supplements with premium kibble to increase basket sizes, while Zoetis Inc. integrates diagnostic platforms that generate tailored dosing recommendations, creating switching costs for clinics. Ingredient giants such as Archer Daniels Midland Company and DSM-Firmenich AG are forward integrating into finished products, shrinking time-to-market for regional private labels.
Direct-to-consumer insurgents, notably PetHonesty, LLC (Vestar Capital Partners) and Wellness Pet Company (Clearlake Capital Group, L.P.), exploit subscription economics and influencer marketing to acquire customers at lower cost than traditional channels, commanding online share in the soft chews category. Their transparency ethos, posting third-party lab results, resonates with millennials and Generation Z, who distrust legacy brands. White-space opportunities include breed-specific formulations, microbiome-targeted probiotics, and innovative delivery formats such as transdermal patches and flavored water additives, which simplify administration for cats and small dogs. Technology is becoming a competitive differentiator, with veterinary analytics platforms facilitating personalized supplement protocols that traditional retail channels cannot provide, creating a competitive advantage that pure-play ingredient suppliers find challenging to replicate.
Intellectual property filings increased between 2023 and 2025, focusing on probiotic strain selection, encapsulation to enhance shelf life, and liposomal delivery methods to improve bioavailability. Regulatory compliance continues to pose a barrier to entry, as navigating frameworks such as those of the United States Food and Drug Administration (FDA), European Food Safety Authority (EFSA), and Asia-Pacific regions requires significant legal expertise and financial resources, favoring established companies. However, harmonization efforts under the Codex Alimentarius Commission may help reduce these challenges by 2028.
Pet Nutraceuticals Industry Leaders
-
Mars, Incorporated
-
Nestlé Purina PetCare Company (Nestlé S.A.)
-
Vetoquinol SA (Soparfin SCA)
-
Alltech, Inc.
-
Archer Daniels Midland Company
- *Disclaimer: Major Players sorted in no particular order
Need More Details on Market Players and Competitors?
Download PDF
Recent Industry Developments
- August 2025: Native Pet has introduced its Gutwell line of supplements for dogs, designed to support gut microbiome health and address specific concerns such as stress, skin irritation, and weight management. This product line is notable for its use of a triple-biotic blend of prebiotics, probiotics, and postbiotics delivered in a cold-pressed pellet format to maintain ingredient potency.
- April 2025: Fera Pets supplements have been introduced in over 175 Petco stores across the United States, representing the brand's initial expansion into brick-and-mortar retail. At select Petco Healthy Habit Hubs, customers can access various Fera supplements, including organic probiotics with prebiotics, organic mushroom blend for immune support, hip and joint Support, and sustainably sourced fish oil.
- February 2025: Doodlebone has introduced Nuri Vita Bites, a new range of soft-chew dog supplements, formulated in five targeted formulas to address specific health needs. This launch marks the brand's entry into the pet health and wellness market under the newly established Nuri brand umbrella.
- February 2025: Elanco Animal Health Incorporated has introduced Pet Protect, a new range of veterinarian-formulated, science-based supplements for dogs and cats. Responding to the increasing demand for proactive pet wellness, this product line includes options for hip and joint health, digestive health, skin care, and immune support.
Global Pet Nutraceuticals Market Report Scope
Pet nutraceuticals are functional nutritional products formulated for pets that provide health benefits beyond basic nutrition, supporting specific functions such as joint health, digestion, immunity, skin and coat condition, and overall wellness. They typically include ingredients such as omega-3 fatty acids, probiotics, vitamins, minerals, proteins, peptides, and bioactive compounds.
The pet nutraceuticals market report is segmented by sub product including milk bioactives, omega-3 fatty acids, probiotics, proteins and peptides, vitamins and minerals, and other nutraceuticals, by pets including cats, dogs, and other pets, by distribution channel including convenience stores, online channel, specialty stores, supermarkets/hypermarkets, and other channels, and by geography including North America, Europe, Asia-Pacific, South America, the Middle East, and Africa. The market forecasts are provided in terms of value in USD and volume in metric tons.
By Sub Product
| Milk Bioactives |
| Omega-3 Fatty Acids |
| Probiotics |
| Proteins and Peptides |
| Vitamins and Minerals |
| Other Nutraceuticals |
By Pets
| Cats |
| Dogs |
| Other Pets |
By Distribution Channel
| Convenience Stores |
| Online Channel |
| Specialty Stores |
| Supermarkets/Hypermarkets |
| Other Channels |
By Geography
| North America | Canada |
| Mexico | |
| United States | |
| Rest of North America | |
| Europe | France |
| Germany | |
| Italy | |
| Netherlands | |
| Poland | |
| Russia | |
| Spain | |
| United Kingdom | |
| Rest of Europe | |
| Asia-Pacific | Australia |
| China | |
| India | |
| Indonesia | |
| Japan | |
| Malaysia | |
| Philippines | |
| Taiwan | |
| Thailand | |
| Vietnam | |
| Rest of Asia-Pacific | |
| South America | Argentina |
| Brazil | |
| Rest of South America | |
| Middle East | Saudi Arabia |
| United Arab Emirates | |
| Turkey | |
| Rest of Saudi Arabia | |
| Africa | South Africa |
| Rest of Africa |
| By Sub Product | Milk Bioactives | |
| Omega-3 Fatty Acids | ||
| Probiotics | ||
| Proteins and Peptides | ||
| Vitamins and Minerals | ||
| Other Nutraceuticals | ||
| By Pets | Cats | |
| Dogs | ||
| Other Pets | ||
| By Distribution Channel | Convenience Stores | |
| Online Channel | ||
| Specialty Stores | ||
| Supermarkets/Hypermarkets | ||
| Other Channels | ||
| By Geography | North America | Canada |
| Mexico | ||
| United States | ||
| Rest of North America | ||
| Europe | France | |
| Germany | ||
| Italy | ||
| Netherlands | ||
| Poland | ||
| Russia | ||
| Spain | ||
| United Kingdom | ||
| Rest of Europe | ||
| Asia-Pacific | Australia | |
| China | ||
| India | ||
| Indonesia | ||
| Japan | ||
| Malaysia | ||
| Philippines | ||
| Taiwan | ||
| Thailand | ||
| Vietnam | ||
| Rest of Asia-Pacific | ||
| South America | Argentina | |
| Brazil | ||
| Rest of South America | ||
| Middle East | Saudi Arabia | |
| United Arab Emirates | ||
| Turkey | ||
| Rest of Saudi Arabia | ||
| Africa | South Africa | |
| Rest of Africa | ||
Need A Different Region or Segment?
Customize Now
Market Definition
- FUNCTIONS - Pet foods are usually intended to provide complete and balanced nutrition to the pet but are primarily used as functional products. The scope includes the food and supplements consumed by pets including veterinary diets. Supplements/nutraceuticals that are directly supplied to pets are considered within the scope.
- RESELLERS - Companies engaged in reselling of pet food without value addition have been excluded from the market scope, in order to avoid double counting.
- END CONSUMERS - Pet owners are considered to be the end-consumers in the market studied.
- DISTRIBUTION CHANNELS - Supermarkets/hypermarkets, specialty stores, convenience stores, online channels and other channels are considered within the scope. The stores which are exclusively providing pet related basic and custom products are considered within the scope of specialty stores.
| Keyword | Definition |
|---|---|
| Pet Food | The scope of pet food includes the food that is eatable by pets including food, treats, veterinary diets, and nutraceuticals/supplements. |
| Food | Food is animal feed intended for consumption by pets. It is formulated to provide essential nutrients and meet the dietary needs of various types of pets, including dogs, cats, and other animals. These are generally segmented into dry and wet pet foods. |
| Dry Pet Food | Dry pet foods may be extruded/baked (kibbles) or flaked. They have a lower moisture content, typically around 12-20%. |
| Wet Pet Food | Wet pet food, also known as canned pet food or moist pet food, generally has a higher moisture content compared to dry pet food, often ranging from 70-80%. |
| Kibbles | Kibbles are dry, processed pet food in small, bite-sized pieces or pellets. They are specifically formulated to provide balanced nutrition for various domestic animals, such as dogs, cats, and other animals. |
| Treats | Pet Treats are special food items or rewards given to pets, to show affection, and encourage good behavior. They are especially used during training. Pet treats are made from various combinations of meat or meat-derived materials with other ingredients. |
| Dental Treats | Pet dental treats are specialized treats that are formulated to promote good oral hygiene in pets. |
| Crunchy Treats | It is a type of pet treat that has a firm and crispy texture which can be a good source of nutrition for pets. |
| Soft and chewy treats | Soft and Chewy pet treats are a type of pet food product that is formulated to be easy to chewy and digest. They are usually made from soft and pliable ingredients, such as meat, poultry, or vegetables, that have been blended and formed into bite-sized pieces or strips. |
| Freeze-dried & Jerky Treats | Freeze-dried and jerky treats are snacks given to pets, that are prepared through a special preservation process, without damaging the nutritional content, resulting in long-lasting, nutrient-rich treats. |
| Urinary Tract Disease Diets | These are commercial diets that are specifically formulated to promote urinary health and reduce the risk of urinary tract infections and other urinary problems. |
| Renal Diets | These are specialized pet foods formulated to support the health of pets with kidney disease or renal insufficiency. |
| Digestive Sensitivity Diets | Digestive-sensitive diets are specially formulated to meet the nutritional needs of pets with digestive issues such as food intolerances, allergies, and sensitivities. These diets are designed to be easily digestible and to reduce the symptoms of digestive problems in pets. |
| Oral Care Diets | Oral care diets for pets are specially formulated diets produced to promote oral health and hygiene in pets. |
| Grain-Free Pet Food | Pet food that does not contain common grains like wheat, corn, or soy. Grain-free diets are often preferred by pet owners seeking alternative options or if their pets have specific dietary sensitivities. |
| Premium Pet Food | High-quality pet food formulated with superior ingredients often offers additional nutritional benefits compared to standard pet food. |
| Natural Pet Food | Pet food made from natural ingredients, with minimal processing and without artificial preservatives. |
| Organic Pet Food | Pet food is produced using organic ingredients, free from synthetic pesticides, hormones, and genetically modified organisms (GMOs). |
| Extrusion | A manufacturing process used to produce dry pet food, where ingredients are cooked, mixed, and shaped under high pressure and temperature. |
| Other Pets | Other pets include birds, fish, rabbits, hamsters, ferrets, and reptiles. |
| Palatability | The taste, texture, and aroma of pet food influence its appeal and acceptance by pets. |
| Complete and Balanced Pet Food | Pet food that provides all essential nutrients in appropriate proportions to meet the nutritional needs of pets without additional supplementation. |
| Preservatives | These are the substances that are added to pet food to extend its shelf life and prevent spoilage. |
| Nutraceuticals | Food products that offer health benefits beyond basic nutrition, often contain bioactive compounds with potential therapeutic effects. |
| Probiotics | Live beneficial bacteria that promote a healthy balance of gut flora, supporting digestive health and immune function in pets. |
| Antioxidants | Compounds that help neutralize harmful free radicals in the body, promoting cellular health and supporting the immune system in pets. |
| Shelf-Life | The duration of which pet food remains safe and nutritionally viable for consumption after its production date. |
| Prescription diet | Specialized pet food formulated to address specific medical conditions under veterinary supervision. |
| Allergen | A substance that can cause allergic reactions in some pets, leading to food allergies or sensitivities. |
| Canned food | Wet pet food that is packed in cans and contains higher moisture content than dry food. |
| Limited ingredient diet (LID) | Pet food formulated with a reduced number of ingredients to minimize potential allergens. |
| Guaranteed Analysis | The minimum or maximum levels of certain nutrients present in pet food. |
| Weight management | Pet food designed to help pets maintain a healthy weight or support weight loss efforts. |
| Other Nutraceuticals | It includes prebiotics, antioxidants, digestive fiber, enzymes, essential oils and herbs. |
| Other Veterinary Diets | It includes weight management diets, skin and coat health, cardiac care, and joint care. |
| Other Treats | It includes rawhides, mineral blocks, lickables, and catnips. |
| Other Dry Foods | It includes cereal flakes, mixers, meal toppers, freeze-dried foods, and air-dried foods. |
| Other Animals | It includes birds, fish, reptiles, and small animals (rabbits, ferrets, hamsters). |
| Other Distribution Channels | It includes veterinary clinics, local unregulated stores, and feed and farm stores. |
| Proteins and Peptides | Proteins are large molecules composed of basic units called amino acids which help in the growth and development of pets. Peptides are the short string of 2 to 50 amino acids. |
| Omega-3 fatty acids | Omega-3 fatty acids are essential polyunsaturated fats that play a crucial role in the overall health and well-being of Pets |
| Vitamins | Vitamins are the essential organic compounds that are essential for vital physiological functioning. |
| Minerals | Minerals are naturally occurring inorganic substances that are essential for various physiological functions in pets. |
| CKD | Chronic Kidney Disease |
| DHA | Docosahexaenoic Acid |
| EPA | Eicosapentaenoic Acid |
| ALA | Alpha-linolenic Acid |
| BHA | Butylated Hydroxyanisol |
| BHT | Butylated Hydroxytoluene |
| FLUTD | Feline Lower Urinary Tract Disease |
Need More Details on Market Definition?
Ask a Question
Research Methodology
Mordor Intelligence follows a four-step methodology in all our reports.
- Step-1: IDENTIFY KEY VARIABLES: In order to build a robust forecasting methodology, the variables and factors identified in Step-1 are tested against available historical market numbers. Through an iterative process, the variables required for market forecast are set and the model is built on the basis of these variables.
- Step-2: Build a Market Model: Market-size estimations for the forecast years are in nominal terms. Inflation is not a part of the pricing, and the average selling price (ASP) is kept constant throughout the forecast period.
- Step-3: Validate and Finalize: In this important step, all market numbers, variables and analyst calls are validated through an extensive network of primary research experts from the market studied. The respondents are selected across levels and functions to generate a holistic picture of the market studied.
- Step-4: Research Outputs: Syndicated Reports, Custom Consulting Assignments, Databases & Subscription Platforms

Get More Details On Research Methodology
Download PDF


