
Personal-Use Glucometer Device Market Size and Share
Market Overview
| Study Period | 2020 - 2031 |
|---|---|
| Market Size (2026) | USD 4.69 Billion |
| Market Size (2031) | USD 6.48 Billion |
| Growth Rate (2026 - 2031) | 6.66 % |
| Fastest Growing Market | Asia Pacific |
| Largest Market | North America |
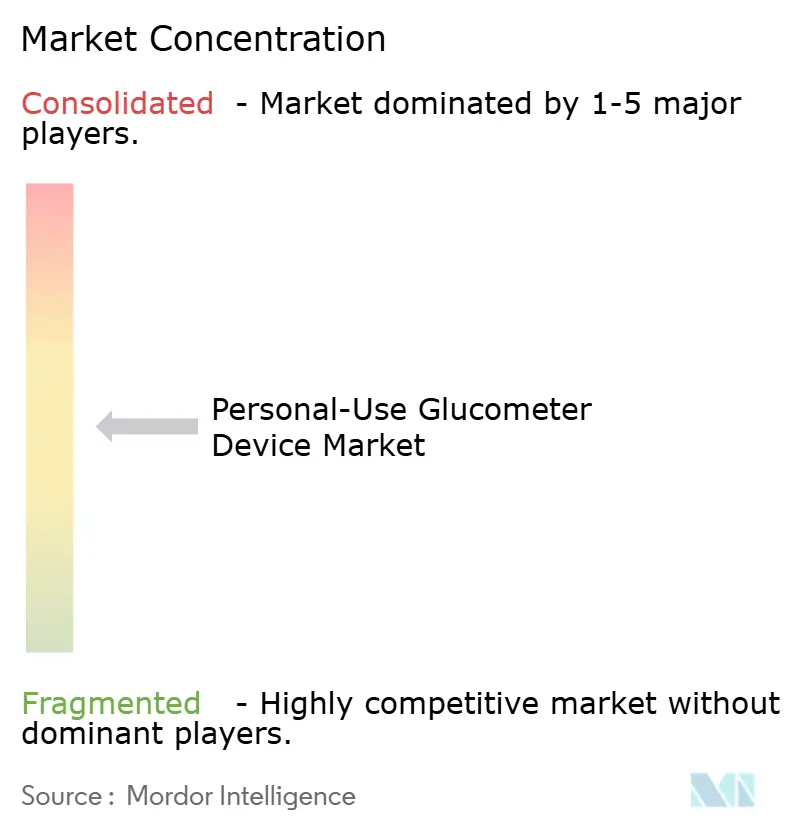
| Market Concentration | Medium |
Major Players *Disclaimer: Major Players sorted in no particular order Image © Mordor Intelligence. Reuse requires attribution under CC BY 4.0. | |
Personal-Use Glucometer Device Market Analysis by Mordor Intelligence
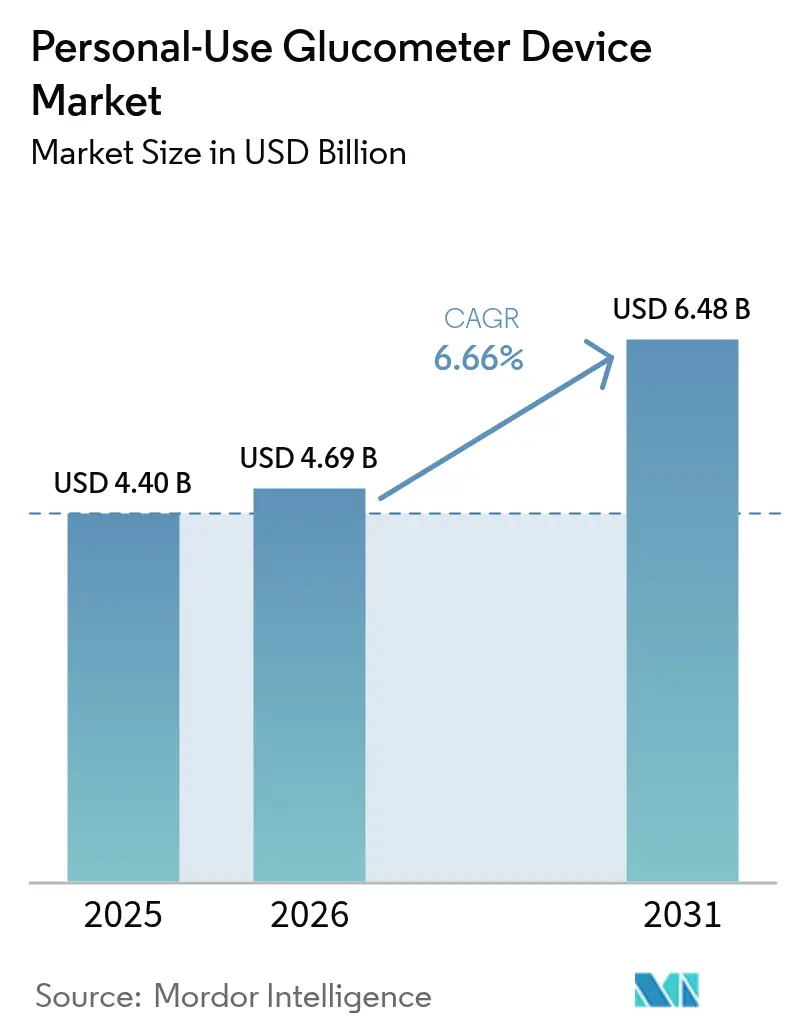
The personal-use glucometer devices market size in 2026 is estimated at USD 4.69 billion, growing from 2025 value of USD 4.40 billion with 2031 projections showing USD 6.48 billion, growing at 6.66% CAGR over 2026-2031. The expansion reflects the compound effect of rising diabetes prevalence, population aging, and steady reimbursement gains for connected meters. Continuous sensor innovation, smartphone integration, and over-the-counter (OTC) clearances broaden the addressable base beyond insulin-dependent patients, while real-time analytics improve therapeutic decision-making. Growth also benefits from expanding wellness adoption among non-diabetic consumers and sustained venture funding that accelerates miniaturized, low-power designs. Competitive intensity remains moderate but is sharpening as scale players link glucose data with automated insulin delivery, digital coaching, and generative AI platforms.
Key Report Takeaways
- By component, test strips led with 64.62% of personal-use glucometer devices market share in 2025, whereas glucometer devices are set to post the fastest 8.96% CAGR to 2031.
- By technology, self-monitoring blood glucose accounted for 34.98% revenue share in 2025, while continuous glucose monitoring is poised to rise at a 12.06% CAGR.
- By connectivity, Bluetooth commanded 43.25% revenue share in 2025; near-field communication is projected to climb at an 10.98% CAGR through 2031.
- By end-user, the home-care segment represented 88.15% of industry revenue in 2025, while sports and wellness users are forecast to expand at 11.31% CAGR.
- By geography, North America held 42.10% revenue share in 2025, yet Asia-Pacific is on track for the quickest 12.28% CAGR to 2031.
Note: Market size and forecast figures in this report are generated using Mordor Intelligence’s proprietary estimation framework, updated with the latest available data and insights as of 2026.
Global Personal-Use Glucometer Device Market Trends and Insights
Drivers Impact Analysis*
| Driver | (~) % Impact on CAGR Forecast | Geographic Relevance | Impact Timeline |
|---|---|---|---|
| Rising Diabetes Prevalence & Ageing Population | +1.8% | Global, with highest impact in APAC and MEA | Long term (≥ 4 years) |
| Smartphone-Linked Smart Meters Gain Reimbursement Traction | +1.2% | North America & EU, expanding to APAC | Medium term (2-4 years) |
| Expansion Of Continuous & Flash GM Into Type-2 Pre-Diabetes | +1.5% | Global, led by developed markets | Medium term (2-4 years) |
| OTC Approval Of Non-Invasive Optical Meters | +0.9% | North America & EU regulatory frameworks | Short term (≤ 2 years) |
| Wellness Wearables Drive Adoption By Non-Diabetics | +0.8% | Global, concentrated in urban centers | Short term (≤ 2 years) |
| Source: Mordor Intelligence | |||
Rising Diabetes Prevalence & Ageing Population
Global diabetes prevalence could exceed 783.2 million by 2045, creating sustained demand for easy-to-use monitors[3]. The burden is pronounced in Asia-Pacific, where China already records a 13.67% prevalence and faces a projected 29.1% rate by 2050. Older adults need simplified interfaces, larger displays, and dependable connectivity, prompting manufacturers to refine ergonomy and voice-guided prompts. Combined demographic and disease pressures ensure that the personal-use glucometer devices marketcontinues expanding even in reimbursement-constrained settings. The sheer volume of potential users underpins long-run volume growth that can absorb price erosion.
Smartphone-Linked Smart Meters Gain Reimbursement Traction
Medicare aligned coverage rules with ADA guidance in 2023, waiving finger-stick confirmation and adding basal-only Type 2 patients, thereby subsidizing 80% of approved CGM system costs[2]. Commercial payers quickly followed, citing documented A1c reductions and reduced hypoglycemia events. In Europe, Norway and Belgium introduced national funding for sensor-based monitors, while additional markets evaluate similar moves. Reimbursement cuts out-of-pocket cost, fostering mainstream adoption and enabling vendors to bundle smartphones, apps, and cloud portals. As insurers link sensor data with population-health analytics, reimbursement remains a decisive pull factor for the personal-use glucometer devices market.
Expansion of Continuous & Flash GM Into Type-2 Pre-Diabetes
Clinical trials show continuous monitoring reduces HbA1c even in non-insulin Type 2 cohorts, supporting coverage expansion and primary-care uptake. Public health authorities now study cost-effectiveness findings that place CGM within accepted willingness-to-pay thresholds for basal-only users. Pre-diabetic and wellness users number near 720 million globally, representing an untapped market for early metabolic feedback. Consumer platforms such as Ultrahuman demonstrate how lifestyle analytics motivate dietary adjustments among healthy individuals. These dynamics pull continuous sensors deeper into primary prevention, broadening the commercial base for the personal-use glucometer devices market.
OTC Approval of Non-Invasive Optical Meters
The FDA cleared Dexcom’s Stelo and Abbott’s Lingo as the first OTC CGMs in 2024, erasing prescription barriers[1]. Device makers now sell directly through pharmacies and e-commerce, reaching early stage diabetics and wellness consumers. Optical sensing studies show Raman-based prototypes hitting 12.8% MARD, approaching clinical-grade accuracy. OTC access reshapes marketing, emphasizes intuitive apps, and supports subscription revenue. Rapid consumer uptake accelerates data volumes, enabling personalized coaching and fueling competitive pressure across the personal-use glucometer devices market.
Restraints Impact Analysis*
| Restraint | (~) % Impact on CAGR Forecast | Geographic Relevance | Impact Timeline |
|---|---|---|---|
| High Lifetime Cost Of Consumables (Strips / Sensors) | -1.4% | Global, most acute in emerging markets | Long term (≥ 4 years) |
| Accuracy Gaps Vs. Lab Reference In Tropical Climates | -0.8% | Tropical regions, APAC, MEA, South America | Medium term (2-4 years) |
| Cyber-Security & Data-Privacy Regulations Tighten | -0.6% | Global, led by North America & EU enforcement | Short term (≤ 2 years) |
| Source: Mordor Intelligence | |||
High Lifetime Cost of Consumables (Strips / Sensors)
Annual CGM ownership ranges between USD 1,200 and USD 3,600, while 100-count strip boxes retail from USD 35 to USD 170, squeezing uninsured and low-income users. Even Dexcom’s value-priced Stelo still averages USD 100 per month. Surveys across six developing countries confirm affordability gaps that dampen sustained monitoring adherence. Manufacturers respond with longer-life sensors and bundle discounts, yet volume-driven cost declines remain gradual. Without broader subsidies, consumable burden continues to temper uptake in price-sensitive segments of the personal-use glucometer devices market.
Accuracy Gaps vs. Lab Reference in Tropical Climates
Heat and humidity can induce up to 30.1% error within minutes, undermining clinical confidence in warm regions. Hospital studies in Thailand and the Philippines report systematic variance during monsoon months, forcing labor-intensive stress testing. Strip enzymes degrade under oscillating temperature cycles, while sensor membranes suffer moisture intrusion. Vendors are redesigning packaging and electronic shielding, yet field reliability lags lab benchmarks. Persistent accuracy concerns slow guideline endorsement and constrain the personal-use glucometer devices market in equatorial economies.
*Our forecasts treat driver/restraint impacts as directional, not additive. The impact forecasts reflect baseline growth, mix effects, and variable interactions.
Segment Analysis
By Component: Consumables Continue to Anchor Revenue
Test strips captured 64.62% of the personal-use glucometer devices market in 2025, preserving a high-margin replenishment stream that underwrites manufacturer cash flows. Devices, however, are registering the quickest 8.96% CAGR as users pivot to integrated, sensor-rich platforms that lower per-reading cost over time. Longer wear sensors such as Dexcom G7 15-Day demonstrate how hardware upgrades decrease monthly spend and improve convenience. Accessories—from lancet drums to smartphone cradles—command modest but rising revenue as connectivity and comfort influence brand choice.
Glucometer innovation now targets single-platform ecosystems that pair proprietary sensors with AI-driven apps. Abbott’s FreeStyle Libre 2 Plus, the first U.S. CGM to link directly with automated insulin delivery, illustrates the hardware-software convergence reshaping the personal-use glucometer devices market. Vendors also trial reusable optical readers designed to leverage strip-free photonics, potentially compressing consumable demand. While strips remain dominant, incremental sensor advances steadily shift revenue weight toward durable equipment and cloud subscriptions.


By Technology: Continuous Monitoring Disrupts SMBG Hegemony
Self-monitoring blood glucose still holds 34.98% share, anchored by affordability and clinician familiarity. Nevertheless, continuous sensors are outpacing at 12.06% CAGR because real-time trend data reduce hypoglycemia risk and support dose titration. Randomized studies in primary care show CGM users achieving HbA1c drops of 1.3 percentage points versus 0.8 points for finger-stick cohorts. Non-invasive optical prototypes demonstrate accelerating accuracy gains, aided by machine-learning spectroscopic algorithms.
Technology suppliers bundle sensors with telehealth dashboards, broadening clinical oversight and unlocking insurer value-based payments. Medtronic’s Simplera disposable CGM, half the size of its predecessor, shows how form-factor reductions drive comfort and adoption. As reimbursement spreads and component costs fall, CGM looks set to erode SMBG leadership across the personal-use glucometer devices market.
By Connectivity: Bluetooth Reigns While NFC Accelerates
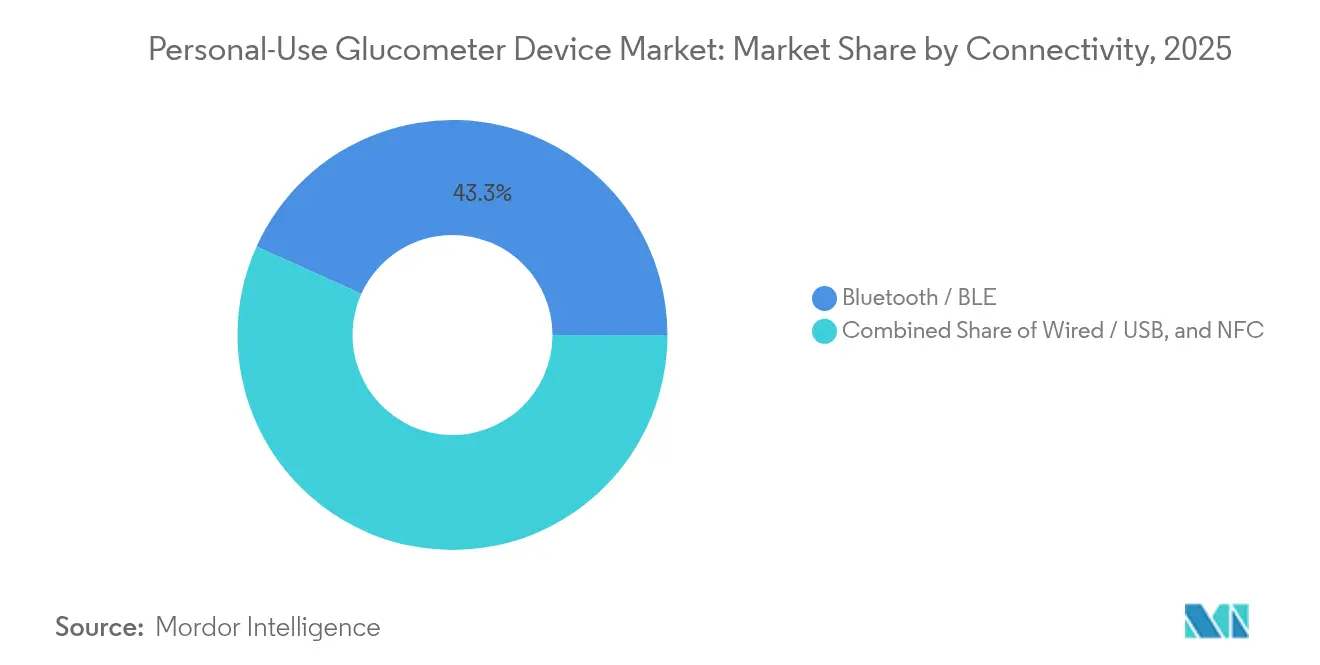
Bluetooth retained 43.25% revenue share in 2025, benefitting from universal smartphone support and established pairing stacks. Near-field communication, however, is projected to grow 10.98% annually because it permits tap-to-scan uploads without user configuration. NFC chips also consume less power, extending sensor life and fostering fully disposable designs. USB and proprietary cables linger for clinical download stations but fade in consumer channels.
Connectivity now underpins analytics differentiation. Dexcom recently launched the first glucose biosensing generative-AI platform on Google Vertex AI, a move that demands stable, low-latency data links. NFC’s simplicity supports elderly users and emerging-market customers who rely on entry-level Android phones, expanding penetration of the personal-use glucometer devices market.
By End-User: Home-Care Dominates Yet Wellness Surges
Home-care applications represented 88.15% of revenue in 2025, reflecting the day-to-day nature of diabetes self-management. Retail OTC approvals now allow walk-in purchase, bolstering household adoption. Simultaneously, sports and wellness users are forecast for an 11.31% CAGR as athletes and weight-loss seekers adopt CGMs to fine-tune diet and training. A multi-armed study on non-diabetic Indians using Ultrahuman’s platform illustrated how real-time glucose curves encourage healthier meal choices.
Mainstream media coverage has normalized CGM for metabolic awareness, though data literacy gaps persist. Manufacturers counter by embedding color-coded insights and automated food logging. Wellness adoption thus diversifies revenue and creates a preventive front door for the personal-use glucometer devices market.
Geography Analysis
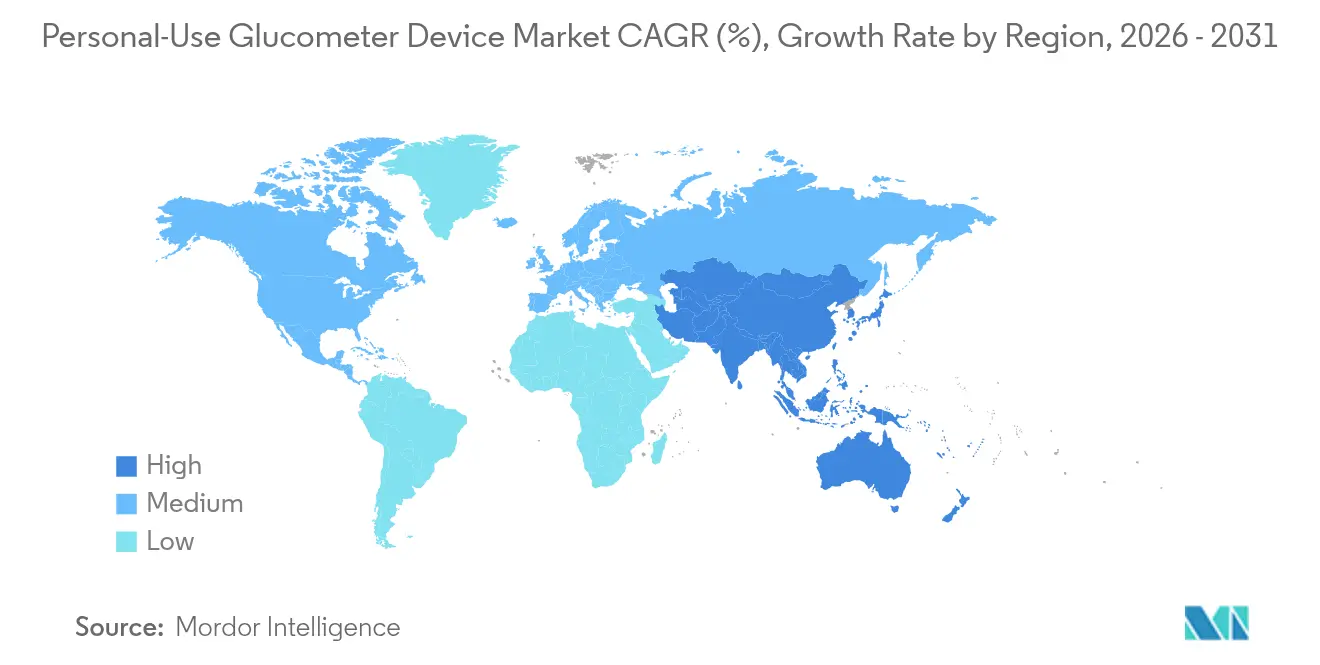
North America led the personal-use glucometer devices market with 42.10% revenue share in 2025 on the back of payer funding, early tech uptake, and robust distribution networks. Medicare’s expanded coverage and successive private-payer updates have widened eligibility for continuous sensors, spurring double-digit unit growth. The U.S. FDA’s friendly stance toward OTC clearances further enlarges the consumer funnel and shortens go-to-market cycles. Canada mirrors these trends, advancing national reimbursement pilots for flash sensors.
Asia-Pacific is projected to log a 12.28% CAGR through 2031 as high prevalence converges with rising middle-class disposable income. China’s digital health programs demonstrate that integrated platforms can trim fasting glucose by 1.68% and HbA1c by 0.45 points among engaged users. India’s uptake of point-of-care HbA1c screening, with an ICUR of just USD 185.10/QALY in rural settings, underscores economic viability. Government initiatives to localize sensor assembly are also likely to shrink end-user prices, fuelling further expansion of the personal-use glucometer devices market.
Europe maintains stable mid-single-digit growth, underpinned by national funding steps such as Norway’s 2023 decision to reimburse sensor-based monitors. The EU’s Medical Device Regulation harmonizes safety benchmarks, favoring firms with rigorous quality systems. Meanwhile, Latin America and Middle East-Africa show rising incidence but adoption lags due to cost and limited payer coverage. Nevertheless, philanthropic procurement and telehealth pilots in Gulf Cooperation Council states foreshadow incremental upside.
Regulatory Landscape
Personal-use glucometer devices are typically regulated as in vitro diagnostic (IVD) systems, with market access shaped by jurisdiction-specific performance and quality expectations. In the United States, the FDA has an established framework for over-the-counter self-monitoring blood glucose (SMBG) test systems, including guidance that emphasizes lay-user study design and robust accuracy performance for OTC use, often treated as more stringent than the ISO 15197:2013 baseline used in many international tenders and procurement programs.
In Europe, conformity assessment is handled under Regulation (EU) 2017/746 (IVDR) for IVDs, supported by Medical Device Coordination Group (MDCG) guidance that can affect borderline classification and evidence expectations. China requires NMPA registration for self-monitoring blood glucose systems (meters, strips, and control solutions), with performance aligned to national standards (for example, GB/T 19634), and it has published more specific technical review guidance for emerging non-invasive monitoring approaches. Across markets, regulators commonly require multi-lot evaluations and verification with intended lay users, which increases the need for strong design controls, labeling, and post-market quality systems for global launches.
Competitive Landscape
Competition centers on technology leadership, integrated ecosystems, and regulatory agility. Abbott, Dexcom, and Roche collectively anchor the top tier, each leveraging data platforms to lock in users. Abbott’s August 2024 agreement with Medtronic links FreeStyle Libre sensors with automated insulin pumps, broadening closed-loop care. Dexcom counters through AI-driven insight engines that personalize coaching and flag glycemic excursions in real time.
Mid-cap players pursue white-space. Glucotrack advanced an implantable monitor through first-in-human trials, potentially eliminating external wearables. Tandem Diabetes Care signed a June 2025 pact with Abbott to incorporate dual glucose-ketone sensing into its automated delivery portfolio. Such alliances consolidate data streams, complicate entrant differentiation, and heighten switching costs in the personal-use glucometer devices market.
Regulatory standards raise technical hurdles. The May 2025 FDA rule (21 CFR 862.1355) codified accuracy and cybersecurity criteria for integrated systems, prompting heavy investment in quality assurance. Vendors that meet these bars gain first-mover market access, while laggards risk reimbursement exclusion. As platform convergence intensifies, channel leverage and data-analytics capability are expected to determine share shifts over the next five years.
Personal-Use Glucometer Device Industry Leaders
-
LifeScan Inc.
-
Arkray Inc.
-
Ascensia Diabetes Care Holdings AG
-
F. Hoffmann-La Roche AG
-
Abbott Laboratories
- *Disclaimer: Major Players sorted in no particular order
Market Opportunities and Future Outlook
OTC pathways and reimbursement broadening are creating new consumer and primary-care entry points, and product roadmaps increasingly emphasize ecosystem value (apps, coaching, and analytics) rather than standalone readings. The FDA clearances of Dexcom Stelo and Abbott Lingo as OTC CGMs in 2024 show how removing prescription barriers can change retail and e-commerce go-to-market models, which matters for personal-use SMBG vendors that bundle meters with smartphone apps and subscription-style services (for example, coaching linked to reading frequency and adherence).
Affordability and sustained adherence remain a concrete friction point. Recurring strip economics and high lifetime consumables cost continue to limit usage intensity in emerging markets and among uninsured populations. Efforts that standardize minimum performance and procurement expectations (for example, global access-focused initiatives discussed in 2026 access reports on glucose self-monitoring) create room for lower-cost, quality-assured meters and strips, localized supply chains, and simplified connectivity aimed at entry-level Android users. At the same time, competitive moves in adjacent glucose-monitoring ecosystems, including LifeScan partnering with i-SENS (announced February 2026) and Abbott receiving CE Mark for dual glucose-ketone sensing (May 2026), raise expectations for decision-support features and multi-parameter risk signaling. That increases the pressure on personal-use SMBG platforms to differentiate through usability, data interoperability, and privacy-by-design implementations as cybersecurity and data rules tighten.
Recent Industry Developments
- May 2026: Abbott received CE Mark for Libre Duo and Libre Duo 10 Day systems that continuously monitor both glucose and ketone levels. The move extends glucose monitoring into multi-analyte risk visibility for diabetic ketoacidosis management and broadens Abbott's addressable base in select European markets through planned launches later in 2026.
- February 2026: LifeScan announced a partnership with i-SENS to develop and launch a OneTouch continuous glucose monitoring system for Europe, with an early-2027 market entry plan. This partnership reflects a strategic push by a leading SMBG brand to complement its meter-and-strip franchise with connected sensor offerings and broader digital engagement.
- June 2024: Abbott secured US FDA clearance for Lingo, positioned as an over-the-counter continuous glucose monitor for diabetes and general wellness audiences. OTC clearance broadened retail access and strengthened the consumer-wellness channel as a meaningful commercialization route for glucose monitoring ecosystems.
Research Methodology Framework and Report Scope
Market Definition and Coverage
This market covers personal-use blood glucose monitoring done at home using finger-stick glucometers, together with the recurring consumables that make the test possible, mainly test strips and lancets, captured as market value in USD.
Scope exclusions: professional point-of-care analyzers used in clinics, and continuous or flash glucose monitoring systems are kept out of scope to avoid mixing different care settings and price structures.
Segmentation Overview
- By Component
- Glucometer Devices
- Test Strips
- Lancets
- Accessories
- By Technology
- SMBG (Capillary)
- Continuous Glucose Monitoring (Personal)
- Non-Invasive Optical Monitoring
- By Connectivity
- Wired / USB
- Bluetooth / BLE
- NFC
- By End-User
- Home-Care / Personal
- Sports & Wellness Users
- Geography
- North America
- United States
- Canada
- Mexico
- Europe
- Germany
- United Kingdom
- France
- Italy
- Spain
- Rest of Europe
- Asia-Pacific
- China
- Japan
- India
- South Korea
- Australia
- Rest of Asia-Pacific
- Middle East and Africa
- GCC
- South Africa
- Rest of Middle East and Africa
- South America
- Brazil
- Argentina
- Rest of South America
- North America
Data Sources, Market Sizing, and Validation
Desk Research
Desk research starts with building the demand and supply context that a home-use glucometer market depends on, before any market math is done. We refer to public health and population signals, such as diabetes prevalence and treated population data from sources like the World Health Organization, the International Diabetes Federation, and national health agencies such as the CDC.
To anchor the device and consumables flow, we also review trade and customs statistics for relevant diagnostic and medical device categories, along with regulatory and product information from sources such as the US FDA and the European Commission websites. Pricing context is checked using company filings, annual reports, investor presentations, and reputable press coverage, then cross-checked using paid subscriptions focused on company financials and news, patent databases, and shipment-level import and export data where it helps. These desk sources are not exhaustive, and many other public references were used to collect data, validate assumptions, and clarify open questions.
Primary Interviews and Surveys
Primary work is used to test what we think we know from public sources, focusing on average selling price ranges, channel margins, and the share of the home-testing pool that still uses standard glucometers versus shifting to adjacent technologies. We speak with device and consumables stakeholders, distributors and retail channels, and clinical and care pathway voices across APAC, EMEA, and the Americas, to ensure regional reimbursement and purchasing patterns are not missed.
Distribution of primary research fieldwork respondents
| Company type | Respondent position | Region |
|---|---|---|
| Top tier: 25% | CXOs: 15% | APAC: 43% |
| Mid tier: 60% | Functional/Unit leaders: 33% | EMEA: 30% |
| Smaller Players: 15% | Managers: 52% | Americas: 27% |
Market-Sizing & Forecasting
Sizing is built using a top-down demand pool approach where the diabetes population and self-monitoring adoption are translated into annual testing activity, then converted into value using device replacement and consumables consumption. Since market value is driven heavily by strips and lancets, the model tracks average tests per user, strip utilization per test, replacement cycles for meters, and the share of users buying through retail versus online channels, which can shift net realized prices.
After the first pass, totals are corroborated with selective bottom-up approximations, including checks of implied volumes against supplier and channel signals, and validation of price bands by region through interview feedback and public price points. Where data is thin for smaller countries, proxy assumptions are used from comparable markets based on prevalence, reimbursement intensity, and channel maturity, then adjusted after regional cross-checks.
Forecasts are developed using scenario analysis with a light multivariate regression overlay, where growth is tied to diabetes prevalence trends, penetration of home self-monitoring, average testing frequency, and price progression of strips and meters. Expert inputs help set realistic paths for pricing, including cases where promotions, tender-like retail programs, or reimbursement updates create step changes rather than smooth growth.
Data Validation & Update Cycle
Validation is handled through multiple checks that look for mismatches between demand indicators and implied volumes, then push the team back to re-check assumptions before sign-off. Outliers are reviewed by comparing regional results against independent signals, such as prevalence trends, device replacement behavior, and visible price moves in key markets, then we re-contact sources when a gap cannot be explained.
Reports are refreshed on an annual cycle, and interim updates are triggered when material events occur, such as policy changes affecting reimbursement, major regulatory actions, or sharp currency moves that can shift reported USD values. Before delivery, the latest information pass is done so the final model reflects the most recent inputs and corrections.
Mordor Intelligence's Global Personal Use Glucometer Device Market Sizing Compared With Other Published Estimates
Published market sizes for personal-use glucometers often do not match because the boundary between home finger-stick monitoring and adjacent glucose technologies is drawn differently, and because some estimates mix devices with broader diabetes management spending. Currency conversion timing also matters, since a global market reported in USD can change even when local volumes are steady.
A refresh-led difference is also common, where price assumptions for strips and meter replacement are updated at different points in the year, changing the implied value more than the implied usage. This study keeps pricing logic tied to current channel signals, then re-checks the USD conversion and regional splits during the annual update cycle, which is a key reason the latest market number aligns to 2026 in Mordor Intelligence.
Benchmark comparison
| Source | Market Size | Gaps in Research Methodology |
|---|---|---|
| Mordor Intelligence | USD 4.69 B (2026) | |
| Industry Publisher A | USD 6.72 B (2024) | Uses an earlier base year and a longer forecast window, and the scope appears broader, which can pull in adjacent monitoring approaches and inflate the consumables value per user when compared on a like-for-like home finger-stick basis. |
| Publisher B | USD 3.70 B (2025) | Uses a narrower home monitor framing and a different base year, and it likely treats test strips and lancets differently or applies lower average prices, which can reduce the total even if the user pool is similar. |
Taken together, the spread is mainly explained by timing and scope choices, followed by how strip pricing and replacement cycles are modeled across regions. By keeping inputs traceable to testing frequency, consumables consumption, and region-level price bands, the final number stays repeatable and easier to reconcile when assumptions are updated.
Key Questions Answered in the Report
What is the current size of the personal-use glucometer device market?
The market stands at USD 4.69 billion in 2026 and is projected to reach USD 6.48 billion by 2031.
Which component category generates the most revenue?
Test strips lead with 64.62% market share in 2025, anchoring recurring revenue.
How fast is continuous glucose monitoring (CGM) growing?
CGM is advancing at a 12.06% CAGR through 2031, the quickest pace among technology segments.
Which region is expanding the fastest?
Asia-Pacific is forecast to grow at a 12.28% CAGR on the back of rising diabetes prevalence and healthcare investments.
What recent regulatory move is boosting consumer adoption?
The FDA’s 2024 OTC clearance of devices like Dexcom’s Stelo and Abbott’s Lingo removed prescription barriers and widened access.