
Pension Funds Market Size and Share
Market Overview
| Study Period | 2020 - 2031 |
|---|---|
| Market Size (2026) | USD 70.89 Trillion |
| Market Size (2031) | USD 92.83 Trillion |
| Growth Rate (2026 - 2031) | 5.55 % |
| Fastest Growing Market | Asia Pacific |
| Largest Market | North America |
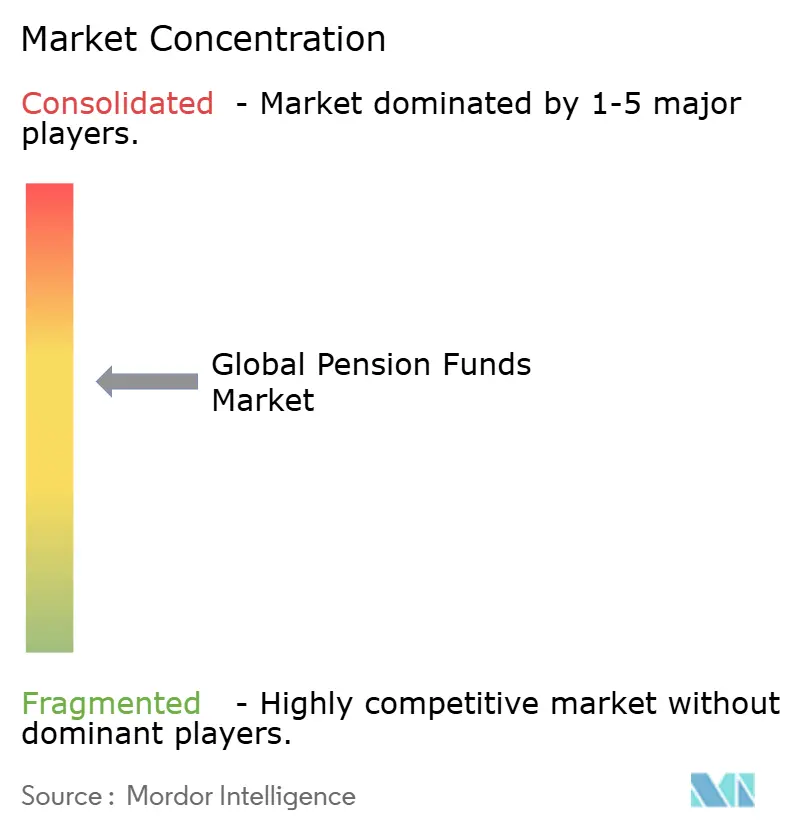
| Market Concentration | Medium |
Major Players *Disclaimer: Major Players sorted in no particular order Image © Mordor Intelligence. Reuse requires attribution under CC BY 4.0. | |
Pension Funds Market Analysis by Mordor Intelligence
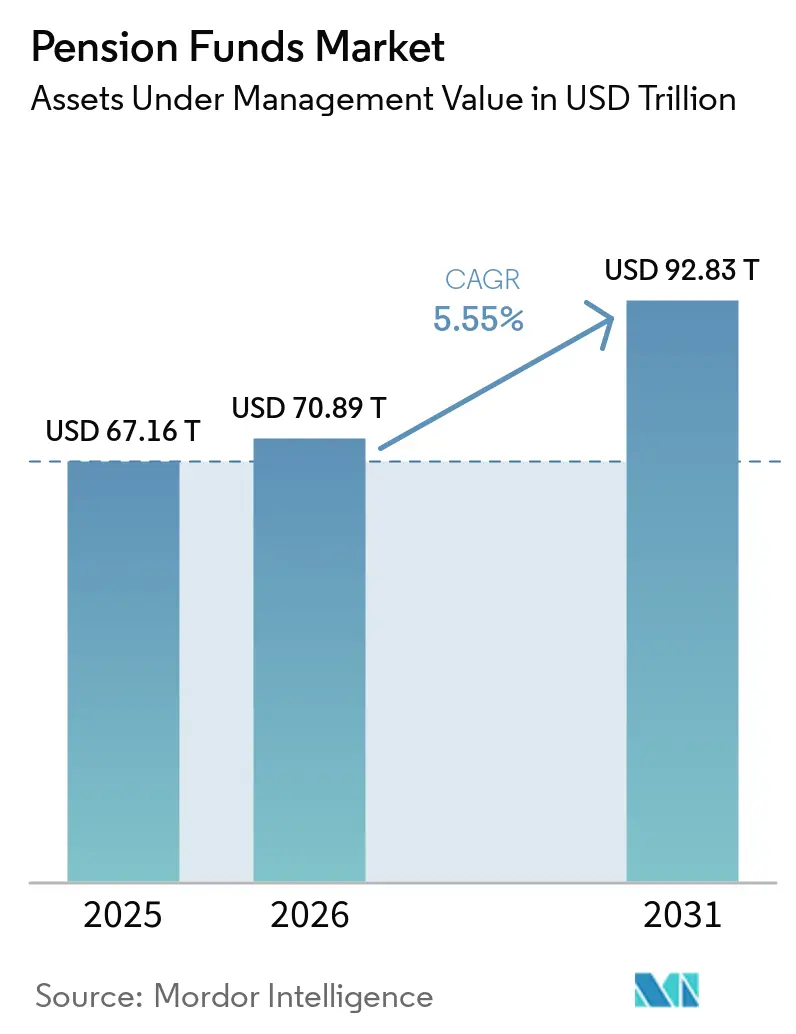
Pension funds market size in 2026 is estimated at USD 70.89 trillion, growing from 2025 value of USD 67.16 trillion with 2031 projections showing USD 92.83 trillion, growing at 5.55% CAGR over 2026-2031. Gains rest on the decisive global swing from defined benefit (DB) to defined contribution (DC) plans, intensifying regulatory nudges that raise participation and contributions, and steady inflows from ageing workforces seeking secure post-retirement income. Asset-allocation patterns continue to migrate toward equities, infrastructure, and other private-market classes as funds search for yield while contending with low-rate backdrops. Meanwhile, digital tools that automate administration, enable member self-service, and lower back-office costs are allowing even mid-sized plans to replicate the scale advantages once enjoyed only by the largest sponsors. Competitive positioning is shifting from pure asset heft to a blend of cyber-secure operations, data-rich risk management, and credible climate strategies that help trustees meet fiduciary and societal expectations.
Key Report Takeaways
- By plan type, defined contribution schemes led with 56.85% of the global pension funds market share in 2025 and are projected to expand at a 6.32% CAGR to 2031.
- By investment strategy, active management still accounted for 54.35% share of the global pension funds market in 2025, while passive strategies are expected to record the fastest growth at 6.02% CAGR through 2031.
- By sponsor, public-sector plans held 68.75% of the global pension funds market share in 2025, but private-sector plans are projected to advance at a 6.91% CAGR of the pension funds market to 2031.
- By geography of investment, onshore assets comprised 72.75% of the global pension funds market size in 2025, yet offshore allocations are projected to grow 5.91% annually between 2026-2031.
- By region, North America commanded 70.65% of global assets of the pension funds market in 2025, whereas Asia-Pacific is forecasted to expand at a 6.65% CAGR through 2031.
Note: Market size and forecast figures in this report are generated using Mordor Intelligence’s proprietary estimation framework, updated with the latest available data and insights as of 2026.
Market Trends and Insights
Drivers Impact Analysis of Pension Funds Market*
| Driver | (~) % Impact on CAGR Forecast | Geographic Relevance | Impact Timeline |
|---|---|---|---|
| Shift from DB to DC schemes | +1.2% | Global, strongest in North America and Europe | Medium term (2-4 years) |
| Ageing population and longevity risk | +0.9% | Global, especially OECD economies | Long term (≥ 4 years) |
| Regulatory push for auto-enrolment | +0.8% | North America, Europe, Asia-Pacific | Short term (≤ 2 years) |
| Diversification into alternative assets | +0.7% | Global, led by North America and Europe | Medium term (2-4 years) |
| Tokenization of real assets | +0.4% | North America and Europe initially, widening globally | Long term (≥ 4 years) |
| Climate-aligned infrastructure demand | +0.6% | Global, early uptake in Europe and North America | Medium term (2-4 years) |
| Source: Mordor Intelligence | |||
Shift from DB to DC Schemes
Defined contribution plans already hold the majority of global pension savings, and their 6.45% growth rate underscores the systemic reallocation of investment risk from employers to employees. The United Kingdom, the Netherlands, and Germany all enacted pivotal reforms that accelerate DC take-up, compelling sponsors to modernize member portals and adopt robo-advice so individuals can manage personalized glide paths. Asset managers benefit from rising flows into target-date funds, while administrators deploy cloud processing to cut record-keeping costs and enable same-day investment of contributions. Collectively, these moves recalibrate fee structures, shorten settlement cycles, and heighten demand for real-time analytics that guide participants toward adequate retirement outcomes.
Ageing Population & Longevity Risk
Longer life expectancy lifts pension liabilities, prompting funds to recalibrate strategic asset mixes away from low-yield government bonds toward global equities, real estate, and infrastructure. Japan’s allocation pivot amplified listed-equity exposure and added nearly USD 280 billion of net gains in fiscal 2024. South Korea and China now study similar equity weightings as buffers against future benefit obligations. Longevity-linked securities, annuity buy-ins, and bespoke reinsurance solutions are rising as sponsors seek cost-effective hedges against payouts that stretch well beyond actuarial projections. These innovations spur demand for granular mortality data and analytics that can refine liability duration and hedge effectiveness.
Regulatory Push for Auto-Enrolment & Higher Contributions
Legislative packages such as the SECURE 2.0 Act in the United States are shaping the US pension funds market by introducing mandatory enrollment and escalating contribution schedules. Compliance workloads multiply, spurring uptake of specialized software that automates eligibility checks, electronic disclosures, and payroll feeds. Higher inflows also enlarge the investible pool for ESG-screened index funds and thematic private-market vehicles that align with new stewardship codes introduced across multiple jurisdictions. Providers that bundle record-keeping, financial-wellness content, and cyber-secure mobile apps stand to gain share among cost-pressured employers.
Diversification into Alternative Assets
Average pension allocations to alternatives rose to 35% of portfolios by 2024, led by infrastructure, private credit, and renewable-energy projects offering contractual cash flows and inflation-linked income. Canadian and Dutch funds spearhead direct-investment consortiums that bypass traditional intermediaries, lowering fees and sharpening governance. Yet the growing ticket sizes magnify operational due diligence burden, accentuating the premium on in-house expertise across valuation, legal structuring, and responsible investing frameworks. Managers who can furnish transparent fee models and robust ESG reporting gain traction as trustees intensify scrutiny of cost-to-alpha trade-offs.
Restraints Impact Analysis of Pension Funds Market*
| Restraint | (~) % Impact on CAGR Forecast | Geographic Relevance | Impact Timeline |
|---|---|---|---|
| Prolonged low-yield environment | -0.8% | Global, greatest pressure in developed markets | Medium term (2-4 years) |
| DB plan under-funding gaps | -0.6% | North America and Europe | Short term (≤ 2 years) |
| Domestic investment mandates | -0.4% | Varies by jurisdiction | Long term (≥ 4 years) |
| Rising cyber-security exposures | -0.3% | Global, highest in digitally advanced economies | Short term (≤ 2 years) |
| Source: Mordor Intelligence | |||
Prolonged Low-Yield Environment
Real yields that remain below assumed returns compress funding ratios and intensify the need for risk assets. U.S. public plans that previously experienced significant returns later faced notable declines, exposing volatility that challenges board risk tolerance. Trustees respond by lengthening duration through private credit, yet must reconcile liquidity constraints with unpredictable benefit-payment schedules. Liability-driven investing mandates expand, and overlays that hedge interest-rate risk receive renewed attention. The environment elevates pressure on fee budgets and underlines the importance of integrated asset-liability modeling tools capable of stress-testing dozens of economic scenarios.
DB Plan Under-Funding Gaps
Corporate sponsors increasingly execute pension-risk-transfer deals. Legal & General’s GBP 785 million transaction covering three Anglo American schemes in 2025 exemplifies the active de-risking pipeline [1]Legal & General Group plc, “Anglo American Pension Buy-in Announcement,” legalandgeneral.com. These moves underscore a robust market for bulk annuity providers and reinsurers that can absorb longevity exposures at scale. Yet they also think asset pools within legacy DB schemes, encouraging asset managers to pivot toward DC, hybrid, and outsourced CIO mandates.
*Our forecasts treat driver/restraint impacts as directional, not additive. The impact forecasts reflect baseline growth, mix effects, and variable interactions.
Pension Funds Market Segment Analysis
By Plan Type:
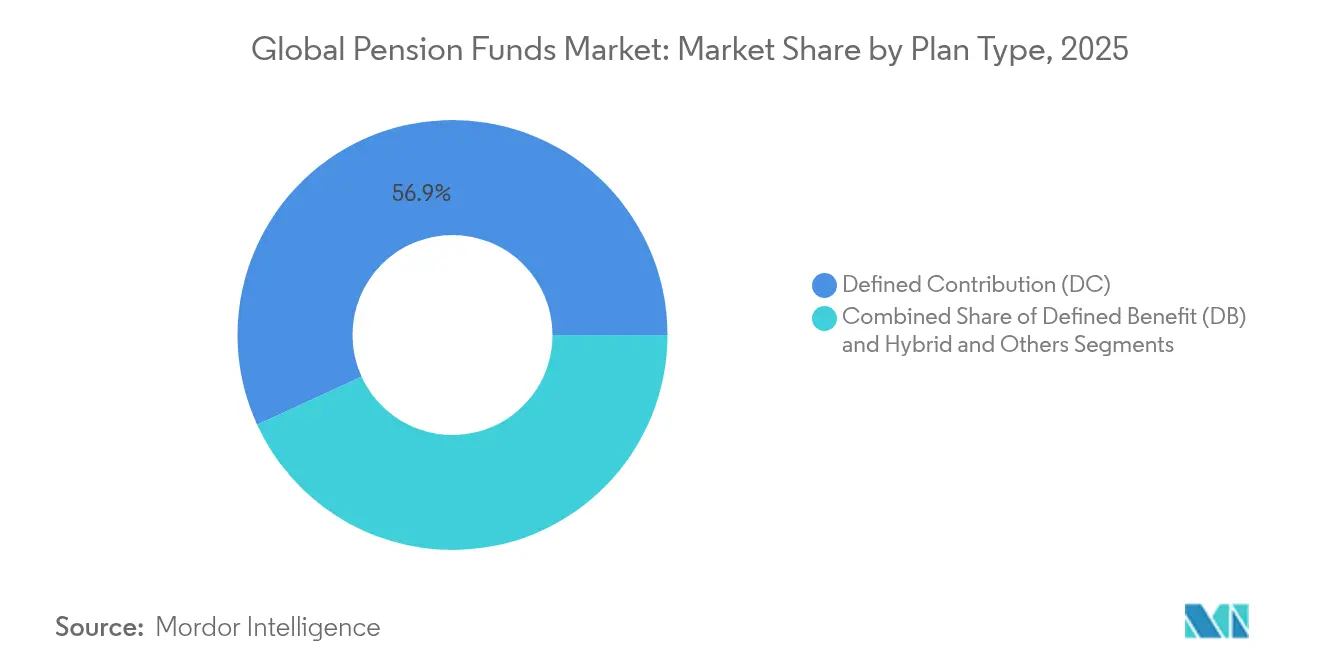
DC Schemes Drive Market EvolutionDefined contribution structures captured 56.85% of the global pension funds market in 2025 and are projected to widen their lead at 6.32% CAGR to 2031. Mandatory auto-enrollment rules in major economies funnel fresh payroll inflows, lifting the pension funds market size for DC accounts to more than USD 52.4 trillion by 2031 . Member-directed investment platforms integrate gamified retirement calculators and ESG filters, enhancing engagement while supplying administrators with anonymized behavioral data that bolsters predictive deferral models.
The legacy DB segment still commands sizable pools, but recurring under-funding and volatility accelerate de-risking. Hybrid formats ranging from collective DC in the United Kingdom to wage-linked plans in Germany seek a middle ground, while India’s civil-service hybrid illustrates global experimentation. For insurers, a vibrant market for buy-ins and longevity swaps emerges, supporting scalable hedging products linked to standardized mortality tables.


By Investment Strategy:
Active Management Under PressureActive mandates accounted for 54.35% of the global pension funds market in 2025, though fee compression and transparency demands are expected to lift passive uptake at 6.02% CAGR. Index-tracking products now embed ESG screens and fractionally integrate smart-beta tilts, allowing trustees to satisfy stewardship codes without incurring full-service active fees. The pension funds market size allocated to passive equity is expected to grow significantly in the coming years, yet boards still reserve carve-outs for high-conviction active approaches in less-liquid arenas such as global small caps and emerging-market debt.
Blended or “hyper-managed” solutions gain traction, fusing passive building blocks with dynamic overlays that harvest factor-based alpha within tightly controlled tracking-error budgets. Artificial-intelligence tools that mine unstructured data for macro sentiment support real-time rebalancing, cutting decision cycles from weeks to hours. Custodians and middleware vendors expand data pipes to feed these engines, creating fertile revenue niches well beyond traditional safekeeping.
By Sponsor Type:
Private Sector Accelerates GrowthDespite the public sector’s share of 68.75% in the global pension funds market in 2025, workplace innovation and regulatory carrots place private-sector plans on a faster 6.91% CAGR trajectory. Simplified set-up procedures, pooled employer plans, and low-cost index funds spur medium-sized enterprises to introduce retirement benefits that rival multinational offerings. The pension funds market share for private-sector plans could climb considerably by 2031, supported by digital payroll integration that slashes administrative friction.
Public funds harness scale to negotiate direct infrastructure stakes and drive climate-aligned mandates, exemplified by CalPERS’ USD 100 billion Climate Action Plan that already surpassed USD 53 billion in commitments. Political oversight can slow adoption of novel asset classes, so many appoint external CIOs who pair internal indexing hubs with specialist managers overseeing private-market allocations.
By Geography of Investment:
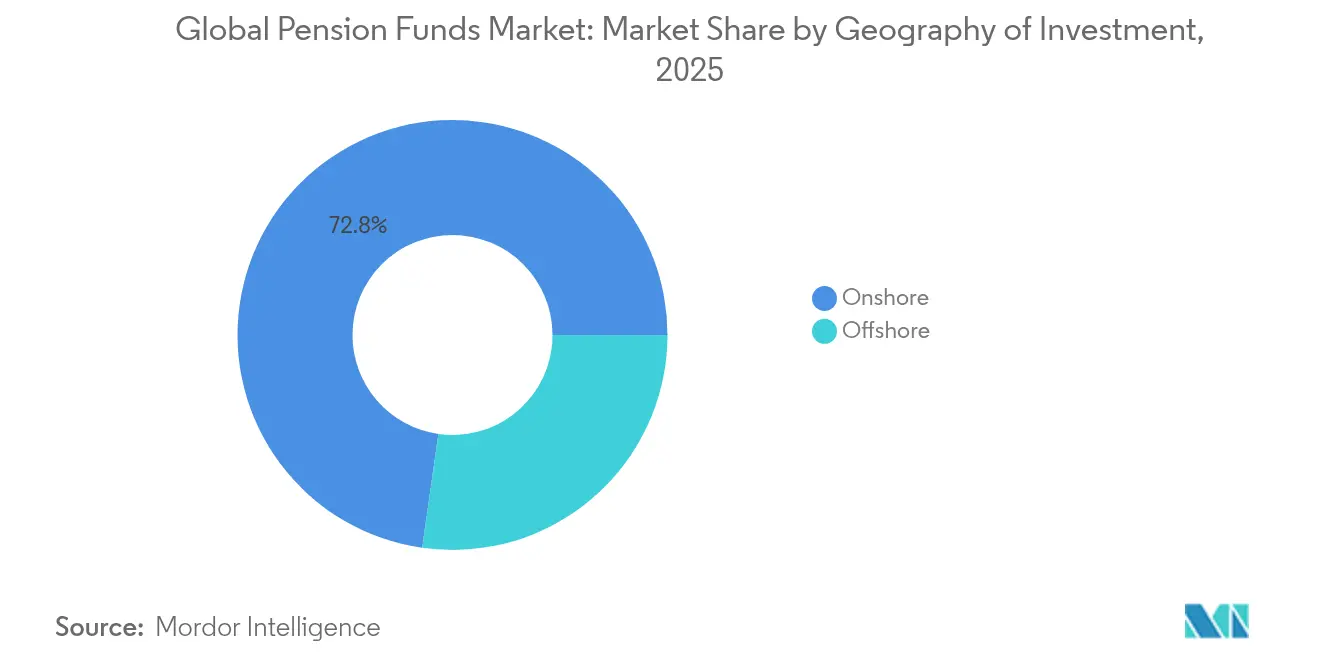
Offshore Allocation Gains MomentumDomestic holdings dominated with a 72.75% share of the global pension funds market in 2025, but offshore assets are advancing 5.91% a year as fiduciaries hunt diversified returns. The pension funds market size allocated for non-domestic securities is expected to grow significantly if current rules remain permissive. Risk systems capable of consolidating multi-currency exposures and real-time ESG metrics become indispensable to boards that must justify allocation shifts to regulators and beneficiaries alike.
Increased scrutiny of geopolitical risk pushes plans to adopt scenario modeling that gauges the impact of sanctions, trade barriers, and FX volatility. Insurers and custodians ramp up cross-border fund-administration capabilities, while bilateral tax treaties and mutual-recognition pacts between securities regulators simplify operational entry into priority destinations such as the United States or European Union.
By Region:
Asia-Pacific Emerges as Growth EngineNorth America retained 70.65% share of the global pension funds market in 2025, thanks to entrenched employer-sponsored systems and an extensive universe of investment vehicles. Nonetheless, Asia-Pacific’s 6.65% CAGR positions it as the principal incremental asset-gathering theatre. Mandatory contribution rises in Australia, newly streamlined portable retirement accounts in India, and rapid middle-class expansion across Southeast Asia combine to accelerate funded-asset accumulation. Japan’s GPIF demonstrated regional sophistication by posting record returns of USD 280 billion in fiscal 2024 .
Chinese pension reforms that gradually raise retirement ages from January 2025 widen participant pools, while South Korea studies contribution increases to 13% to avert fund depletion by 2055. Regional authorities continue refining frameworks that open channels for private-pension products, encouraging global managers to establish onshore vehicles that meet local tax and custody rules.
Geography Analysis
North America Pension Funds Market
North America’s 70.65% share mirrors deep capital markets, tax-advantaged account frameworks, and widely adopted auto-enrolment. Yet public-plan liabilities press sponsors to explore risk-transfer packages, while technology-driven robo-advice reshapes member engagement. The SECURE 2.0 Act broadens coverage through mandatory enrollment and bigger catch-up ceilings, and Canadian funds sustain peer-leading returns via in-house asset teams that pursue direct private deals.
APAC Pension Funds Market
Asia-Pacific remains the fastest-growing region: GPIF’s governance model influences peers, India’s universal-pension initiatives extend coverage, and China’s phased retirement-age uplift places structural support under funded assets. South Korea’s National Pension Service continues to weigh parametric contributions, and Australia’s superannuation rate rises to 12% in 2025.
Europe Pension Funds Market
Europe balances demographic headwinds with reform zeal. Germany’s new EUR 200 billion equity-focused fund underpins its push toward market-based financing, the Netherlands implements its landmark DC shift, and the United Kingdom’s megafund consolidation aims to unlock GBP 80 billion for infrastructure. France’s public sector scheme ERAFP refines tactical asset allocation amid volatility while maintaining long-term ESG commitments.
Regulatory Landscape
Regulation is increasingly geared toward improving participation, governance, and scale in funded pensions, with a continued tilt from DB toward DC structures. In the United States, SECURE 2.0 reinforces auto-enrolment and contribution escalation features that increase compliance requirements for sponsors and recordkeepers. In March 2026, the U.S. Department of Labor proposed a rule aimed at reducing hurdles for 401(k) fiduciaries to consider alternative investments within DC menus.
In the United Kingdom, the Pension Schemes Act 2026 (Royal Assent in April 2026) adds statutory frameworks spanning superfund authorization, value-for-money assessments, and reforms to Local Government Pension Scheme (LGPS) asset pooling. These changes align with broader consolidation efforts already reflected in government direction for larger default arrangements. In Canada, OSFI implemented a new supervisory framework for federally regulated pension plans in April 2024, tightening expectations around plan governance, risk management, and supervisory engagement as funds expand into complex, multi-asset portfolios.
Value Chain Analysis
The pension funds value chain begins with plan design and sponsorship (public and private employers) and member onboarding, then moves to contribution collection via payroll and tax interfaces into recordkeeping and administration platforms that maintain member accounts, compliance reporting, and benefit calculations. Asset allocation and portfolio construction are typically set by trustees and internal investment teams or delegated to outsourced CIOs, then executed through asset managers and direct-investment platforms across public and private markets. Custodians, fund administrators, and pricing and valuation agents provide safekeeping, accounting, and NAV oversight, while actuarial services, consultants, auditors, and legal advisers act as control layers, and member communication and servicing (portals, call centers, and increasingly AI-enabled support) closes the loop on retention and contribution adequacy.
Private markets and cross-border investing concentrate operational bottlenecks in sourcing and due diligence capacity, data integration for look-through risk and ESG reporting, and custody and settlement complexity for multi-currency holdings. Recent consortium and platform activity shows how funds are addressing these constraints, including the March 2026 Canada-Australia CAP Invest Initiative MoU to coordinate infrastructure investment and the April 2026 NEST collaboration with Australian superannuation funds to pursue European private market deals. On implementation, large asset owners and managers also form scaled mandates that package sourcing and portfolio management capabilities, such as the July 2026 Nuveen-CalSTRS sustainable infrastructure partnership.
Competitive Landscape
Competition is moderate and intensifying. The ten largest funds account for a considerable share of global assets, leaving room for mid-tier players that differentiate by domain expertise or technology. Canadian funds illustrate the edge conferred by in-house active capabilities and direct private-market execution. Acquisition momentum remains brisk: Mercer’s 2024 purchase of Cardano added USD 66 billion of assets, while its 2025 acquisition of SECOR bolstered outsourced-CIO bandwidth. Bulk annuity providers such as Legal & General secured multi-scheme buy-ins worth GBP 785 million, signaling an active de-risking pipeline.
Technology vendors that offer real-time data aggregation, cyber-secure cloud platforms, and AI-assisted customer service gain traction. Cyber threats loom large, with 77% of pension executives expecting elevated risk profiles in 2025, prompting stepped-up investment in zero-trust architectures and staff-training programs. Asset managers pivot toward climate-aligned strategies: CalPERS leads with USD 53 billion already deployed toward a USD 100 billion goal.
Emerging disruptors include tokenization start-ups that fractionalize infrastructure equity, reducing ticket sizes and unlocking diversified opportunities. Meanwhile, data providers harness natural-language processing to decode corporate climate disclosures, meeting trustees’ need for transparent ESG metrics while complementing established governance protocols.
Pension Funds Industry Leaders
CalSTRS (US)
Government Pension Investment Fund (Japan)
National Pension Service (South Korea)
ABP (Netherlands)
California Public Employees’ Retirement System (CalPERS)
- *Disclaimer: Major Players sorted in no particular order
Pension Funds Market Companies Covered in this Report
- CalSTRS (US)
- Government Pension Investment Fund (Japan)
- National Pension Service (South Korea)
- ABP (Netherlands)
- California Public Employees' Retirement System (CalPERS)
- Canada Pension Plan Investment Board (CPPIB)
- AustralianSuper
- PFZW (Netherlands)
- USS (Universities Superannuation Scheme, UK)
- Afore XXI Banorte (Mexico)
- National Electrical Benefit Fund
- Caisse des Dépôts (France)
- ATP (Denmark)
- Federal Retirement Thrift Investment Board
- Ontario Teachers' Pension Plan
- Alecta (Sweden)
- UniSuper (Australia)
- APG (Netherlands)
- Public Institute for Social Security (Kuwait)
- General Organization for Social Insurance (GOSI, Saudi Arabia)

Market Opportunities and Future Outlook
The global rebalancing toward DC creates whitespace in administration modernization and member engagement, particularly for mid-sized schemes that need scalable, low-cost operating models. Trade association guidance in the United Kingdom indicates digital transformation shifting toward component-based modernization (API-first integration and event-driven architectures) rather than wholesale system replacement. This opens opportunities for modular recordkeeping upgrades, payroll connectivity, digital identity, automated disclosures, and cyber-secure self-service experiences.
In asset allocation, competition and specialization are intensifying in private markets, particularly infrastructure and private credit, where institutional targets are being met more frequently. Evidence from the June 2026 Hodes Weill and Cornell University Brooks Center monitor shows 52% of institutions are at or above their target infrastructure allocations, alongside rising target levels, which increases demand for differentiated sourcing, co-investment access, and operational transparency in fee and ESG reporting. Large-fund partnerships also provide proof points for scalable product structures that match pension risk and duration needs, including the July 2026 Nuveen-CalSTRS up-to-USD 2 billion sustainable infrastructure program, while cross-fund initiatives such as the Canada-Australia CAP Invest Initiative reflect growing use of consortium models to access larger transactions and manage entry barriers in new private asset markets.
Recent Industry Developments in Pension Funds Market
- July 2026: CalSTRS announced a strategic partnership with Nuveen to invest up to USD 2 billion in sustainable infrastructure through an infrastructure credit strategy. The move directs pension capital into energy and power transition assets while using a scaled mandate structure that can improve deal access and underwriting depth. It also reinforces the shift toward private-market income streams that align duration needs with climate-related objectives.
- May 2025: The UK government directed pension schemes to consolidate into default arrangements holding at least GBP 25 billion by 2030 to support investment in national infrastructure. The policy direction increases pressure on smaller schemes to pursue consolidation, master trusts, or pooled vehicles to meet governance and cost benchmarks. It also raises the importance of value-for-money assessments and administrator capabilities needed to transition members between arrangements.
- July 2024: Kennedy Lewis Investment Management and CalSTRS announced a strategic partnership focused on non-sponsored senior lending. The partnership expanded CalSTRS exposure to private credit implementation channels that can deliver floating-rate income and diversification versus public fixed income. It also highlights the growing role of specialist credit managers and bespoke mandates in pension portfolio construction.


Pension Funds Market Report Scope and Research Methodology
Market Definition and Coverage
For this study, the market is defined as the total value of assets under management held by pension funds that receive, administer, and invest retirement contributions for members across funded retirement plans.
Scope exclusions: We exclude pay-as-you-go social security systems, individually purchased retirement accounts that are not pooled into pension funds, and sovereign wealth vehicles that are not tied to retirement income.
Segments Covered in This Report
- By Plan Type
- Defined Contribution (DC)
- Defined Benefit (DB)
- Hybrid and Others
- By Investment Strategy
- Active
- Passive
- By Sponsor Type
- Public-Sector Plans
- Private-Sector Plans
- By Geography of Investment
- Onshore
- Offshore
- By Region
- North America
- United States
- Canada
- Mexico
- South America
- Brazil
- Argentina
- Chile
- Colombia
- Rest of South America
- Europe
- United Kingdom
- Germany
- France
- Spain
- Italy
- Benelux (Belgium, Netherlands, and Luxembourg)
- Nordics (Sweden, Norway, Denmark, Finland, and Iceland)
- Rest of Europe
- Asia-Pacific
- China
- India
- Japan
- South Korea
- Australia
- South-East Asia (Singapore, Indonesia, Malaysia, Thailand, Vietnam, and Philippines)
- Rest of Asia-Pacific
- Middle East and Africa
- United Arab Emirates
- Saudi Arabia
- South Africa
- Nigeria
- Rest of Middle East and Africa
- North America
Data Sources, Market Sizing, and Validation
Desk Research
Desk research was used to set consistent definitions and to anchor the model to repeatable public data. We referenced sources such as OECD pension statistics, central bank and financial regulator publications, national statistical offices, and multilateral databases like the World Bank and IMF for macro inputs that influence pension asset pools. We also reviewed plan rules and system design notes from pension supervisors, which helped clarify what is funded versus unfunded in each major market.
In addition, we screened annual reports, investor communications, and audited financial statements of large pension institutions to understand asset allocation shifts and reporting practices for AUM. Public policy updates and reputable financial press were used to time major rule changes that can affect contribution flows and funded status. Where helpful, we supplemented with paid subscriptions for company financials and intelligence, news and financials, and patent databases to confirm signals around pension administration and investment operations. The sources listed above are illustrative, and many other public materials were also used for data collection, cross-checks, and clarification.
Primary Interviews and Surveys
Primary work focused on validating what the numbers mean in practice, especially around how pension assets are defined, consolidated, and reported across countries. We spoke with pension fund executives, investment and risk leaders, consultants, administrators, and custody or reporting specialists across APAC, EMEA, and the Americas, so gaps from desk findings could be closed with operating context. These discussions were also used to sense-check assumptions on contribution trends, benefit outflows, and asset allocation drift before the model was finalized.
Distribution of primary research fieldwork respondents
| Company type | Respondent position | Region |
|---|---|---|
| Top tier: 35% | CXOs: 12% | APAC: 39% |
| Mid tier: 48% | Functional/Unit leaders: 32% | EMEA: 37% |
| Smaller Players: 17% | Managers: 56% | Americas: 24% |
Market-Sizing & Forecasting
The market is sized mainly using a top-down approach where country-level pension asset pools are reconstructed from official pension statistics and regulator datasets, then converted into a consistent USD view using stated year-end exchange-rate conventions. When the coverage of a source is partial, adjustments are made using transparent ratios, such as funded share of retirement arrangements or pension assets as a percent of GDP, and the main estimate is reached at the end of the build.
To keep the total grounded, we corroborated results with selective bottom-up checks, such as roll-ups of sampled pension funds by region, and simple AUM logic using reported contributions and benefit payments directionally applied to the starting asset base. A few practical variables were treated as key inputs, including contribution growth, benefit outflow pressure linked to aging demographics, local market returns and the equity-bond mix, inflation and wage growth affecting contributions, and regulatory moves that change participation or minimum funding behavior. For forecasting, scenario analysis was used so a base case could be shaped by expected capital market returns and contribution trends, and then stress-tested for rate shocks and equity drawdowns that pension managers commonly plan for.
Data Validation & Update Cycle
Model outputs are checked against independent signals before sign-off, including pension assets to GDP ranges, year-over-year asset change reasonableness, and alignment with publicly stated pension system summaries in major markets. When a result shows an unusual jump or drop, we trace it back to source definitions, currency timing, or one-off market events, then revisit and re-test the assumption.
A second analyst review is completed to confirm that conversions, aggregations, and exclusions were applied consistently across countries. Reports are refreshed annually, and interim updates are made when material events occur, such as major regulatory reforms or large market dislocations that impact pension asset values. Before delivery, a fresh pass is done so clients receive the latest updated view available at that time.
Mordor Intelligence's Global Pension Fund Market Size Compared Against Other Published Estimates
Published pension fund market sizes often differ because the underlying asset pool is not always defined the same way, and the geographic coverage can change the total quickly. Differences also show up when some sources report year-end assets for a subset of countries, while others estimate a global total with broader inclusion rules.
The spread also comes from choices around what counts as pension fund assets versus wider pension plan assets, how currency conversion is timed, and how recent market moves are reflected. Some estimates mix insurance-based retirement assets into the same bucket, and some exclude smaller markets due to data limits, which can shift totals even if the direction of growth is similar.
Benchmark comparison
| Source | Market Size | Gaps in Research Methodology |
|---|---|---|
| Mordor Intelligence | USD 70.89 T (2026) | |
| Industry Association A | USD 58.51 T (2024) | Uses a defined set of 22 pension markets and focuses on pension assets within that coverage, which can understate a full global total and may apply different inclusions around insurance-linked retirement assets. |
| Multilateral Body B | USD 61.50 T (2024) | Reports OECD pension plan assets, which can include a wider set of asset-backed retirement vehicles beyond pension funds and is not a global total, so geography and vehicle definitions differ from a pension-fund-only scope. |
The table shows a clear two-part gap, where the year and the country set differ, and the definition of what vehicle is being counted also shifts the total. In Mordor Intelligence's model, the sizing is tied to pension funds as collective investment vehicles and then consolidated globally in USD using year-end exchange rates, which keeps the AUM pool consistent before forecasting. With the scope and conversion timing stated upfront, the final number stays traceable to a repeatable set of public inputs and cross-checks.


Key Questions Answered in the Report
What is the current size of the pension funds market?
The market held USD 70.89 trillion in assets in 2026 and is projected to reach USD 92.83 trillion by 2031.
Which plan type is expanding the fastest?
Defined contribution schemes lead growth at a 6.32% CAGR, aided by auto-enrolment mandates and growing payroll contributions.
Why are pension funds increasing allocations to alternative assets?
Persistent low yields in traditional bonds push funds toward infrastructure, private credit, and other alternatives that offer inflation-linked cash flows and diversification benefits.
How are regulators influencing pension savings rates?
Measures such as the SECURE 2.0 Act in the United States introduce mandatory enrollment and higher contribution rates, directly boosting funded assets.
What role does technology play in the pension funds industry?
Digital administration, AI-driven member analytics, and cybersecurity solutions reduce operating costs, enhance engagement, and safeguard sensitive data, becoming critical differentiators among providers.
Which region offers the strongest growth outlook?
Asia-Pacific is forecast to expand at a 6.65% CAGR through 2031, driven by rising contribution rates, regulatory reforms, and rapid middle-class expansion.
Page last updated on:


 Your data is secure and never sold or shared.


