Market Overview
| Study Period | 2017 - 2030 |
|---|---|
| Base Year For Estimation | 2024 |
| Forecast Data Period | 2025 - 2030 |
| Market Size (2025) | USD 2.36 Billion |
| Market Size (2030) | USD 3.18 Billion |
| Growth Rate (2025 - 2030) | 6.15% CAGR |
| Market Concentration | Low |
Major Players*Disclaimer: Major Players sorted in no particular order Image © Mordor Intelligence. Reuse requires attribution under CC BY 4.0. |
|

Pea Protein Ingredients Market Analysis by Mordor Intelligence
The Pea Protein Ingredients Market size is estimated at 2.36 billion USD in 2025, and is expected to reach 3.18 billion USD by 2030, growing at a CAGR of 6.15% during the forecast period (2025-2030).
The pea protein ingredients market is experiencing significant transformation driven by evolving consumer preferences and lifestyle changes. A notable shift towards plant-based nutrition is evident across global markets, with consumers increasingly seeking sustainable and health-conscious alternatives. This trend is particularly pronounced in the sports and fitness sector, where, according to recent data, approximately 242 million Americans (nearly 80% of the population) participated in at least one sport or fitness activity in 2023. The rising health consciousness is further emphasized by the growing supplement consumption, with the 2023 CRN Consumer Survey revealing that 74% of US adults now consume dietary supplements.
The industry is witnessing substantial innovation in product development and manufacturing processes. Major players are investing heavily in research and development to improve protein extraction techniques and enhance the functional properties of pea protein ingredients. For instance, in March 2024, Rougette launched four multinational ingredients, including NUTRALYS® H85 (hydrolysate) and NUTRALYS® T Pea variants, demonstrating the industry's commitment to innovation. These advancements are particularly focused on improving texture, taste, and nutritional profiles to meet evolving consumer expectations.
Clean label trends and natural ingredient preferences continue to shape market dynamics. The industry is responding to consumer demand for transparency and minimal processing, with manufacturers increasingly focusing on organic and non-GMO pea protein offerings. This shift is particularly evident in the sports nutrition segment, where pea protein is gaining traction as a clean alternative to traditional protein sources. In Europe, the trend is particularly strong, with 38% of adults engaging in sports or exercise at least once a week in 2022, driving demand for clean label protein supplements.
The market is experiencing significant developments in application versatility and functionality. Pea protein's adaptability across various food and beverage applications has led to its increased adoption in multiple product categories. The ingredient's success in addressing global health challenges is particularly relevant given that over one billion people globally were living with obesity between 2022 and 2023. Manufacturers are leveraging pea protein's functional properties, such as its ability to enhance texture, improve nutritional profiles, and provide allergen-free alternatives across various applications, from sports nutrition to meat alternatives and bakery products.
Global Pea Protein Ingredients Market Trends and Insights
Due to several health benefits of plant protein-based diets, customers are moving toward vegan offerings
- Globally, consumers are shifting their dietary preferences. Notably, there is a growing preference for dairy and meat alternatives, especially among consumers in Europe and North America. In 2022, Europe led the way with plant-based milk accounting for 38% of total plant-based food sales, followed closely by plant-based meat. This evolving trend is boosting the number of flexitarian and vegan consumers and opening doors for manufacturers to innovate within the plant protein sector.
- The popularity of plant-based protein alternatives is due to their nutritional value and stems from growing concerns over environmental impact, ethics, and health. Proteins, known for their slower digestion compared to carbohydrates, play a crucial role in weight management by promoting a longer-lasting feeling of fullness with fewer calories. A new study reveals that over one billion people globally were living with obesity between 2022 and 2023.
- Moreover, the rising engagement of the younger population in sports and fitness activities, coupled with a growing trend of fortifying food and beverages with functional ingredients for added health benefits, is fueling the demand for plant-based proteins. In 2023, a record-high 242 million Americans aged 6 and older (nearly 80% of the population) participated in at least one sport or fitness activity, a 2.2% increase from 2022. This active lifestyle shift is driving the demand for plant-based protein food products. Furthermore, government initiatives, such as Canada's Health Ministry, which revamped its food guide, emphasizing three key categories: vegetables and fruits, whole grains, and plant-based proteins, are driving awareness and demand for alternative proteins among consumers.

Understand The Key Trends Shaping This Market
Download PDF
North America dominates the global dry pea production, driven by Canada
- Dry peas are the primary source for extracting pea protein, with Canada leading the production, closely followed by the United States. In Canada, provinces like Saskatchewan, Alberta, and Manitoba lead dry pea production. Notably, North American pea production surged 32% from 2015 to 2020. By 2020, the region's focus had shifted significantly toward dried peas, claiming a dominant 95% share of the total pea production. Conversely, the United States faced production challenges, primarily from reduced seeding in North Dakota, diminished yields, and higher abandonment rates. In its 2020-2021 forecast, the USDA anticipated a 17% drop in US dry pea production, settling just above 0.8 million metric tons.
- In Asia-Pacific, China leads the pea production, closely trailed by India. China boasts two key dried pea production hubs: the Northern and Southern Dried Pea-producing Areas. Provinces like Ningxia, Gansu, Yunnan, and Qinghai collectively contribute over 70% to China's dried pea output. Shifting to India, the country's dry pea production hit 100,440.2 tons in 2022, marking a notable 23.72% increase from the 2019 figure of 811,810 tons.
- Aside from the dominant players, countries like Russia, France, Ukraine, and Australia also hold significant global dry pea production positions. Notably, yellow peas are in substantial cultivation, especially in eastern Australia. While historically, Victoria and South Australia led Australian pea production, Western Australia has seen a remarkable surge in production, attributed to advancements in both varieties and production techniques.

Understand The Key Trends Shaping This Market
Download PDF
OTHER KEY INDUSTRY TRENDS COVERED IN THE REPORT
- Rising trend of clean-label baby food and escalating strategic investments are driving the market globally
- Healthy trends in beverages are impacting market growth
- A rise in the demand for single-serve packets may augment production
- Dairy alternatives to witness significant growth
- Meat protein alternatives are revolutionizing the meat segment
- Healthy snacking preferences with growth in online platforms are supporting market growth
- The increasing demand for compound feed containing functional ingredients is affecting sales within this segment
- Europe is the leading market with a high demand for bread and biscuits
- Growing preference for convenient breakfast options may augment the market
- Increase in at-home consumption and demand for healthy confectionery products
- Growing nutritional concerns for aging populations drive the demand for medical nutrition products globally
- Ready-to-cook and frozen foods have witnessed a surge in sales
- Rising health awareness and growing demand from millennials are driving the market
- Natural ingredients, coupled with product specificity, are largely driving the segmental sales
Segment Analysis: Form
Isolates Segment in Pea Protein Market
The pea protein isolate market segment maintains its dominant position in the global pea protein market, commanding approximately 58% of the market share in 2024. This substantial market presence is primarily attributed to isolates' exceptional protein content of 80% or higher, making them a premium choice for manufacturers and consumers alike. The segment's leadership is further strengthened by its widespread adoption in the food and beverage industry, particularly in meat alternatives and ready-to-eat/convenience food products. Pea protein isolates boast an impressive digestibility rate of 98%, making them easily absorbed by the body and particularly appealing to vegans, vegetarians, and individuals with dairy allergies or intolerances. The segment is also experiencing robust growth, projected to expand at around 8% annually through 2029, driven by the industry's shift toward premiumization and the elevated status of pea protein as a high-end ingredient. The increasing demand for premium, high-protein formulations, especially in sports nutrition and plant-based meat alternatives, continues to fuel the segment's expansion.
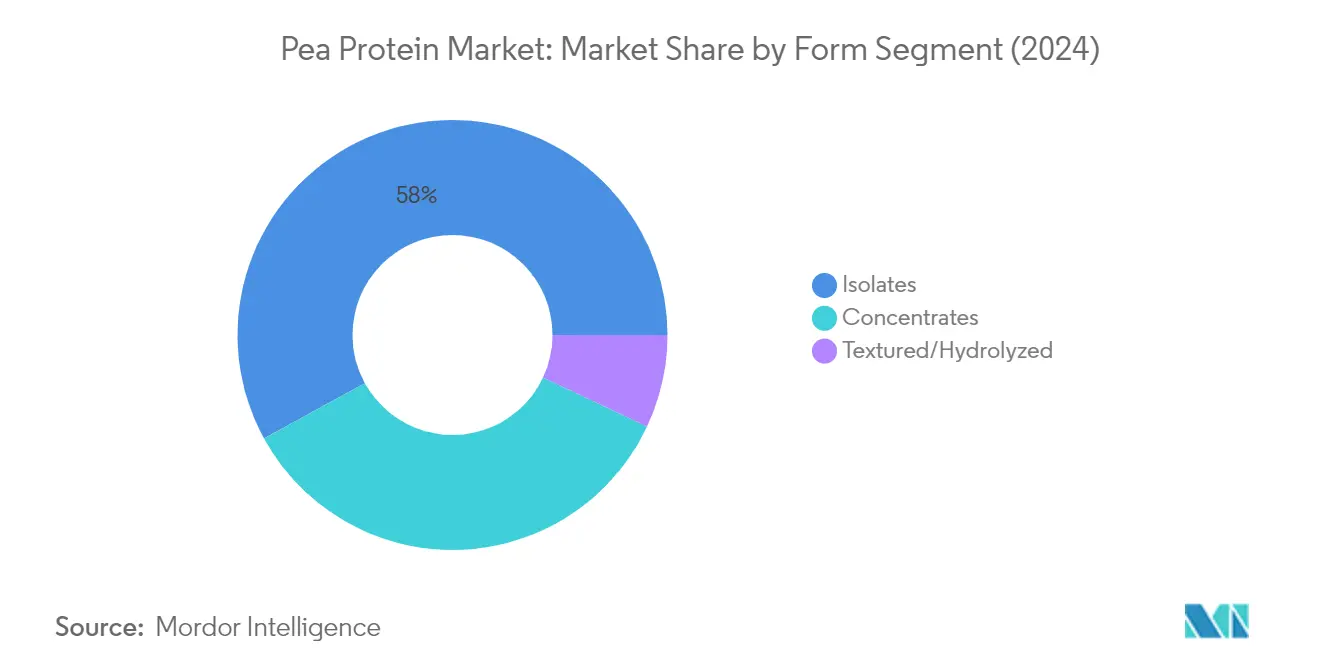
Remaining Segments in Pea Protein Market
The concentrates and textured pea protein market segments play vital complementary roles in the global pea protein market. Concentrates, offering a more cost-effective solution while maintaining significant protein content, serve as a versatile ingredient across various applications, from sauces and pasta to cereals and snacks. Their excellent water-binding capacity, solubility, and minimal anti-nutritional factors make them particularly valuable in the food and beverage industry. Meanwhile, the textured/hydrolyzed segment, though smaller in market share, has carved out a crucial niche in the market, particularly in the personal care and cosmetics sector. These proteins are especially valued for their ability to enhance skin integrity, boost water content, and provide anti-aging benefits in skincare formulations. The hydrolyzed variants are gaining traction among consumers with compromised digestive systems, while textured proteins are becoming increasingly important in meat alternative applications due to their ability to mimic fibrous textures.
Segment Analysis: End User
Food and Beverages Segment in Pea Protein Market
The Food and Beverages (F&B) segment maintains its dominant position in the global pea protein market, commanding approximately 88% of the market share in 2024. This substantial market presence is primarily driven by the segment's extensive application portfolio, ranging from meat alternatives and dairy products to bakery items and beverages. The segment's leadership is further strengthened by pea protein's versatile functional properties, including its ability to enhance texture, improve nutritional profiles, and serve as an effective binding agent. Manufacturers are increasingly incorporating pea protein ingredients into their formulations due to its hypoallergenic properties and clean-label appeal, particularly in plant-based meat alternatives and dairy substitutes. The segment's robust performance is also supported by the rising consumer awareness of plant-based proteins and their health benefits, coupled with the growing demand for sustainable and environmentally friendly food ingredients.
Supplements Segment in Pea Protein Market
The Supplements segment is emerging as the fastest-growing category in the pea protein market, projected to expand at approximately 7% CAGR from 2024 to 2029. This remarkable growth is primarily fueled by the increasing adoption of pea protein in sports nutrition products, where it serves as an effective alternative to traditional protein sources. The segment's expansion is particularly notable in the development of specialized nutritional supplements targeting various consumer groups, including athletes, fitness enthusiasts, and health-conscious individuals. The rising preference for plant-based protein supplements, coupled with growing awareness about the benefits of pea protein's amino acid profile and digestibility, is driving innovation in supplement formulations. Manufacturers are responding to this trend by introducing new product variants and formats, including protein powders, bars, and ready-to-drink beverages, further accelerating the segment's growth trajectory.
Remaining Segments in End User Segmentation
The Animal Feed and Personal Care & Cosmetics segments represent important niche applications in the pea protein market. The Animal Feed sector leverages pea protein's nutritional benefits for livestock and aquaculture applications, offering a sustainable alternative to traditional protein sources in feed formulations. Meanwhile, the Personal Care & Cosmetics segment is capitalizing on pea protein's skin-conditioning properties and its appeal as a natural ingredient in various beauty and personal care products. Both segments benefit from ongoing research and development activities that continue to uncover new applications and benefits of pea protein ingredients, contributing to the overall market diversification and growth. These segments are particularly significant in regions with strong agricultural and cosmetic industries, where manufacturers are increasingly exploring innovative applications for pea protein ingredients.
Pea Protein Ingredients Market Geography Segment Analysis
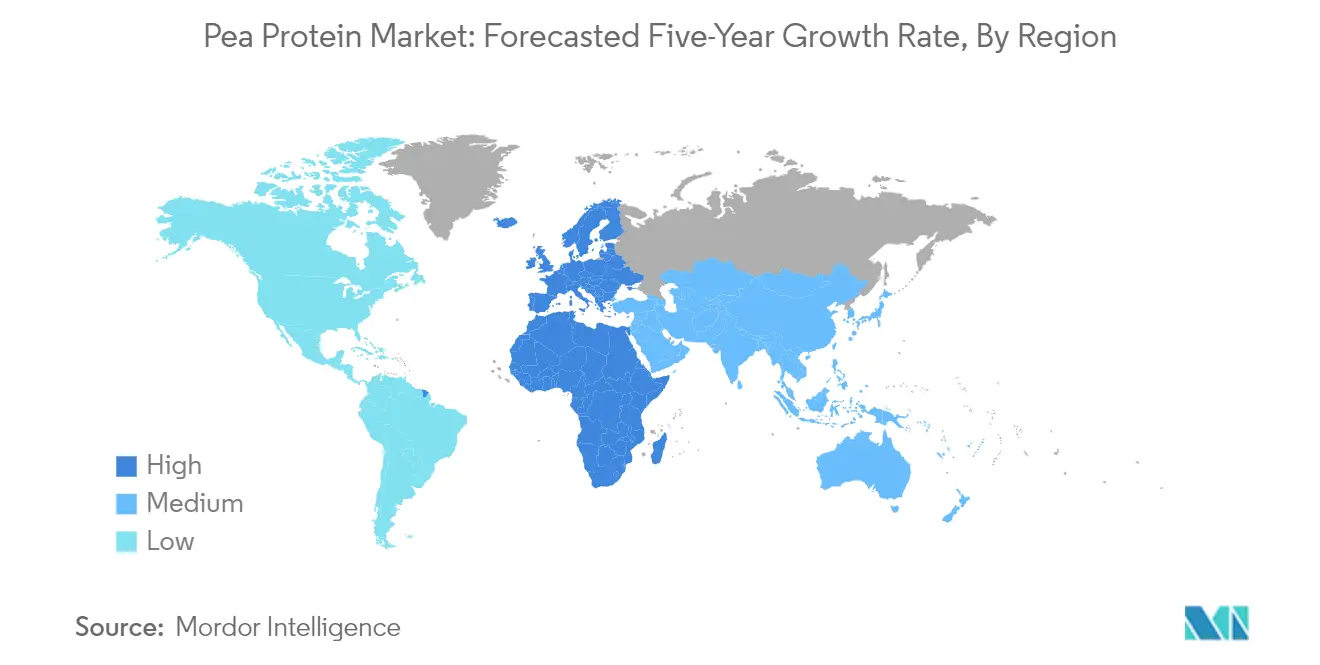
Pea Protein Market in Africa
The African pea protein market share is experiencing significant transformation, driven by increasing awareness of plant-based proteins and changing dietary preferences. The region's market dynamics are shaped by growing health consciousness and the emergence of innovative food products incorporating pea protein. Countries like Nigeria, South Africa, and other African nations are witnessing a gradual shift toward plant-based alternatives, particularly in urban areas where consumer awareness of health benefits is higher.
Pea Protein Market in Nigeria
Nigeria stands as the largest pea protein market in Africa, commanding approximately 40% of the regional market share in 2024. The country's market is primarily driven by the food and beverage segment, with a particular focus on meat alternatives and protein-enriched products. The Nigerian market benefits from increasing urbanization, rising disposable incomes, and growing awareness of health benefits associated with plant-based proteins. The country's young demographic and expanding middle class are particularly receptive to innovative food products incorporating pea protein.
Pea Protein Market Growth Potential in Nigeria
Nigeria continues to demonstrate remarkable growth potential, with a projected CAGR of approximately 12% during 2024-2029. This growth is fueled by the increasing adoption of plant-based proteins in various applications, particularly in the food and beverage sector. The country's expanding retail sector, coupled with growing consumer awareness about health and wellness, is driving the demand for pea protein-based products. Nigerian consumers are increasingly seeking healthier alternatives to traditional protein sources, particularly in urban areas where health consciousness is more prevalent.
Pea Protein Market in Asia-Pacific
The Asia-Pacific region, dominated by China, leads the global pea protein market with a significant share. The region's growth is attributed to the rising demand for plant-based proteins and the increasing popularity of vegan diets. Countries such as South Korea are also contributing to this growth, with the South Korea pea protein market showing promising potential due to increasing consumer awareness and demand for healthier food options.
Pea Protein Market in Europe
Europe follows Asia-Pacific in the global pea protein market, with Germany being the largest consumer. The European market is characterized by a strong preference for sustainable and plant-based food products. The increasing trend towards veganism and vegetarianism is further propelling the demand for pea protein in the region.
Pea Protein Market in the Middle East
The Middle East is the fastest-growing region in the global pea protein market, with a CAGR of 12.21%. Saudi Arabia leads the market, driven by a growing interest in health and wellness. The region's market is expanding rapidly due to increasing consumer awareness and the introduction of innovative plant-based products.
Pea Protein Market in North America
North America, led by the United States, retains a strong position in the global pea protein market. The region's market is driven by the increasing demand for plant-based proteins and the growing trend of health-conscious eating. The market is characterized by a high level of innovation and product development in the food and beverage sector.
Pea Protein Market in South America
Brazil dominates the South American pea protein market with a 53% share. The region is witnessing a growing demand for plant-based proteins, driven by increasing health consciousness and the rising popularity of vegan diets. The market is expected to continue its growth trajectory, supported by the expanding middle class and increasing disposable incomes.
Get Analysis on Important Geographic Markets
Download PDF
Competitive Landscape
Top Companies in Pea Protein Market
The pea protein ingredients industry is characterized by continuous product innovation, with companies focusing on developing novel formulations and applications. Major players are investing heavily in research and development to improve protein content, taste profiles, and functional properties of their offerings. Strategic expansion moves include establishing new production facilities and forming partnerships with local players to strengthen regional presence. Companies are demonstrating operational agility by rapidly adapting to changing consumer preferences, particularly in the plant-based meat alternatives segment. There is also a notable trend of vertical integration, with companies investing in sustainable farming practices and developing relationships with pea farmers to ensure consistent raw material supply. The industry witnesses frequent collaborations between ingredient manufacturers and food companies to develop innovative applications and expand market reach.
Consolidated Market Led By Global Players
The global pea protein ingredients industry exhibits a consolidated structure dominated by multinational corporations with diverse product portfolios. These leading players leverage their extensive distribution networks, technological capabilities, and strong brand recognition to maintain their market positions. The market is characterized by the presence of both specialized ingredient manufacturers focusing solely on plant proteins and large conglomerates with broader food ingredient portfolios. Regional players maintain a significant presence in specific geographical markets through their understanding of local preferences and established distribution channels.
Merger and acquisition activities are reshaping the competitive landscape, with larger companies acquiring smaller, innovative players to expand their product offerings and geographical reach. Companies are increasingly focusing on backward integration through partnerships with farmers and processors to ensure quality control and supply chain efficiency. The industry also witnesses strategic alliances between ingredient manufacturers and technology providers to enhance production capabilities and develop novel processing techniques. Market entry barriers remain high due to substantial capital requirements and the need for specialized technical expertise.
Innovation and Sustainability Drive Future Success
Success in the pea protein market share increasingly depends on companies' ability to innovate while maintaining sustainable practices. Market leaders are investing in advanced processing technologies to improve protein quality and functionality while reducing environmental impact. Companies are focusing on developing clean-label products and obtaining various certifications to meet evolving consumer preferences. Building strong relationships with food and beverage manufacturers and understanding their specific requirements has become crucial for maintaining market share. The ability to provide customized solutions and technical support to end-users is emerging as a key differentiator in the market.
For new entrants and smaller players, success lies in identifying and serving niche market segments with specialized products. Companies need to focus on developing unique value propositions through product differentiation or cost leadership strategies. Building robust supply chain networks and ensuring consistent quality are becoming increasingly important as end-users demand reliability and traceability. The regulatory landscape, particularly regarding protein content claims and labeling requirements, continues to shape market dynamics and influence company strategies. Future success will also depend on companies' ability to adapt to changing consumer preferences and potential shifts in the competitive landscape of alternative proteins.
Pea Protein Ingredients Industry Leaders
-
Archer Daniels Midland Company
-
Cargill Incorporated
-
Ingredion Incorporated
-
International Flavors & Fragrances, Inc.
-
Kerry Group
- *Disclaimer: Major Players sorted in no particular order

Need More Details on Market Players and Competitors?
Download PDF
Recent Industry Developments
- June 2022: Roquette, a global player in plant-based ingredients and a pioneer in plant proteins, announced the launch of its new NUTRALYS® range of organic textured proteins derived from peas and fava
- July 2021: The European Investment Bank (EIB), Société Régionale d'Investissement de Wallonie (SRIW), and Sofiprotéol, a financing arm of the Avril Group, planned to contribute EUR 10 million to a Cosucra bond offering. With the support of this funding, Cosucra is expected to increase its manufacturing capacity and solidify its position as the market leader in Europe. It will allow Cosucra to boost production levels and enhance the efficiency of its industrial machinery, elevating the company to the position of the top European producer of pea protein.
- April 2021: Ingredion Inc. added two new ingredients to its Plant-based Pea Protein segment. It launched Vitessense Pulse 1853 pea protein isolate and Purity P 1002 pea starch, which are 100% sustainably sourced from North American farms.
Global Pea Protein Ingredients Market Report Scope
Concentrates, Isolates, Textured/Hydrolyzed are covered as segments by Form. Animal Feed, Food and Beverages, Personal Care and Cosmetics, Supplements are covered as segments by End User. Africa, Asia-Pacific, Europe, Middle East, North America, South America are covered as segments by Region.
Form
| Concentrates |
| Isolates |
| Textured/Hydrolyzed |
End User
| Animal Feed | ||
| Food and Beverages | By Sub End User | Bakery |
| Beverages | ||
| Breakfast Cereals | ||
| Condiments/Sauces | ||
| Confectionery | ||
| Dairy and Dairy Alternative Products | ||
| Meat/Poultry/Seafood and Meat Alternative Products | ||
| RTE/RTC Food Products | ||
| Snacks | ||
| Personal Care and Cosmetics | ||
| Supplements | By Sub End User | Baby Food and Infant Formula |
| Elderly Nutrition and Medical Nutrition | ||
| Sport/Performance Nutrition | ||
Region
| Africa | By Form | |
| By End User | ||
| By Country | Nigeria | |
| South Africa | ||
| Rest of Africa | ||
| Asia-Pacific | By Form | |
| By End User | ||
| Australia | ||
| China | ||
| India | ||
| Indonesia | ||
| Japan | ||
| Malaysia | ||
| New Zealand | ||
| South Korea | ||
| Thailand | ||
| Vietnam | ||
| Rest of Asia-Pacific | ||
| Europe | By Form | |
| By End User | ||
| Belgium | ||
| France | ||
| Germany | ||
| Italy | ||
| Netherlands | ||
| Russia | ||
| Spain | ||
| Turkey | ||
| United Kingdom | ||
| Rest of Europe | ||
| Middle East | By Form | |
| By End User | ||
| Iran | ||
| Saudi Arabia | ||
| United Arab Emirates | ||
| Rest of Middle East | ||
| North America | By Form | |
| By End User | ||
| Canada | ||
| Mexico | ||
| United States | ||
| Rest of North America | ||
| South America | By Form | |
| By End User | ||
| Argentina | ||
| Brazil | ||
| Rest of South America | ||
| Form | Concentrates | ||
| Isolates | |||
| Textured/Hydrolyzed | |||
| End User | Animal Feed | ||
| Food and Beverages | By Sub End User | Bakery | |
| Beverages | |||
| Breakfast Cereals | |||
| Condiments/Sauces | |||
| Confectionery | |||
| Dairy and Dairy Alternative Products | |||
| Meat/Poultry/Seafood and Meat Alternative Products | |||
| RTE/RTC Food Products | |||
| Snacks | |||
| Personal Care and Cosmetics | |||
| Supplements | By Sub End User | Baby Food and Infant Formula | |
| Elderly Nutrition and Medical Nutrition | |||
| Sport/Performance Nutrition | |||
| Region | Africa | By Form | |
| By End User | |||
| By Country | Nigeria | ||
| South Africa | |||
| Rest of Africa | |||
| Asia-Pacific | By Form | ||
| By End User | |||
| Australia | |||
| China | |||
| India | |||
| Indonesia | |||
| Japan | |||
| Malaysia | |||
| New Zealand | |||
| South Korea | |||
| Thailand | |||
| Vietnam | |||
| Rest of Asia-Pacific | |||
| Europe | By Form | ||
| By End User | |||
| Belgium | |||
| France | |||
| Germany | |||
| Italy | |||
| Netherlands | |||
| Russia | |||
| Spain | |||
| Turkey | |||
| United Kingdom | |||
| Rest of Europe | |||
| Middle East | By Form | ||
| By End User | |||
| Iran | |||
| Saudi Arabia | |||
| United Arab Emirates | |||
| Rest of Middle East | |||
| North America | By Form | ||
| By End User | |||
| Canada | |||
| Mexico | |||
| United States | |||
| Rest of North America | |||
| South America | By Form | ||
| By End User | |||
| Argentina | |||
| Brazil | |||
| Rest of South America | |||
Need A Different Region or Segment?
Customize Now
Market Definition
- End User - The Protein Ingredients Market operates on a B2B basis. Food, Beverages, Supplements, Animal Feed, and Personal Care & Cosmetic manufacturers are considered to be end-consumers in the market studied. The scope excludes manufacturers buying liquid/dry whey to be used for application as a binding agent or thickener or other non-protein applications.
- Penetration Rate - Penetration Rate is defined as the percentage of Protein-Fortified End User Market Volume in the Overall End User Market Volume.
- Average Protein Content - Average protein content is the average protein content present per 100 g of product manufactured by all end-user companies considered under the scope of this report.
- End User Market Volume - End-user market volume is the consolidated volume of all types and forms of end-user products in the country or region.
| Keyword | Definition |
|---|---|
| Alpha-lactalbumin (α-Lactalbumin) | It is a protein that regulates the production of lactose in the milk of almost all mammalian species. |
| Amino acid | It is an organic compound that contains both amino and carboxylic acid functional groups, which are required for the synthesis of body protein and other important nitrogen-containing compounds, such as creatine, peptide hormones, and some neurotransmitters. |
| Blanching | It is the process of briefly heating vegetables with steam or boiling water. |
| BRC | British Retail Consortium |
| Bread improver | It is a flour-based blend of several components with specific functional properties designed to modify dough characteristics and give quality attributes to bread. |
| BSF | Black Soldier Fly |
| Caseinate | It is a substance produced by adding an alkali to acid casein, a derivative of casein. |
| Celiac disease | Celiac disease is an immune reaction to eating gluten, a protein found in wheat, barley, and rye. |
| Colostrum | It is a milky fluid that’s released by mammals that have recently given birth before breast milk production begins. |
| Concentrate | It is the least processed form of protein and has a protein content ranging from 40-90% by weight. |
| Dry protein basis | It refers to the percentage of "pure protein" present in a supplement after the water in it is completely removed through heat. |
| Dry whey | It is the product resulting from drying fresh whey which has been pasteurized and to which nothing has been added as a preservative. |
| Egg protein | It is a mixture of individual proteins, including ovalbumin, ovomucoid, ovoglobulin, conalbumin, vitellin, and vitellenin. |
| Emulsifier | It is a food additive that facilitates the blending of foods that are immiscible with one another, such as oil and water. |
| Enrichment | It is the process of addition of micronutrients that are lost during the processing of the product. |
| ERS | Economic Research Service of the USDA |
| Extrusion | It is the process of forcing soft mixed ingredients through an opening in a perforated plate or die designed to produce the required shape. The extruded food is then cut to a specific size by blades. |
| Fava | Also known as Faba, it is another word for yellow split beans. |
| FDA | Food and Drug Administration |
| Flaking | It is a process in which typically a cereal grain (like corn, wheat, or rice) is broken down into grits, cooked with flavors and syrups, and then pressed into flakes between cooled rollers. |
| Foaming agent | It is a food ingredient that makes it possible to form or maintain a uniform dispersion of a gaseous phase in a liquid or solid food. |
| Foodservice | It refers to the part of the food industry which includes businesses, institutions, and companies which prepare meals outside the home. It includes restaurants, school and hospital cafeterias, catering operations, and many other formats. |
| Fortification | It is the deliberate addition of micronutrients that are not found in them naturally or which are lost during processing, to improve a food product's nutritional value. |
| FSANZ | Food Standards Australia New Zealand |
| FSIS | Food Safety and Inspection Service |
| FSSAI | Food Safety and Standards Authority of India |
| Gelling agent | It is an ingredient that functions as a stabilizer and thickener to provide thickening without stiffness through the formation of gel. |
| GHG | Greenhouse Gas |
| Gluten | It is a family of proteins found in grains, including wheat, rye, spelt, and barley. |
| Hemp | It is a botanical class of Cannabis sativa cultivars grown specifically for industrial or medicinal use. |
| Hydrolysate | It is a form of protein manufactured by exposing the protein to enzymes that can partially break the bonds between the protein's amino acids and break down large, complicated proteins into smaller pieces. Its processing makes it easier and quicker to digest. |
| Hypoallergenic | It refers to a substance that causes fewer allergic reactions. |
| Isolate | It is the purest and most processed form of protein which has undergone separation to obtain a pure protein fraction. It typically contains ≥ 90% of protein by weight. |
| Keratin | It is a protein that helps form hair, nails, and the outer layer of skin. |
| Lactalbumin | It is the albumin contained in milk and obtained from whey. |
| Lactoferrin | It is an iron‑binding glycoprotein that is present in the milk of most mammals. |
| Lupin | It is the yellow legume seeds of the genus Lupinus. |
| Millenial | Also known as Generation Y or Gen Y, it refers to the people born from 1981 to 1996. |
| Monogastric | It refers to an animal with a single-compartmented stomach. Examples of monogastric include humans, poultry, pigs, horses, rabbits, dogs, and cats. Most monogastric are generally unable to digest much cellulose food materials such as grasses. |
| MPC | Milk protein concentrate |
| MPI | Milk protein isolate |
| MSPI | Methylated soy protein isolate |
| Mycoprotein | Mycoprotein is a form of single-cell protein, also known as fungal protein, derived from fungi for human consumption. |
| Nutricosmetics | It is a category of products and ingredients that act as nutritional supplements to care for skin, nails, and hair natural beauty. |
| Osteoporosis | It is a medical condition in which the bones become brittle and fragile from loss of tissue, typically as a result of hormonal changes, or deficiency of calcium or vitamin D. |
| PDCAAS | Protein digestibility-corrected amino acid score (PDCAAS) is a method of evaluating the quality of a protein based on both the amino acid requirements of humans and their ability to digest it. |
| Per-capita consumption of animal protein | It is the average amount of animal protein (such as milk, whey, gelatin, collagen, and egg proteins) that is readily available for consumption by each person in an actual population. |
| Per-capita consumption of plant protein | It is the average amount of plant protein (such as soy, wheat, pea, oat, and hemp proteins) that is readily available for consumption by each person in an actual population. |
| Quorn | It is a microbial protein manufactured using mycoprotein as an ingredient, in which the fungus culture is dried and mixed with egg albumen or potato protein, which acts as a binder, and then is adjusted in texture and pressed into various forms. |
| Ready-to-Cook (RTC) | It refers to food products that include all of the ingredients, where some preparation or cooking is required through a process that is given on the package. |
| Ready-to-Eat (RTE) | It refers to a food product prepared or cooked in advance, with no further cooking or preparation required before being eaten. |
| RTD | Ready-to-Drink |
| RTS | Ready-to-Serve |
| Saturated fat | It is a type of fat in which the fatty acid chains have all single bonds. It is generally considered unhealthy. |
| Sausage | It is a meat product made of finely chopped and seasoned meat, which may be fresh, smoked, or pickled and which is then usually stuffed into a casing. |
| Seitan | It is a plant-based meat substitute made out of wheat gluten. |
| Softgel | It is a gelatin-based capsule with a liquid fill. |
| SPC | Soy protein concentrate |
| SPI | Soy protein isolate |
| Spirulina | It is a biomass of cyanobacteria that can be consumed by humans and animals. |
| Stabilizer | It is an ingredient added to food products to help maintain or enhance their original texture, and physical and chemical characteristics. |
| Supplementation | It is the consumption or provision of concentrated sources of nutrients or other substances that are intended to supplement nutrients in the diet and is intended to correct nutritional deficiencies. |
| Texturant | It is a specific type of food ingredient that is used to control and alter the mouthfeel and texture of food and beverage products. |
| Thickener | It is an ingredient that is used to increase the viscosity of a liquid or dough and make it thicker, without substantially changing its other properties. |
| Trans fat | Also called trans-unsaturated fatty acids or trans fatty acids, it is a type of unsaturated fat that naturally occurs in small amounts in meat. |
| TSP | Textured soy protein |
| TVP | Textured vegetable protein |
| WPC | Whey protein concentrate |
| WPI | Whey protein isolate |
Need More Details on Market Definition?
Ask a Question
Research Methodology
Mordor Intelligence follows a four-step methodology in all our reports.
- Step-1: Identify Key Variables: The quantifiable key variables (industry and extraneous) pertaining to the specific product segment and country are selected from a group of relevant variables & factors based on desk research & literature review; along with primary expert inputs. These variables are further confirmed through regression modeling (wherever required).
- Step-2: Build a Market Model: In order to build a robust forecasting methodology, the variables and factors identified in Step-1 are tested against available historical market numbers. Through an iterative process, the variables required for market forecast are set and the model is built on the basis of these variables.
- Step-3: Validate and Finalize: In this important step, all market numbers, variables and analyst calls are validated through an extensive network of primary research experts from the market studied. The respondents are selected across levels and functions to generate a holistic picture of the market studied.
- Step-4: Research Outputs: Syndicated Reports, Custom Consulting Assignments, Databases & Subscription Platforms

Get More Details On Research Methodology
Download PDF


