
Packaging Machinery Market Size and Share
Market Overview
| Study Period | 2020 - 2031 |
|---|---|
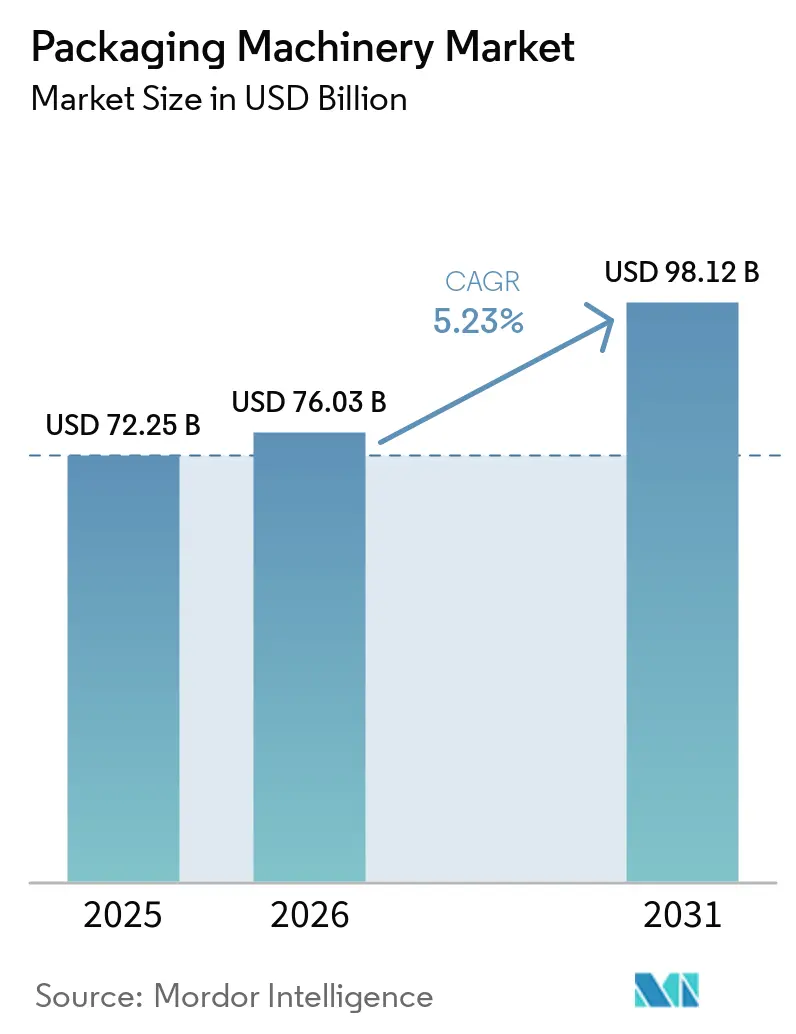
| Market Size (2026) | USD 76.03 Billion |
| Market Size (2031) | USD 98.12 Billion |
| Growth Rate (2026 - 2031) | 5.23 % |
| Fastest Growing Market | Middle East and Africa |
| Largest Market | Asia Pacific |
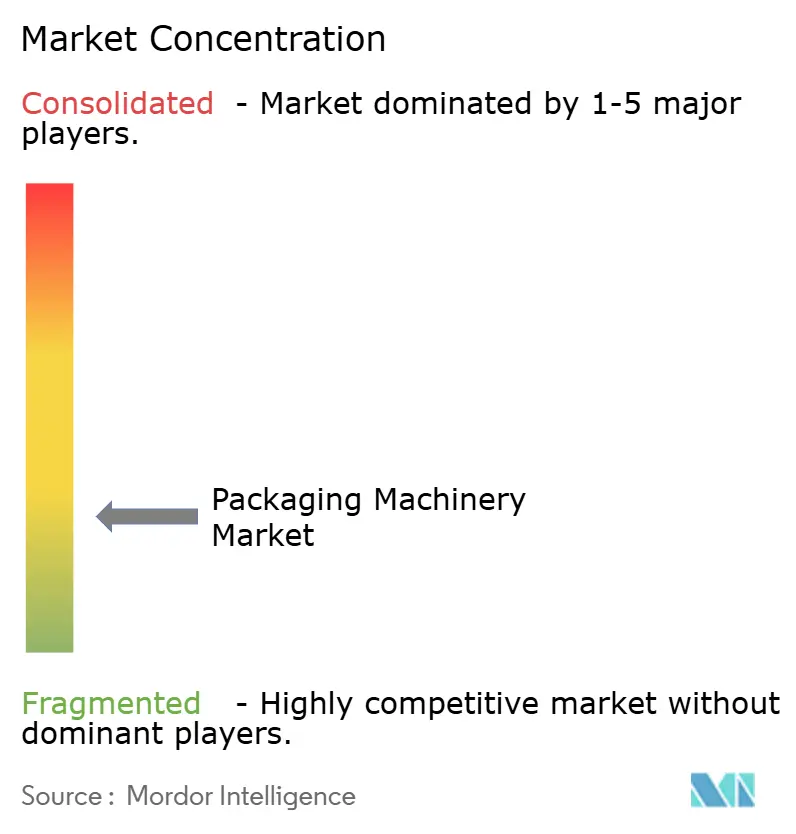
| Market Concentration | Low |
Major Players *Disclaimer: Major Players sorted in no particular order Image © Mordor Intelligence. Reuse requires attribution under CC BY 4.0. | |
Packaging Machinery Market Analysis by Mordor Intelligence
The packaging machinery market size in 2026 is estimated at USD 76.03 billion, growing from 2025 value of USD 72.25 billion with 2031 projections showing USD 98.12 billion, growing at 5.23% CAGR over 2026-2031. Surging capital investment in automated lines, rising demand for sustainable pack formats, and tightening serialization rules in pharmaceuticals continue to accelerate equipment upgrades. End-user industries are racing to deploy intelligent systems that cut labor, raise throughput, and gather real-time production data. Asia Pacific leads volume growth on the back of large-scale manufacturing expansion, whereas the Middle East and Africa record the fastest CAGR as governments channel funds into food and beverage processing capacity. Heightened M&A activity and modular design innovations are broadening solution portfolios, giving buyers more flexibility to tailor lines for emerging pack styles. The packaging machinery market faces near-term cost pressure from stainless-steel price swings, but most OEMs are offsetting this headwind by engineering lighter frames and adopting alternative alloys.
Key Report Takeaways
- By machine type, filling and dosing equipment held 20.08% of packaging machinery market share in 2025, while cartoning machinery is projected to grow at a 7.56% CAGR through 2031.
- By automation level, fully automatic and robotics-integrated systems captured 55.12% share of the packaging machinery market size in 2025 and will post an 7.78% CAGR.
- By technology platform, intelligent and connected packaging lines are advancing at an 8.52% CAGR even as conventional systems retain 45.10% revenue share.
- By end-user industry, food and beverage led with 42.05% share in 2025; pharmaceuticals will expand at a 6.49% CAGR to 2031.
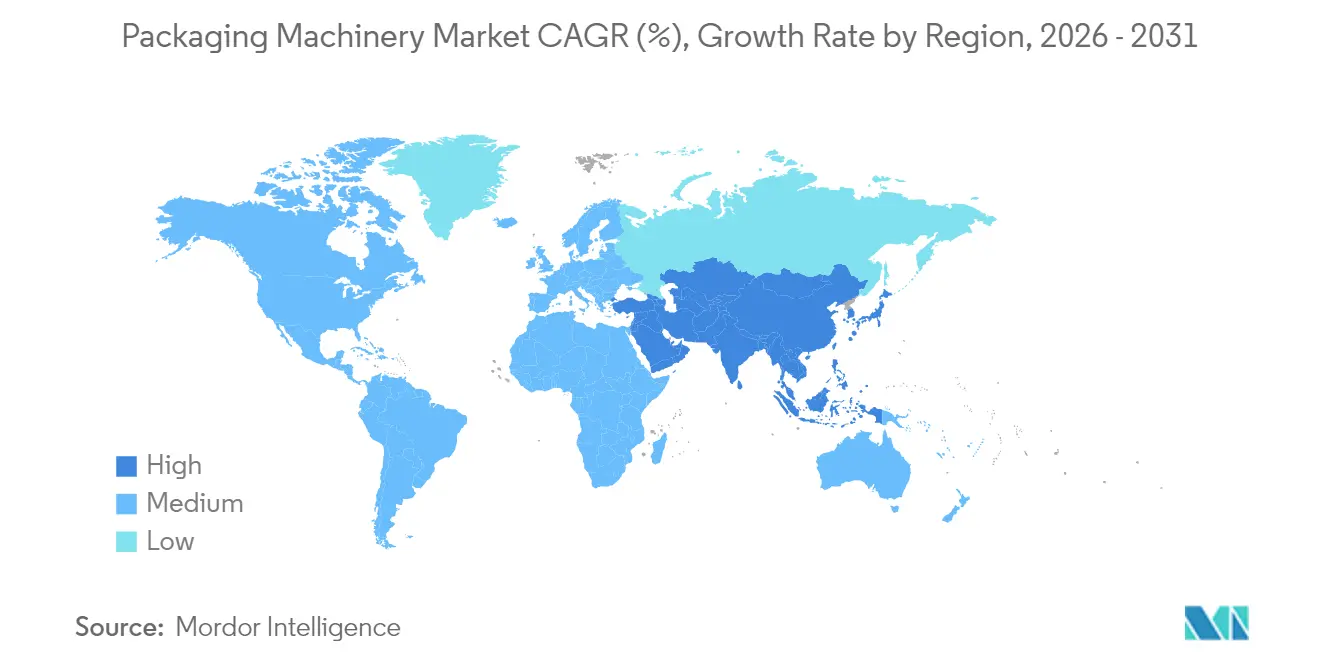
- By geography, Asia-Pacific commanded 45.72% of packaging machinery market share in 2025, whereas the Middle East and Africa will rise at a 6.08% CAGR.
Note: Market size and forecast figures in this report are generated using Mordor Intelligence’s proprietary estimation framework, updated with the latest available data and insights as of 2026.
Market Trends and Insights
Drivers Impact Analysis of Packaging Machinery Market*
| Driver | (~) % Impact on CAGR Forecast | Geographic Relevance | Impact Timeline |
|---|---|---|---|
| Expansion of flexibles and pouch formats driving high-speed filling lines | +1.2% | Global, APAC & North America | Medium term (2-4 years) |
| Rapid shift to sustainable paper-based packs in Europe necessitating new cartoning technologies | +0.8% | Europe, spillover North America | Short term (≤ 2 years) |
| E-commerce “ship-in-own-container” adoption boosting end-of-line automation in North America | +0.7% | North America, expanding Europe | Medium term (2-4 years) |
| Rising need for integrated packaging solutions | +0.9% | Global | Long term (≥ 4 years) |
| Pharma serialization mandates fueling global labelling and coding upgrades | +1.1% | Global, EU & USA | Short term (≤ 2 years) |
| Source: Mordor Intelligence | |||
Expansion of Flexibles and Pouch Formats Driving High-Speed Filling Lines
Flexible pack formats are spreading from snacks to beverages, forcing brand owners to install faster horizontal and vertical form-fill-seal platforms. New models such as Mespack’s UHS Performa deliver higher uptime and lower film waste, trimming unit costs while improving sustainability targets. [1]Mespack, “UHS Performa | Fastest Solution for Small Flat Pouch Packaging,” mespack.comSuppliers are embedding film-splicing modules that sustain continuous motion to raise overall equipment effectiveness. In APAC, consumer goods makers favor pouches to reach rural markets with lightweight packs that lower freight expenses. North American beverage firms are testing spouted pouches to differentiate premium juices, spurring demand for hygienic, high-speed dosing heads that handle viscous products.
Rapid Shift to Sustainable Paper-Based Packs in Europe Necessitating New Cartoning Technologies
Europe’s Packaging and Packaging Waste Regulation, effective February 2025, pushes companies to replace plastic secondary packs with recyclable paper structures. The transition has triggered a wave of cartoner retrofits that manage thinner board grades without compromising seal integrity. Diageo’s 90% paper bottle for Johnnie Walker validates strong brand interest in fiber solutions that cut carbon emissions nearly 47%. OEMs are refining blank handling systems, gluing stations, and vision-guided quality checks to ensure mono-material cartons reach line speeds equal to legacy plastic formats. The paper shift is cascading to North America as retailers adopt similar eco-scorecards for suppliers.
E-commerce “Ship-in-Own-Container” Adoption Boosting End-of-Line Automation in North America
Made-to-fit packaging mandates from major platforms and state laws are compelling shippers to embrace auto-case-erecting, right-sizing, and on-demand printing modules. Machine learning algorithms inside case formers now choose the smallest box that meets damage-prevention criteria, reducing void fill and slashing freight costs by up to 15%. Operators report labor cuts of 80% on repacking stations after installing fully enclosed robotic cells. Growth is strongest in frozen food, cosmetics, and small-electronics where product diversity is high. European adoption is accelerating as cross-border sales climb.
Rising Need for Integrated Packaging Solutions
Manufacturers seek single-source partners that bundle filling, cartoning, palletizing, and digital performance monitoring in a unified platform. Integrated lines simplify changeovers and shrink commissioning time, a priority as SKU counts rise. Suppliers are embedding OPC UA and PackML protocols to connect disparate modules to common MES layers, enabling predictive maintenance and real-time OEE dashboards. Chemical and household cleaners lines are early adopters because they process multiple bottle and cap formats each shift. In the long term, plug-and-play architectures will dominate new plant builds.
Restraints Impact Analysis of Packaging Machinery Market*
| Restraint | (~) % Impact on CAGR Forecast | Geographic Relevance | Impact Timeline |
|---|---|---|---|
| Surge in stainless-steel prices inflating capital cost of high-hygiene machinery | -0.6% | Global, Europe & North America | Short term (≤ 2 years) |
| Lengthy IQ/OQ validation cycles slowing pharma equipment orders in USA | -0.4% | USA, spillover regulated markets | Medium term (2-4 years) |
| Skill gaps in robot programming hindering SME automation in LATAM | -0.3% | Latin America | Long term (≥ 4 years) |
| Power reliability issues elevating operating costs for African bottlers | -0.2% | Africa | Medium term (2-4 years) |
| Source: Mordor Intelligence | |||
Surge in Stainless-Steel Prices Inflating Capital Cost of High-Hygiene Machinery
Nickel price volatility has pushed stainless-steel quotes toward the upper USD 700-800 per ton range, squeezing margins on wash-down fillers, aseptic blocs, and pharma lines. [2]Damstahl, “November 2024 Stainless Steel Market Trends,” damstahl.comOEMs are redesigning frames with hybrid alloys and strategic reinforcement to curb weight without sacrificing rigidity. Some buyers delay purchase decisions, opting for refurbishments until metal markets stabilize. European suppliers hedge costs with long-term steel contracts but pass a portion to customers through surcharges. The inflationary effect is most severe for dairy and infant-formula plants that must meet 316L specs.
Lengthy IQ/OQ Validation Cycles Slowing Pharma Equipment Orders in USA
Complexity of installation and operational qualification has grown as packaging lines integrate robotics, vision, and digital twins. Facilities often allocate 6-9 months for full validation, postponing revenue recognition for OEMs. Upcoming FDA Quality Management System Regulation may harmonize some requirements with ISO 13485, yet manufacturers still need comprehensive documentation, risk files, and software validation. [3]The FDA Group, “A Basic Guide to IQ, OQ, PQ in FDA-Regulated Industries,” thefdagroup.comTo ease the burden, service firms now offer turnkey IQ/OQ support packages, though those costs add to project budgets and can push return-on-investment horizons.
*Our forecasts treat driver/restraint impacts as directional, not additive. The impact forecasts reflect baseline growth, mix effects, and variable interactions.
Packaging Machinery Market Segment Analysis
By Machine Type:
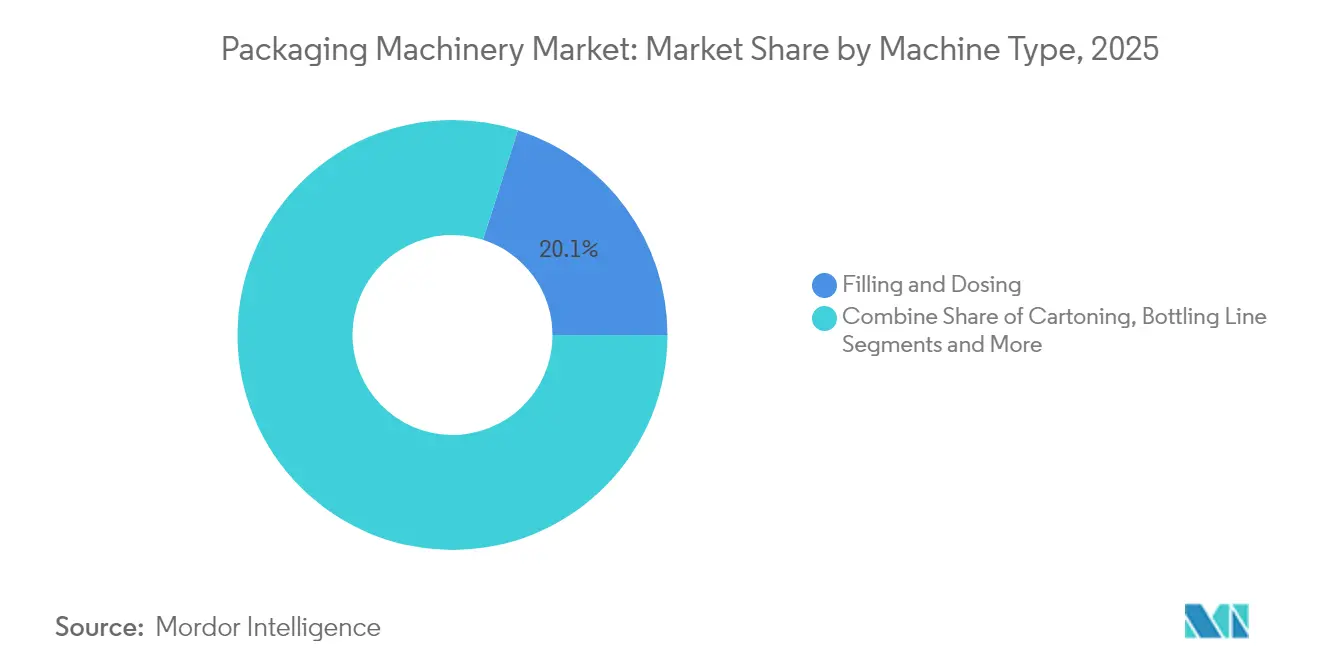
Cartoning Leads Innovation WaveIn 2025, filling and dosing equipment accounted for 20.08% of packaging machinery market share, underscoring its indispensability across food, beverage, and pharma lines. Cartoning units, however, are advancing at a 7.56% CAGR, benefitting from Europe’s shift to paper formats and e-commerce demand for robust secondary packs. GEA’s compact thermoforming cartoner for SMEs highlights how suppliers target smaller plants with plug-and-play solutions. Cartoners now include servo-controlled blank feeders that handle recycled board with high dimensional variability. Meanwhile, the packaging machinery market size linked to labelling and coding systems is expanding steadily as traceability rules tighten.
The blister, thermoforming, and vacuum equipment niche focuses on barrier-enhancing films that lengthen shelf life for meat and ready meals. Bottling line demand remains resilient, driven by premium water and functional drinks growth. Palletizing systems gain traction from warehouse automation programs that favor end-of-line robotic cells over manual stretch-wrap turntables. Upgrades in wrapping and bundling machines center on variable-format technology that optimizes film usage, aligning with sustainability targets.


By Automation Level:
Robotics Integration AcceleratesFully automatic and robotics-integrated lines captured 55.12% of packaging machinery market size in 2025 and will compound at 7.78% through 2031. Rapid payback stems from labor savings, higher OEE, and improved hygiene. Pharmaceutical vial handling illustrates the benefits – TM Robotics’ QPack-1 processes 7,200 vials per hour versus 2,000 in manual set-ups, cutting contamination risks. Semi-automatic lines remain relevant where producers phase upgrades in stages or manage short runs. Manual stations persist in artisanal or low-volume operations across Africa and parts of Southeast Asia. Robotics adoption is also spreading to case packing and palletizing, where vision-guided pick heads enable mixed-SKU layering.
Driven by labor shortages, the packaging machinery market is witnessing a boom in user-friendly programming suites that allow rapid recipe changes without coding knowledge. Predictive maintenance analytics further reduce unplanned downtime, pushing many operators to retrofit legacy machines with sensor kits before committing to full line replacements.
By End-User Industry:
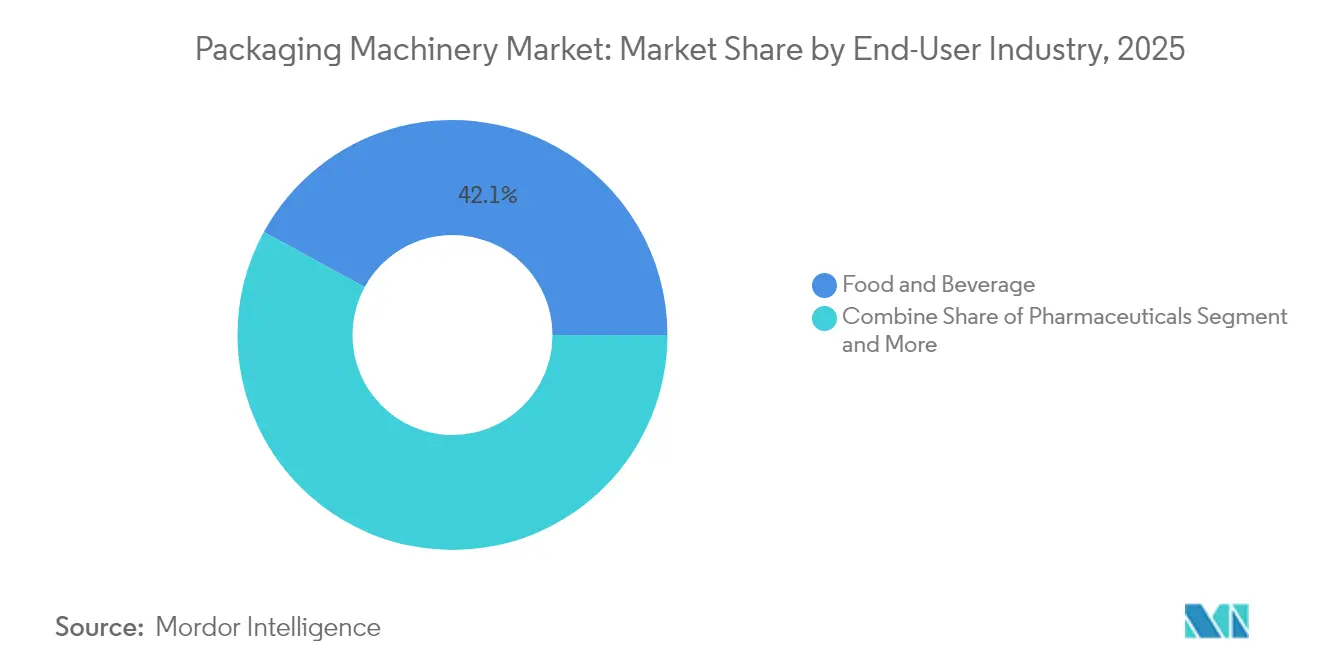
Pharmaceuticals Drives Future GrowthFood and beverage applications held 42.05% of packaging machinery market share in 2025 owing to their large installed base and continuous product churn. The pharmaceutical sector is forecast to post a 6.49% CAGR, lifted by aging demographics and vaccine production expansion. Syntegon’s MLD Advanced filler, capable of 400 ready-to-use syringes per minute, demonstrates the precision and speed now expected. Cosmetics brands invest in automated mascara lines that slash headcount while boosting throughput; this shift underscores how aesthetic packaging is no longer exempt from industrial efficiency measures. Industrial chemicals require explosion-proof and corrosion-resistant designs, creating a specialized but stable demand stream.
Across every user vertical, sustainability targets drive package lightweighting and recyclability, influencing machine design parameters from forming temperatures to adhesive selection. Growing SKUs also compel rapid changeover capabilities, reinforcing demand for flexible servo platforms.
By Technology Platform:
Connected Systems Transform OperationsConventional systems still commanded 45.10% revenue in 2025, yet intelligent lines featuring QR and RFID tracking will grow at 8.52% CAGR. Brand owners embrace GS1’s global QR transition that promises richer consumer engagement and granular supply-chain visibility. Equipment suppliers now embed scanners and cloud gateways for inline data capture without slowing throughput. The packaging machinery industry is also seeing investment in modified-atmosphere and vacuum systems that extend shelf life as retailers combat food waste. Aseptic lines cater to high-margin nutraceutical drinks and sterile pharma fluids, justifying higher capital outlays with extended product safety windows.
Predictive analytics modules in connected fillers alert maintenance teams before failures occur, cutting downtime by up to 20%. RFID-enabled labels approved for PET recycling, such as Avery Dennison’s latest launch, integrate sustainability with digitization, reinforcing the business case for intelligent packaging lines.
Geography Analysis
APAC Packaging Machinery Market
Asia Pacific accounted for 45.72% of packaging machinery market share in 2025, propelled by China’s scale and India’s rising packaged-goods consumption. Regional suppliers displayed over 2,500 automation exhibits at ProPak China 2025, showcasing AI-driven inspection and logistics integration. Japan and South Korea contribute high-precision robotics, while Indonesia hosts new flexible packaging plants that serve regional snack and noodle brands. The packaging machinery market size in Asia Pacific is further backed by government incentives for smart manufacturing and Industry 4.0 adoption.
MEA Packaging Machinery Market
The Middle East and Africa record the fastest 6.08% CAGR through 2031 as Saudi Arabia, Egypt, and South Africa localize beverage and dairy processing. Sidel’s agreement with Saudi stakeholders illustrates state-supported moves to reduce import dependence. Nonetheless, chronic power outages in parts of Sub-Saharan Africa raise operating costs, prompting producers to install solar arrays and energy-efficient motors. Equipment vendors partner with local integrators to navigate import duties and service challenges.
The Americas and Europe Packaging Machinery Market
North America retains strong demand due to e-commerce fulfillment centers investing in end-of-line automation. U.S. shipments climbed 5.8% in 2023 to USD 10.9 billion, reflecting sustained capital replacement cycles. Canada’s food processors adopt robotic case packers to offset labor shortages, while Mexico attracts investment from multinational beverage firms establishing regional hubs. Europe focuses on sustainability compliance, driving high uptake of recyclable-ready cartoners and mono-material pouch lines. South America shows growth pockets in Brazil and Colombia, though skills shortages in robot programming slow adoption among smaller converters.

Regulatory Landscape
Across major markets, packaging machinery suppliers are being pulled deeper into compliance covering machine safety, packaging sustainability performance, and traceability data. In the European Union, Regulation (EU) 2023/1230 (Machinery Regulation) sets essential health and safety requirements for machinery placed on the EU market, with full application from 20 January 2027, affecting risk assessment, guarding, controls, and documentation for packaging equipment.
Packaging sustainability rules are also reshaping equipment requirements through customer compliance needs. The EU Packaging and Packaging Waste Regulation (PPWR), Regulation (EU) 2025/40, applies from 12 August 2026, strengthening recyclability, labeling, and life-cycle requirements for packaging and increasing demand for machinery that can run mono-material, recyclable, and lightweight formats without compromising line efficiency. In the United States, FDA FSMA traceability requirements (Section 204(d)) have an extended compliance date of July 20, 2028, while FDA food-contact frameworks (21 CFR Parts 174-186) continue to govern materials and components that may contact food, supporting upgrades in coding, labeling, and digital recordkeeping integration on packaging lines.
Competitive Landscape
The market shows moderate Fragmentation. Global leaders Tetra Laval, Krones, and Coesia combine filling, labeling, and end-of-line solutions under one service umbrella. Their scale advantages include global parts networks and R&D budgets that foster AI-powered condition-monitoring platforms. Acquisitions remain central: Smurfit Kappa absorbed WestRock for USD 12.7 billion, expanding paperpack machinery capability, and Amcor secured Berry Global for USD 8.4 billion to widen flexible material systems.
ProMach completed four deals in 2024, including HMC Products, to enlarge its pouching footprint, then formed a Wine & Spirits Solutions Group in 2025 to bundle sector-specific expertise. MULTIVAC’s majority stake in Italianpack added traysealers for fresh food. Equipment makers also form technology alliances; TM Robotics partners with vision-suite providers so clients receive pre-validated cells.
Competition increasingly revolves around sustainability features, energy consumption, and digital ecosystem compatibility rather than mere mechanical speed. Mid-tier regional specialists survive by offering custom tooling for local pack formats and faster service response. OEMs that demonstrate validated compliance with FDA QMSR or EU MDR gain preference in regulated industries.
Packaging Machinery Industry Leaders
Robert Bosch GmbH
Coesia S.p.A.
Krones Inc.
Tetra Pak International S.A
Graphic Packaging International, LLC
- *Disclaimer: Major Players sorted in no particular order
Packaging Machinery Market Companies Covered in this Report
- Tetra Laval Group (Sidel, Tetra Pak)
- Krones AG
- Coesia S.p.A.
- Syntegon Technology GmbH
- IMA Group S.p.A.
- Barry-Wehmiller Companies Inc.
- MULTIVAC Group
- Ishida Co. Ltd.
- SACMI Imola SC
- Graphic Packaging International LLC
- Marchesini Group S.p.A.
- Aetna Group (ROBOPAC)
- ABB Ltd. (Robotics Packaging)
- Fanuc Corp.
- ProMach Inc.
- Bradman Lake Ltd.
- Signode Industrial Group
- KHS GmbH
- Mitsubishi Electric Corp. (Palletizers)
- FUJI MACHINERY CO.,LTD.
- Sidel Group
- Optima Packaging Group
- PacTech Holdings
- Echo Machinery
- Herma GmbH (Labelling)

Market Opportunities and Future Outlook
Demand-side sustainability and digitalization programs are turning into concrete opportunities for machinery upgrades, particularly where new pack materials strain legacy handling. Europe provides a clear anchor, since the EU PPWR applies from 12 August 2026 and brand moves toward fiber and recyclable formats are increasing the need for cartoning, case handling, and end-of-line systems that can work with thinner or more variable substrates under tighter quality inspection. On the technology side, intelligent and connected line architectures (QR/RFID, inline inspection, and predictive maintenance) fit the market shift toward integrated solutions using standards such as OPC UA and PackML, supporting lower downtime while meeting traceability and reporting requirements.
In parallel, 2026 capacity actions by packaging ecosystem players reinforce demand for line modernization and localization. Comexi inaugurated a 5,000 square meter expansion in Girona, Spain (capacity increase of over 40%), KHS began construction of a 4,300 square meter hall for its barrier technology product center in Hamburg with investment exceeding EUR 11 million, and Amcor started construction of a 7,000 square meter manufacturing facility and automated warehouse in Dongguan, China. These steps are tied to higher throughput and newer material structures (including barrier and recyclable-ready formats), which in turn support adjacent demand for new or retrofitted converting and packaging lines, such as filling/dosing, labeling/coding, cartoning, and end-of-line automation designed for broader SKU mixes and stricter quality control.
Recent Industry Developments in Packaging Machinery Market
- July 2026: Amcor commenced construction of a 7,000 square meter manufacturing facility and automated warehouse in Dongguan, China. The expansion adds automation-heavy capability that raises requirements for downstream packaging line compatibility, including faster changeovers, standardized interfaces, and data connectivity for material and quality tracking.
- May 2025: ProMach formed a Wine and Spirits Solutions Group to provide dedicated processing, packaging, and systems integration offerings for the category. The move strengthens vertical-specific line integration and accelerates bundled equipment upgrades for producers needing flexible formats and rapid SKU changeovers.
- April 2025: Syntegon launched the MLD Advanced pharmaceutical filling machine for ready-to-use nested syringes, with outputs up to 400 syringes per minute and enhanced in-process control. Higher-speed sterile filling supports pull-through demand for complementary inspection, labeling, and serialization-capable downstream equipment on regulated packaging lines.


Packaging Machinery Market Report Scope and Research Methodology
Market Definition and Coverage
This market covers revenue generated from packaging machinery sold for industrial packaging operations, including equipment used to form, fill, seal, label, code, wrap, case-pack, and palletize packs across end-use industries.
Scope exclusions: We exclude packaging materials and consumables, general purpose factory automation not dedicated to packaging lines, and most non-equipment services unless they are bundled with machinery deliveries.
Segments Covered in This Report
- By Machine Type
- Filling and Dosing
- Labelling, Decorating, and Coding
- Case Handling
- Bottling Line
- Cartoning
- Palletizing and Depalletizing
- Wrapping and Bundling
- Blister / Thermoforming / Skin / Vacuum Packaging
- Other Machine Type
- By Automation Level
- Manual
- Semi-Automatic
- Fully Automatic / Robotics-Integrated
- By End-User Industry
- Food
- Beverages
- Pharmaceuticals
- Cosmetics and Personal Care
- Industrial Chemicals
- Other End-use Industry
- By Technology Platform
- General Packaging (Conventional)
- Modified Atmosphere Packaging (MAP)
- Vacuum Packaging
- Aseptic Packaging Lines
- Intelligent / Connected (QR / RFID-Enabled) Packaging Lines
- By Geography
- North America
- United States
- Canada
- Mexico
- Europe
- Germany
- United Kingdom
- France
- Italy
- Spain
- Russia
- Rest of Europe
- Asia-Pacific
- China
- India
- Japan
- South Korea
- Australia and New Zealand
- Rest of Asia-Pacific
- Middle East and Africa
- Middle East
- United Arab Emirates
- Saudi Arabia
- Turkey
- Rest of Middle East
- Africa
- South Africa
- Nigeria
- Egypt
- Rest of Africa
- Middle East
- South America
- Brazil
- Argentina
- Rest of South America
- North America
Data Sources, Market Sizing, and Validation
Desk Research
Desk research was used to set the outer boundaries of demand and to keep assumptions realistic across regions. We reviewed public and official sources such as UN Comtrade trade statistics, World Bank and IMF macro series, OECD industrial indicators, and US Census Bureau manufacturing and trade releases, plus selected Eurostat datasets where relevant.
To connect machinery demand to real industry activity, we also referenced PMMI publications, sector association releases, company annual reports and investor presentations, and business press that tracks capex cycles. In parallel, we used paid subscriptions for company financials and news intelligence, patent databases to sense automation and design change, and shipment-level import and export databases to sanity-check equipment movement patterns. These examples are not exhaustive, and other sources were also used to collect data, validate assumptions, and clarify open questions.
Primary Interviews and Surveys
Primary work focused on validating what gets bought, when it gets replaced, and how pricing changes as automation levels move on packaging lines. We interviewed a mix of machinery manufacturers, component suppliers, system integrators, distributors, and large end users across APAC, EMEA, and the Americas, so gaps from desk research could be filled and the final assumptions cross-checked.
Distribution of primary research fieldwork respondents
| Company type | Respondent position | Region |
|---|---|---|
| Top tier: 27% | CXOs: 15% | APAC: 42% |
| Mid tier: 51% | Functional/Unit leaders: 30% | EMEA: 31% |
| Smaller Players: 22% | Managers: 55% | Americas: 27% |
Market-Sizing & Forecasting
Our sizing starts with a top-down build that links packaging line investment to end-market output and packaging intensity, then translates that demand into equipment spend using typical line configurations. We corroborate the totals with selective bottom-up approximations, such as sampled supplier revenue pools, distributor channel checks, and an ASP times volume view for higher-volume machine categories, which we use to adjust outliers.
Key model inputs include packaged food and beverage volumes, pharma production and compliance-driven line upgrades, regional manufacturing capex indicators, installed-base replacement cycles, and observable automation penetration in new lines. Pricing is handled through a practical ASP progression that reflects steel and component cost swings, higher servo and control content, and mix shifts toward higher-throughput lines. For forecasting, we use scenario analysis supported by primary feedback on order backlogs, lead times, and planned capacity additions, followed by region-level demand normalization when data coverage is uneven.
Data Validation & Update Cycle
Validation is done through multiple checks before sign-off, and we look for variance that can be explained with real market signals rather than only model tuning. Outputs are compared against independent indicators such as trade flows for machinery categories, capex direction in large end-user industries, and visible order cycle patterns reported by suppliers, and then anomalies are reviewed in an internal analyst pass.
When a mismatch is too large, we revisit assumptions and re-contact relevant experts to confirm whether the change is structural or temporary. Reports are refreshed annually, with interim updates when material events occur, and a final pre-delivery review is completed so clients receive the latest updated view.
Mordor Intelligence's Global Packaging Machinery Market Size Measured Against Other Published Estimates
Published market numbers for packaging machinery often differ because the underlying evidence being tracked is not the same, even when the market title looks identical. Variations usually come from what counts as machinery revenue versus services, how used equipment is treated, and whether adjacent processing equipment is blended into the total.
Shipment and trade movement signals, paired with replacement-cycle checks from industry interviews, are the evidence that anchors Mordor Intelligence to a machinery-only demand pool and keeps the 2026 value aligned with real buying patterns. When another estimate uses a narrower geography, relies on shipments instead of revenue, or applies different currency timing, it can look higher or lower without necessarily implying a change in demand.
Benchmark comparison
| Source | Market Size | Gaps in Research Methodology |
|---|---|---|
| Mordor Intelligence | USD 76.03 B (2026) | |
| Industry Association A | USD 10.90 B (2023) | This figure reflects US machinery shipments in a single year, which narrows geography and tracks shipment value rather than global equipment revenue across end-use industries. |
| Industry Association B | USD 11.30 B (2024) | This estimate is reported as US market sales for 2024, and it is not directly comparable to a global scope because regional mix, import content, and year selection shift the total. |
The table shows that most of the spread is created by scope and measurement choices, not only growth assumptions. By keeping definitions tight around packaging machinery revenue and validating with observable demand signals and interview-led cycle checks, the final number remains traceable for planning.


Key Questions Answered in the Report
What is the current size of the packaging machinery market?
The packaging machinery market is valued at USD 76.03 billion in 2026.
How fast is the packaging machinery market expected to grow?
It is forecast to expand at a 5.23% CAGR to reach USD 98.12 billion by 2031.
Which region holds the largest packaging machinery market share?
Asia Pacific leads with 45.72% share in 2025, driven by China and India.
Which machine type is growing the fastest?
Cartoning machinery is projected to rise at a 7.56% CAGR through 2031 due to sustainable paper packaging and e-commerce demands.
Why is pharmaceutical packaging equipment in high demand?
Serialization mandates and increased healthcare spending push pharma companies to install advanced filling, labeling, and coding lines.
What is driving investment in intelligent and connected packaging lines?
QR and RFID integration enable real-time traceability and consumer engagement, making connected systems the fastest-growing technology platform at an 8.52% CAGR.
Page last updated on:


 Your data is secure and never sold or shared.


