
Online Simulation Games Market Size and Share
Market Overview
| Study Period | 2020 - 2031 |
|---|---|
| Market Size (2026) | USD 10.53 Billion |
| Market Size (2031) | USD 19.47 Billion |
| Growth Rate (2026 - 2031) | 13.09 % |
| Fastest Growing Market | Middle East and Africa |
| Largest Market | Asia Pacific |
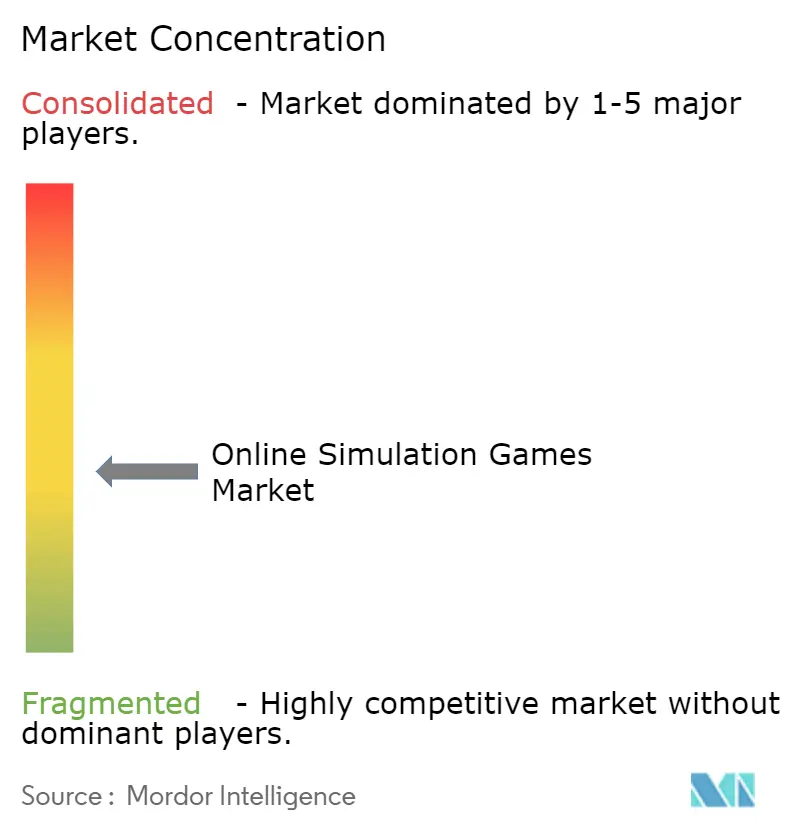
| Market Concentration | Medium |
Major Players *Disclaimer: Major Players sorted in no particular order Image © Mordor Intelligence. Reuse requires attribution under CC BY 4.0. | |
Online Simulation Games Market Analysis by Mordor Intelligence
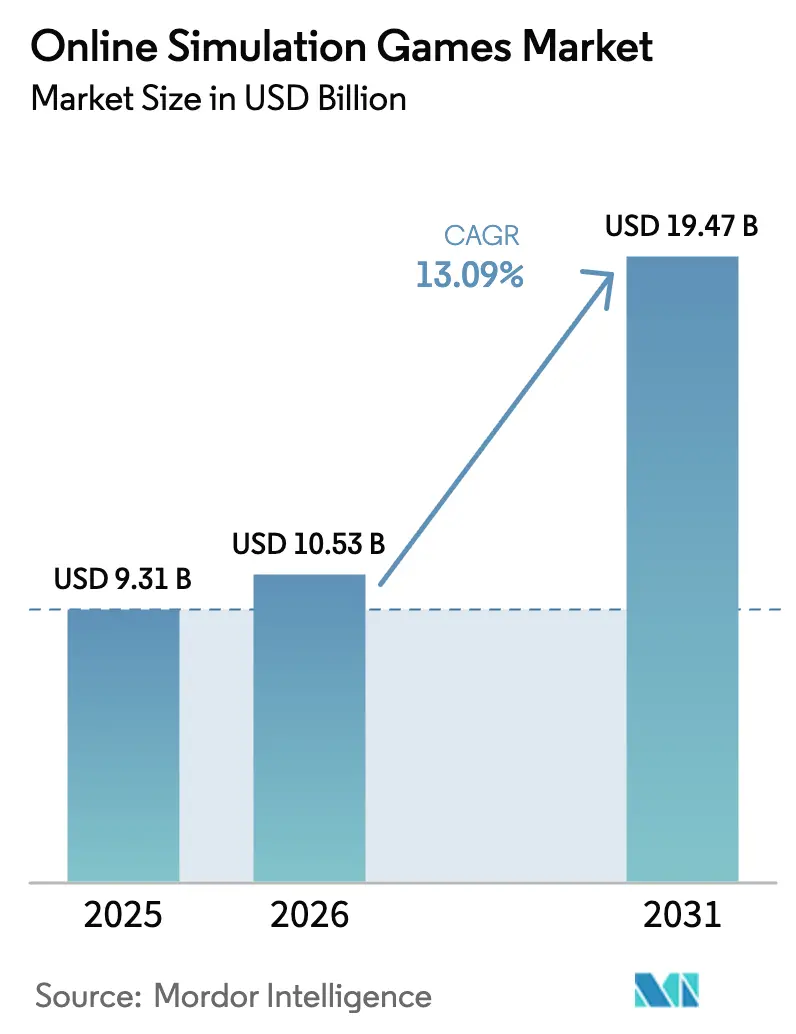
The online simulation games market size in 2026 is estimated at USD 10.53 billion, growing from 2025 value of USD 9.31 billion with 2031 projections showing USD 19.47 billion, growing at 13.09% CAGR over 2026-2031. Robust spending on photorealistic physics engines, growing cross-platform adoption, and the convergence of entertainment with professional training keep the growth curve steep. Advanced cloud infrastructure is reducing latency and hardware barriers, widening the user pool from dedicated PC players to casual mobile segments. Publisher consolidation, led by Microsoft’s post-Activision strategy, is concentrating intellectual property and talent pools, even as it extends smaller studios’ reach into premium distribution networks. Meanwhile, generative AI is reshaping design pipelines; 62% of studios already use it to generate worlds and assets, compressing development timelines and costs. Regulatory headwinds around loot boxes in Europe are prompting a pivot toward subscriptions and hybrid revenue models that can better withstand compliance scrutiny.
Key Report Takeaways
- By platform, Mobile captured 59.40% of the online simulation games market in 2025; VR/AR devices post the fastest growth at a 19.45% CAGR to 2031.
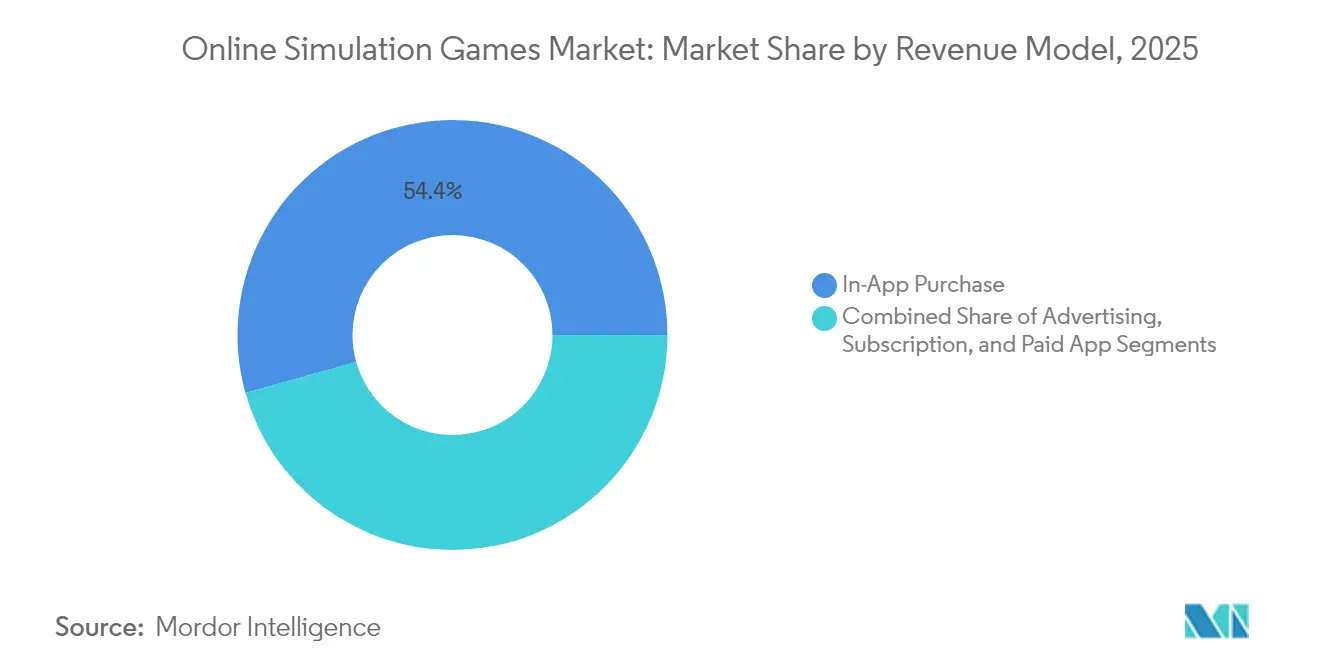
- By revenue model, In-App Purchases held 54.35% share of the online simulation games market size in 2025, while subscriptions are advancing at a 15.55% CAGR between 2026-2031.
- By game type, Life Simulation commanded 34.60% share of the online simulation games market in 2025; Training & Education simulations are set to grow at an 17.62% CAGR to 2031.
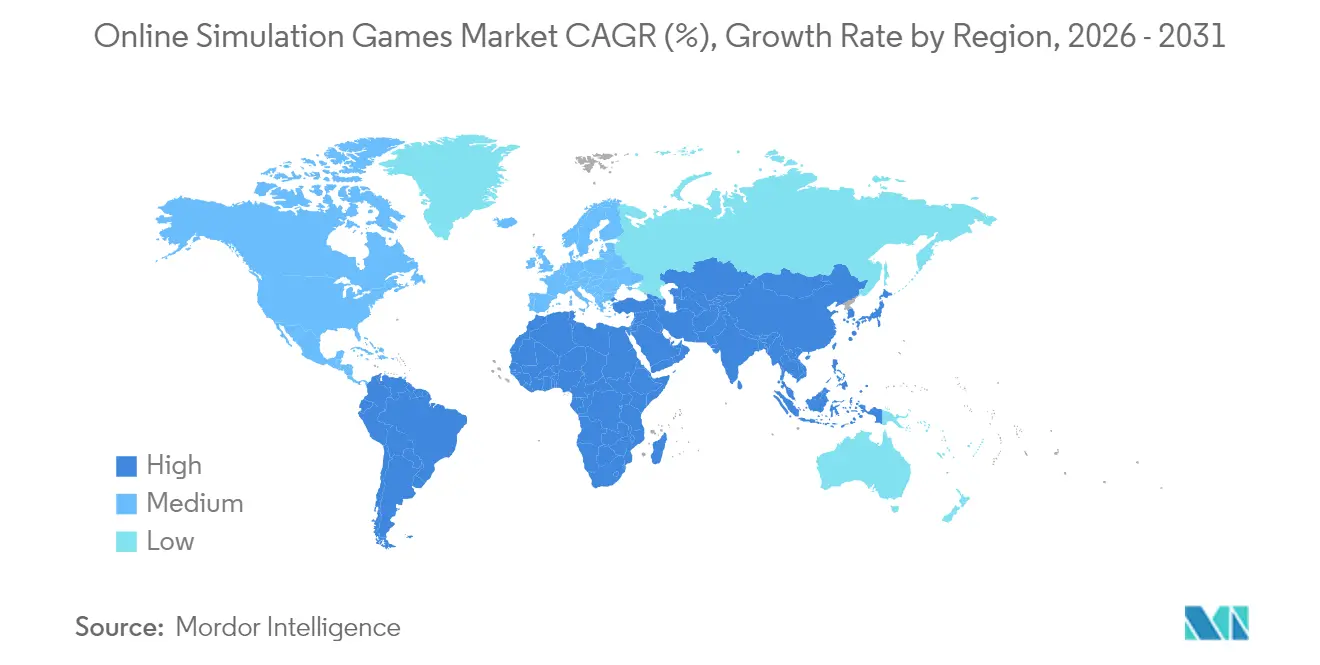
- By geography, Asia-Pacific led with 44.70% of online simulation games market share in 2025, while the Middle East & Africa region is projected to expand at an 17.62% CAGR through 2031.
Note: Market size and forecast figures in this report are generated using Mordor Intelligence’s proprietary estimation framework, updated with the latest available data and insights as of 2026.
Global Online Simulation Games Market Trends and Insights
Drivers Impact Analysis*
| Driver | (~) % Impact on CAGR Forecast | Geographic Relevance | Impact Timeline |
|---|---|---|---|
| Rise in mobile-first gaming uptake across emerging Asian markets | +3.2% | Asia-Pacific; spillover to Middle East & Africa | Medium term (2-4 years) |
| Growth of cloud gaming infrastructure enabling low-latency simulations in North America | +2.5% | North America; Europe | Medium term (2-4 years) |
| Integration of generative AI for real-time world-building boosting player engagement | +2.8% | Global; early adoption in North America & Europe | Short term (≤ 2 years) |
| Expansion of esports broadcasting rights for simulation titles in Europe | +1.9% | Europe; North America; East Asia | Medium term (2-4 years) |
| Government-backed digital economy initiatives fueling indie simulation studios in South America | +1.5% | South America (Brazil, Argentina, Chile) | Long term (≥ 4 years) |
| Increasing adoption of VR flight & driving simulators for training in the Middle East | +1.8% | Middle East; North Africa | Medium term (2-4 years) |
| Source: Mordor Intelligence | |||
Rise in Mobile-First Gaming Uptake across Emerging Asian Markets
Mobile downloads touched 4.2 billion in Southeast Asia during H1 2024, with Indonesia alone contributing 41%.[1] Spending willingness now exceeds 60% across Indonesia, Malaysia, and Thailand, motivating publishers to localize content and lean on culturally resonant food- and sports-themed simulations. Expanding 5G coverage is unlocking complex physics previously limited to PCs, reinforcing the online simulation games market’s mobile dominance in the region. Studios exploiting these conditions gain rapid scale without high upfront console or PC marketing costs.
Growth of Cloud Gaming Infrastructure Enabling Low-Latency Simulations in North America
Edge-based architectures such as AccelByte’s Multiplayer Servers integrated with Microsoft Azure now offer diverse virtual-machine families tuned for simulation workloads.[2] CableLabs’ Low Latency DOCSIS further trims lag, letting bandwidth-heavy flight or city-building simulations run flawlessly over ordinary connections. By abstracting performance away from end-user hardware, developers unlock new regions where high-spec GPUs remain scarce, broadening the online simulation games market addressable base.
Integration of Generative AI for Real-Time World-Building Boosting Player Engagement
Krafton’s inZOI launched in March 2025 with AI-driven non-player characters and tools that convert 2D images into playable 3D assets, selling 1 million copies in its first week. Players now expect emergent stories instead of predefined quests, pushing designers to supply infinite variables. Production pipelines that once required months of manual asset creation now complete tasks in days, accelerating updates that keep the online simulation games market cycling fresh content. AI also localizes dialogue on demand, shrinking time-to-enter for new territories and fueling retention metrics that justify subscription pricing.
Expansion of esports broadcasting rights for simulation titles in Europe
European media contracts for simulation esports gain value as viewership grows alongside a regional esports sector projected to exceed USD 1 billion in 2025.[3] The Olympic Esports Games, debuting in Saudi Arabia, place flight, farming, and motorsport simulators on a global stage. Broadcast exposure recruits new players who identify with real-world sports yet seek interactive control. Publishers monetize through sponsorship overlays and tournament passes, diversifying the online simulation games market away from dependence on microtransactions.
Restraints Impact Analysis*
| Restraint | (~) % Impact on CAGR Forecast | Geographic Relevance | Impact Timeline |
|---|---|---|---|
| High GPU demand outpacing supply, inflating hardware costs for PC simulations | -1.7% | North America, Europe | Short term (≤ 2 years) |
| Stringent loot-box regulations in Europe curtailing monetization options | -1.2% | Europe, spillover to North America | Medium term (2-4 years) |
| Bandwidth limitations in rural Africa hindering real-time multiplayer experiences | -0.8% | Select African & South American rural areas | Long term (≥ 4 years) |
| Rising development costs for photorealistic physics engines | -1.5% | Global independent studios | Medium term (2-4 years) |
| Source: Mordor Intelligence | |||
High GPU demand outpacing supply, inflating hardware costs for PC simulations
Nvidia’s 86% share in discrete gaming GPUs gives shortages direct influence on retail prices.[4] Consumers postpone upgrades, shrinking the premium PC slice of the online simulation games market size. Developers downscale texture packs or add cloud-rendered modes that shift compute to data centers. While streaming bridges the gap, it diverts spending toward platform fees and leaves razor-thin margins for titles reliant on fixed hardware sales.
Stringent loot-box regulations in Europe curtailing monetization options
The European Commission’s 2025 enforcement action against youth-targeted in-game sales adds disclosure rules and age ratings. Belgium’s prohibition already set precedent; Germany now flags titles containing loot boxes at point of sale. Studios redesign reward loops into transparent probability tables or switch to season passes. Diversification protects revenue but prolongs user acquisition costs, placing pressure on smaller developers and tightening liquidity in the online simulation games industry.
*Our forecasts treat driver/restraint impacts as directional, not additive. The impact forecasts reflect baseline growth, mix effects, and variable interactions.
Segment Analysis
By Revenue Model: Subscription momentum reshapes spending patterns
In-app purchases delivered 54.35% of 2025 revenue, reflecting their low entry barrier and impulse-driven psychology. The online simulation games market size for subscriptions is forecast to expand at a 15.55% CAGR from 2026-2031 as studios value predictable cash flow. Loot-box regulation accelerates that migration, and hybrid structures emerge where optional microtransactions supplement monthly passes. Advertising spend in simulation titles increased 26.7% year over year, fueled by rewarded-video formats that maintain engagement without paywalls. Paid download models persist among niche aircraft or industrial simulators that serve professional communities willing to invest upfront.
Higher annual retention correlates with subscription bundles that include exclusive expansion packs and cross-platform cloud saves. Loyalty metrics demonstrate that users enrolled longer than twelve months average 42% more playtime, evidence that predictable updates secure mindshare. As telecom operators bundle game subscriptions into data plans, the online simulation games market broadens into demographics previously price sensitive.

By Platform: VR/AR immersion challenges mobile supremacy
Mobile owns 59.40% of current volume due to widespread smartphone penetration and app-store convenience. Yet headset prices dipped below USD 400 in 2025, pushing VR/AR sales forward at a 19.45% CAGR. Smaller form factors and inside-out tracking lower motion sickness rates, attracting casual audiences to driving and flight simulators. Cloud streaming extends console-grade visuals to Chromebooks and smart TVs, merging platform boundaries.
PC retains loyal modding communities that extend life cycles for city-building and farming titles, preserving a lucrative, if niche, corner of the online simulation games market. Consoles supply standardized hardware targets, simplifying optimisation and assuring stable frame rates. Cross-play participation grew 40% in 2024 as studios commit to universal matchmaking pools, reducing fragmentation and maximizing reach.
By Game Type: Training & Education surges as enterprises adopt gamified learning
Life Simulation titles held 34.60% of revenue in 2025, spanning social sandboxes where player-generated content drives virality. Corporate interest pushes Training & Education simulation forward at an 17.62% CAGR. Aviation academies integrate extended-reality flight modules that regulators accept as loggable hours, cutting operational costs. Medical schools employ patient-diagnosis scenarios to practice rare conditions without clinical risk.
Vehicle Simulation advances with physics that approximate real telemetry to within single-digit variance, earning endorsements from professional bodies. Construction & Management simulators migrate into classroom lesson plans, fostering strategic thinking in engineering curricula. Sports Simulation retains a steady fan base, amplified by esports leagues that sync game patches with real-season calendars, keeping athletes and viewers aligned.
Geography Analysis
Asia-Pacific contributes the largest slice of the online simulation games market, holding 44.70% of 2025 revenue. China, Japan, and South Korea supply high-ARPU users, while Indonesia, Thailand, and Malaysia drive install volumes after mobile downloads reached 4.2 billion in early 2024. Local publishers adopt language packs and culturally themed assets to extend average session length and in-app purchase depth.
The Middle East & Africa region charts the fastest trajectory with an expected 17.62% CAGR to 2031, propelled by sovereign investment funds allocating capital to gaming accelerators and esports arenas. The National Gaming & Esports Strategy in Saudi Arabia outlines job-creation and studio-incubation targets that integrate simulation IP into tourism and education initiatives. Infrastructure rollouts of fiber and 5G networks shrink latency, aligning region-wide with global competitive standards for online titles.
North America maintains technical leadership in cloud delivery and AI tooling, recording USD 2 billion in mobile simulation revenue in April 2025. Europe sets monetization norms, with consumer-protection directives influencing global design choices. South America leverages Brazil’s Law 14.852 to grant gaming cultural status, fostering public grants and tax incentives for developers. Rural bandwidth gaps persist, so studios embed offline progression to ensure accessibility, keeping growth steady across diverse economic tiers in the online simulation games market.
Regulatory Landscape
Regulation affecting online simulation games is tightening around youth protection and chance-based monetization, pushing publishers to redesign in-game economies and disclosure flows. In Europe, the European Commission advanced 2025 enforcement focused on youth-targeted in-game sales, while the UK Advertising Standards Authority (ASA) and CAP issued an Enforcement Notice in February 2026 requiring prominent loot box disclosures in mobile game listings, with active monitoring beginning May 26, 2026. These steps reinforce point-of-sale transparency and constrain opaque reward loops.
Several large markets added jurisdictional and content-governance obligations in 2026 that affect distribution and live-ops operations. India brought the Promotion and Regulation of Online Gaming Rules, 2026 into effect in May 2026, creating the Online Gaming Authority of India for game classification and registrations, while Turkiye enacted amendments to Law No. 5651 (Law No. 7578) effective May 2026 that require certain platforms to appoint local representatives and introduce restrictions tied to minors. Australia moved in September 2024 to new classification guidelines that mandate minimum ratings for games with chance-based in-game purchases and simulated gambling content, shaping how monetization mechanics are packaged for app stores and console storefronts.
Competitive Landscape
The landscape is moderately fragmented. Electronic Arts, Take-Two Interactive, and Microsoft together hold roughly 45% of publisher revenue, yet none exceed a quarter of the total. Microsoft signals ongoing acquisition ambitions to broaden its mobile and geographic footprint. Independent studios leverage cloud services and generative AI to deliver AAA-quality assets with lean teams, fostering innovation that compels incumbents to iterate faster.
Training & Education simulations invite aerospace and healthcare partners into co-development agreements, blending entertainment and vocational outcomes. Proprietary engines become strategic hedges, insulating studios from middleware licensing fees but demanding steep R&D budgets. Cross-play titles logged a 10% revenue upswing in 2023 and project another 7% in 2024, incentivizing publishers to abandon platform exclusivity and nurture holistic ecosystems inside the online simulation games market.
Investment flows also reach peripheral sectors such as haptic hardware and cloud-rendering start-ups that reduce time-to-launch. Competitive differentiation now focuses on content cadence, user-generated tools, and ecosystem services rather than single-purchase releases, reaffirming the online simulation games industry’s shift toward ongoing engagement metrics.
Online Simulation Games Industry Leaders
-
Sony Interactive Entertainment Inc.
-
Tencent
-
Nintendo
-
Microsoft
-
NetEase, Inc.
- *Disclaimer: Major Players sorted in no particular order
Market Opportunities and Future Outlook
Creator tooling is becoming a direct growth lever for simulation content supply, particularly where mobile remains the largest platform footprint (59.40% share in 2025). Roblox expanded its creation stack in 2026, including a beta of Cube Foundation Model-powered "4D generation" (February 2026), agentic capabilities in Roblox Studio such as automated playtesting agents (April 2026), and "Roblox Reality," a hybrid architecture combining an engine with edge-based video world models to support higher-fidelity multiplayer experiences (April 2026). In July 2026, Roblox also announced "Build," a mobile-first AI creation tool with alpha testing in New Zealand, reinforcing a pathway for user-generated life and management simulations that can scale without proportional increases in traditional art and engineering headcount.
Infrastructure and interoperability initiatives are also creating room for more realistic physics-heavy simulation, including training-adjacent use cases and cross-platform delivery. Nvidia released Omniverse libraries in July 2026 (including components positioned for physics and sensor-data preparation of 3D scenes), supporting standardized "simulation-ready" asset pipelines that can be reused across entertainment simulations and adjacent digital-twin workflows. Alongside tightening monetization rules in Europe, this toolchain shift aligns with subscriptions and hybrid models by enabling faster content cadence, more frequent updates, and broader device reach through cloud and edge architectures rather than relying solely on high-end local hardware.
Recent Industry Developments
- July 2026: NetEase Games and Starry Studio announced Once Human for PlayStation 5 and Xbox Series X|S with an August 25, 2026 launch date, adding cross-play and cross-progression support. The console expansion broadens the addressable base for a live-service survival simulation title beyond PC-first audiences. Cross-platform continuity supports longer retention loops that fit subscription bundles and season-pass monetization structures.
- May 2026: Sony Interactive Entertainment, Microsoft, and Nintendo issued a joint statement on collaborating to build a global online safety network for gamers, spanning parental controls, privacy tools, and coordinated enforcement against harmful behavior. The announcement indicates deeper cross-platform alignment on safety standards and moderation practices for always-online titles. For simulation games that depend on persistent social worlds and UGC, stronger safety tooling can reduce friction for younger segments and family accounts.
- September 2024: Australia updated classification guidelines to mandate minimum ratings for games featuring chance-based in-game purchases and to apply stricter treatment to simulated gambling content. The change increases compliance requirements for storefront metadata and can force redesigns of loot-box-like mechanics for releases targeting the Australian market. Rating outcomes also influence broader regional launch planning because global builds often standardize monetization and disclosure features across territories.
Research Methodology Framework and Report Scope
Market Definition and Coverage
The online simulation games market is defined as revenue earned from simulation-style games that are played online, across PC, console, and mobile, including paid downloads, subscriptions, in-game purchases, and advertising tied to gameplay.
Scope exclusions: Excludes offline-only simulation titles, esports betting, and sales of gaming hardware or peripherals even if used for simulation play.
Segmentation Overview
- By Revenue Model
- Advertising
- In-App Purchase
- Subscription
- Paid App
- By Platform
- Mobile
- PC
- Console
- VR/AR Devices
- By Game Type
- Life Simulation
- Vehicle Simulation
- Construction and Management Simulation
- Sports Simulation
- Training and Education Simulation
- By Geography
- North America
- United States
- Canada
- Mexico
- South America
- Brazil
- Argentina
- Chile
- Peru
- Rest of South America
- Europe
- Germany
- United Kingdom
- France
- Italy
- Spain
- Rest of Europe
- Asia-Pacific
- China
- Japan
- South Korea
- India
- Australia
- New Zealand
- Rest of Asia-Pacific
- Middle East
- United Arab Emirates
- Saudi Arabia
- Turkey
- Rest of Middle East
- Africa
- South Africa
- Rest of Africa
- North America
Data Sources, Market Sizing, and Validation
Desk Research
Desk work started by mapping demand-side and supply-side signals that can be verified in public sources, and then aligning those signals to how simulation game revenues are reported. We used sources such as ITU connectivity indicators, World Bank macro series, and OECD digital economy notes to understand broadband access, device affordability, and spending headroom by region.
To keep the scope grounded, we also leaned on sources such as national telecom regulators, app store policy pages for monetization mechanics, and peer reviewed research in game studies for engagement and spending behavior in simulation titles. On the industry side, we reviewed public company filings and investor presentations for disclosures around live service revenue mix, active user trends, and regional splits, and then supplemented this with a paid subscription for company financials and news screening, plus a paid patent database to sanity check where new simulation features were being invested in. These desk sources are illustrative rather than exhaustive, and many other references were also used to collect data, validate assumptions, and clarify gray areas.
Primary Interviews and Surveys
Primary discussions were held with publishers, distributors, platform-side stakeholders, and monetization specialists to validate what is counted as online simulation revenue and what is treated as adjacent spending. We also spoke with demand-side participants such as community operators and experienced players to test assumptions on conversion to in-game purchases, typical spend cadence, and the impact of live updates, with coverage across APAC, EMEA, and the Americas to reflect different payment and play patterns.
Distribution of primary research fieldwork respondents
| Company type | Respondent position | Region |
|---|---|---|
| Top tier: 34% | CXOs: 13% | APAC: 41% |
| Mid tier: 44% | Functional/Unit leaders: 42% | EMEA: 34% |
| Smaller Players: 22% | Managers: 45% | Americas: 25% |
Market-Sizing & Forecasting
Sizing used top-down and bottom-up steps, starting from the digital games revenue pool and then narrowing it using simulation-genre share indicators by platform and region, before splitting revenues by monetization mode (advertising, in-app purchase, and paid app). Since genre tagging and revenue disclosures are not uniform everywhere, the totals were then corroborated using selective bottom-up checks such as sampled title-level benchmarks, a reasonableness check of average revenue per paying user ranges, and channel checks on how bundles and subscriptions are recognized.
Key inputs that shaped the model included platform mix shifts (mobile versus PC and console), live service intensity (update cadence and content drops), payer conversion and spending frequency for simulation cohorts, regional payment friction (wallet penetration and card usage), and broadband and 5G rollout indicators that influence session length and multiplayer adoption. Where country or platform splits were missing, gaps were handled through proxy ratios taken from comparable markets and then adjusted after primary feedback. Forecasting relied mainly on scenario analysis, where base, conservative, and aggressive paths were built around variables like player engagement, monetization rate progression, and macro consumption trends, and then reconciled into a single expected case for the final outlook.
Data Validation & Update Cycle
Outputs were tested against independent signals such as platform ecosystem growth, disclosed digital content revenue trends, and regional consumer spend direction so the implied market curve stayed believable. Large year-over-year jumps were flagged for review, and assumptions were re-checked with follow-up outreach when variances could not be explained by known events like major releases or policy changes.
Before sign-off, the full model goes through multiple analyst reviews with a clear trail from inputs to totals, so sensitivity to key variables can be seen and repeated. The report is refreshed annually, with interim updates made when material events change monetization rules, platform access, or regional demand conditions, and a final pre-delivery pass is done to reflect the latest data releases.
Mordor Intelligence's Global Online Simulation Games Market Estimate Compared With Other Published Estimates
Published figures for online simulation games do not always match because firms often choose different revenue boundaries, timing for the base year, and how they treat platform fees and indirect spending. Differences also show up when one estimate relies heavily on genre labels from storefronts, while another leans on publisher commentary without checking the implied payer economics.
The main gap comes from whether offline simulation revenue or simulator equipment sales are mixed into the same total, and how in-game purchase revenue is recognized after platform commissions and refunds, which is why Mordor Intelligence keeps the scope to online gameplay-linked revenues and aligns values to consistent net revenue treatment and annual currency timing.
Benchmark comparison
| Source | Market Size | Gaps in Research Methodology |
|---|---|---|
| Mordor Intelligence | USD 10.53 B (2026) | |
| Industry Blog A | USD 10.34 B (2025) | Uses a different base year and growth window, and the write-up does not clarify whether figures are net of platform fees or include adjacent items such as offline play revenue and simulator equipment. |
| Regional Publisher B | USD 9.00 B (2024) | Appears to rely on a narrower set of platform cues and selective segment callouts, which can undercount ongoing live-service spending and cross-platform revenue that is not consistently disclosed at title level. |
The spread in the table is largely explained by scope and timing choices, plus how net revenue is treated after commissions and refunds. By anchoring the model to observable demand signals and then pressure-testing key monetization assumptions through interviews, the final number stays traceable to clear inputs that can be reviewed and repeated.
Key Questions Answered in the Report
What is the current value of the online simulation games market?
The online simulation games market is worth USD 10.53 billion in 2026 and is projected to reach USD 19.47 billion by 2031.
Which region leads the online simulation games market?
Asia-Pacific leads with 44.70% market share in 2025, driven by high smartphone use and culturally tailored mobile content.
Which platform segment is growing fastest?
VR/AR devices represent the fastest-growing platform, expanding at a 19.45% CAGR from 2026-2031.
How are European regulations affecting monetization?
Stringent loot-box rules are pushing developers toward subscriptions and cosmetic-only passes to ensure compliance and revenue stability.
Why is generative AI important for simulation games?
Generative AI enables real-time world-building and autonomous NPC behavior, improving engagement and reducing development time, as seen with Krafton’s inZOI.
What is driving growth in the Training & Education simulation segment?
Corporate, aviation, and healthcare sectors are adopting gamified simulation for skill development, propelling an 17.62% CAGR through 2031.