
Online Racing Games Market Size and Share
Market Overview
| Study Period | 2020 - 2031 |
|---|---|
| Market Size (2026) | USD 13.69 Billion |
| Market Size (2031) | USD 17.92 Billion |
| Growth Rate (2026 - 2031) | 5.54% CAGR |
| Fastest Growing Market | Asia-Pacific |
| Largest Market | North America |
| Market Concentration | Medium |
Major Players *Disclaimer: Major Players sorted in no particular order Image © Mordor Intelligence. Reuse requires attribution under CC BY 4.0. | |
Online Racing Games Market Analysis by Mordor Intelligence
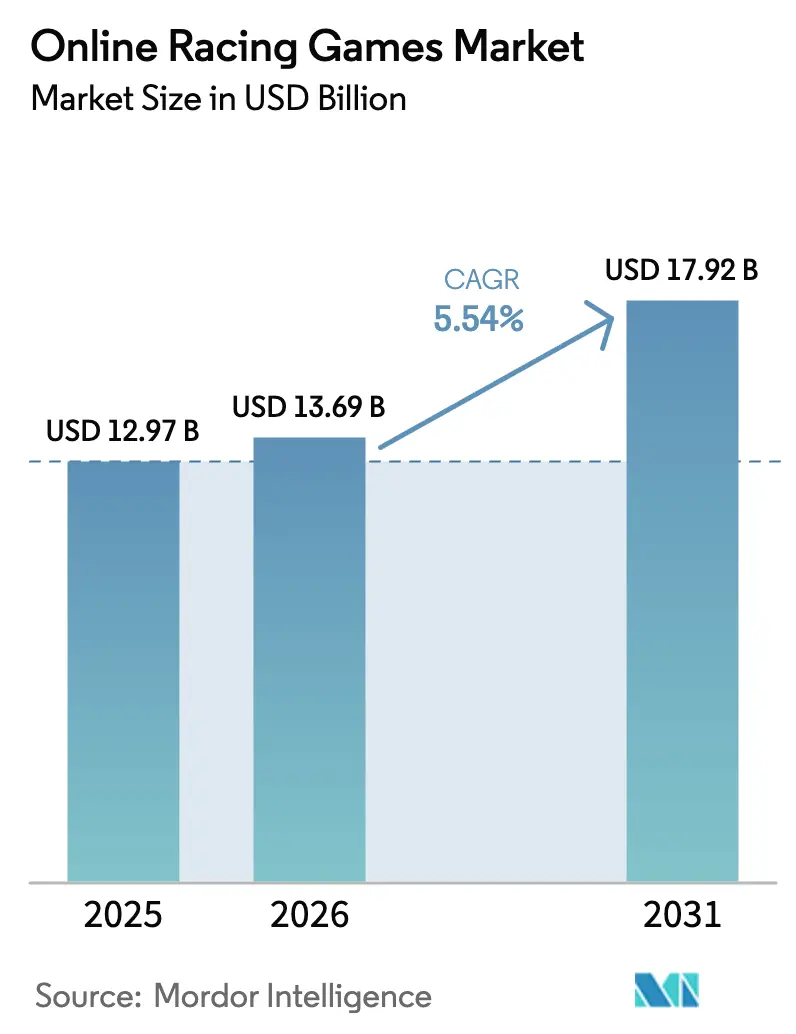
The global online racing games market size was valued at USD 12.97 billion in 2025 and estimated to grow from USD 13.69 billion in 2026 to reach USD 17.92 billion by 2031, at a CAGR of 5.54% during the forecast period (2026-2031). Rising 5G penetration, cloud-native delivery, and AI-driven content generation continue to redraw competitive boundaries, shifting growth from console-centric ecosystems to cross-platform experiences optimized for smartphones and low-latency networks. Edge computing nodes hosted by more than 500 metropolitan points of presence shorten round-trip times to single-digit milliseconds, enabling console-grade visuals on mobile devices and widening the addressable base for the online racing games market.[1]Phil Spencer, “Expanding Cloud and Edge for Xbox Gaming,” Microsoft Blog, microsoft.com Esports tie-ins, premium hardware partnerships, and procedural track generation further diversify revenue streams and extend content lifecycles without proportionate development costs, while privacy-driven user-acquisition headwinds and escalating AAA budgets temper margins for mid-tier studios.
Key Report Takeaways
- By platform, mobile commanded 52.10% of the online racing games market share in 2025, whereas cloud-streaming clients are expanding at a 6.78% CAGR to 2031.
- By game type, simulation racing led with 38.15% revenue share in 2025 in the online racing games market; open-world street racing is forecast to grow at a 6.18% CAGR through 2031.
- By revenue model, in-app purchases accounted for 46.10% share of the online racing games market size in 2025, while subscriptions and season passes are advancing at a 6.64% CAGR to 2031.
- By player engagement level, mid-core competitive users held 42.30% share in 2025 in the online racing games market, whereas cloud-based engagement is rising at a 6.29% CAGR to 2031.
- By geography, North America retained 37.40% share in 2025 in the online racing games market; Asia-Pacific is on track to post a 6.18% CAGR through 2031 on the back of mobile-first gaming cultures and urban 5G rollouts
Note: Market size and forecast figures in this report are generated using Mordor Intelligence’s proprietary estimation framework, updated with the latest available data and insights as of 2026.
Global Online Racing Games Market Trends and Insights
Drivers Impact Analysis*
| Driver | (~) % Impact on CAGR Forecast | Geographic Relevance | Impact Timeline |
|---|---|---|---|
| Smartphone and 5G penetration expands low-latency play | +1.5% | Global, with APAC and Middle East leading deployment | Medium term (2-4 years) |
| Cloud-gaming lowers hardware barriers | +1.2% | North America and EU early adoption, APAC mass market | Long term (≥ 4 years) |
| Esports integration boosts engagement and spend | +0.8% | Global, concentrated in urban gaming hubs | Short term (≤ 2 years) |
| AI-generated tracks cut content costs and refresh cycles | +0.9% | Global, with early adoption in developed markets | Medium term (2-4 years) |
| VR haptics create premium immersion spend | +1.1% | North America and EU premium segments | Long term (≥ 4 years) |
| In-game OEM brand placements add revenue streams | +0.4% | Global automotive markets | Short term (≤ 2 years) |
| Source: Mordor Intelligence | |||
Smartphone and 5G Penetration Expands Low-Latency Play
Mobile-first racing titles now capitalize on sub-20 ms radio latencies that allow real-time multiplayer parity with console lobbies, eliminating the lag disadvantages that once discouraged cross-platform pools.[2]Corporate Communications, “5G Network Performance Update,” T-Mobile US, t-mobile.com T-Mobile’s L4S deployment cut perceived latency another 40%, while Microsoft’s 50 gaming data centers route compute within metropolitan reach, letting mobile drivers compete against rig-equipped PC users without physics desync. The resulting uplift in competitive integrity converts casual mobile users into repeat buyers of cosmetic items and battle-pass tiers, strengthening recurring revenue for the online racing games market. Publishers also bundle cloud-assisted rendering that off-loads physics to edge nodes, boosting frame stability on mid-range handsets and reducing hardware churn. Carriers reciprocate through zero-rating promotions that drop data fees for partnered titles, further lowering entry barriers across price-sensitive economies.
Cloud-Gaming Lowers Hardware Barriers
Streaming removes the USD 500-800 console outlay once prerequisite for authentic simulation experiences, broadening emerging-market demand and elevating lifetime value per gamer for the online racing games market.[3]Andrew Fear, “NVIDIA Demonstrates GeForce NOW for Game AI Inference,” NVIDIA Developer Blog, nvidia.comNVIDIA GeForce Now now pipes RTX 4080-level visuals to Chromebook users, while monthly infrastructure cost per active subscriber averages EUR 4.20, allowing gross margins to stay positive once adoption scales beyond 1 million users per region. Platform holders cement their reach by embedding cloud-play buttons inside digital storefronts, exemplified by Microsoft's Xbox store integration that transitions locally installed sessions to the cloud with a single click. License holders, in turn, repackage archival titles at subscription tiers, monetizing back catalogs without porting expenditures. Because rendering occurs server-side, developers decouple content updates from console generation cycles, shortening time-to-market for seasonal expansions and live-ops events.
Esports Integration Boosts Engagement and Spend
Prize pools topping USD 500,000 for flagship championships have repositioned racing from niche spectator sport to cornerstone of the broader esports economy. Event broadcasts embed real-time telemetry overlays that let viewers track tire wear and fuel burn, adding strategic depth that boosts minutes-viewed and thus sponsorship value. Fantasy competitions piggybacking on official leagues let casual fans form prediction brackets, an engagement loop that keeps the online racing games market top-of-mind during off-season lulls. Publishers record notable improvements in average revenue per paying user (ARPPU) once ranked-ladder resets coincide with esports majors, converting viewership spikes into in-game spending on commemorative liveries and driver cards. Retail brands cross-promote through limited-time bundles, cutting acquisition costs that rose sharply after iOS privacy reforms.
AI-Generated Tracks Cut Content Costs and Refresh Cycles
Machine-learning pipelines now synthesize photorealistic circuits in hours rather than the nine-to-twelve-month asset build common before 2024, trimming USD 2-5 million from per-track expenditures. Adaptive layouts scale complexity to player skill, boosting retention by delivering a fresh challenge curve without manual designer input. Neural rendering compresses texture payloads by 60%, keeping cloud egress fees flat even as map variety multiplies. Studios funnel those savings into marketing and community management, areas where spend efficiency shrank post-privacy changes. For the online racing games market, the upshot is faster patch cadence, continuous novelty, and steadier subscription revenue lines.
Restraints Impact Analysis*
| Restraint | (~) % Impact on CAGR Forecast | Geographic Relevance | Impact Timeline |
|---|---|---|---|
| UA costs surge post-privacy changes | -0.7% | iOS-dominant markets (North America, EU, Japan) | Short term (≤ 2 years) |
| AAA racing development budgets escalate | -0.6% | Global, concentrated in premium market segments | Medium term (2-4 years) |
| Latency-sensitive gameplay raises regional server costs | -0.5% | APAC emerging markets, rural/suburban areas globally | Medium term (2-4 years) |
| Fragmented IP/licensing for cars and tracks | -0.4% | Global automotive markets, concentrated in premium racing segments | Long term (≥ 4 years) |
| Source: Mordor Intelligence | |||
UA Costs Surge Post-Privacy Changes
Apple’s App Tracking Transparency policy stripped third-party identifiers that publishers relied on to model lifetime value, pushing iOS cost-per-install for sports and racing genres to USD 3.50, versus USD 2.50 on Android.[4]Developer Relations, “App Tracking Transparency Overview,” Apple Developer, apple.com In response, studios pivot to first-party telemetry and contextual ad buys, but ramp-up lead times inflate marketing overhead for new releases. Subscription models soften volatility yet demand continuous content drops to curb churn. GDPR compliance compounds complexity across Europe, as explicit consent gates throttle data-driven personalization that could offset UA inefficiencies, shaving 70-basis-points from the online racing games market CAGR projection through 2030.
AAA Racing Development Budgets Escalate
Photorealism, ray-traced reflections, and full trackside crowds push per-title budgets beyond USD 400 million, sums sustainable only for platforms with nine-figure annual live-service income. Codemasters’ USD 1.2 billion acquisition by Electronic Arts underscores consolidation pressures tied to cost inflation. Motion-capture rigs, tire-model physicists, and volumetric weather specialists extend dev cycles to four-plus years, delaying revenue realization and raising break-even thresholds. Mid-tier studios seek relief in cloud-native pipelines and procedural assets, but retraining and server fees erode initial savings. This capital squeeze subtracts 0.6 percentage points from the projected online racing games market CAGR during 2025-2030.
*Our forecasts treat driver/restraint impacts as directional, not additive. The impact forecasts reflect baseline growth, mix effects, and variable interactions.
Segment Analysis
By Revenue Model: Subscriptions Reshape Monetization Strategies
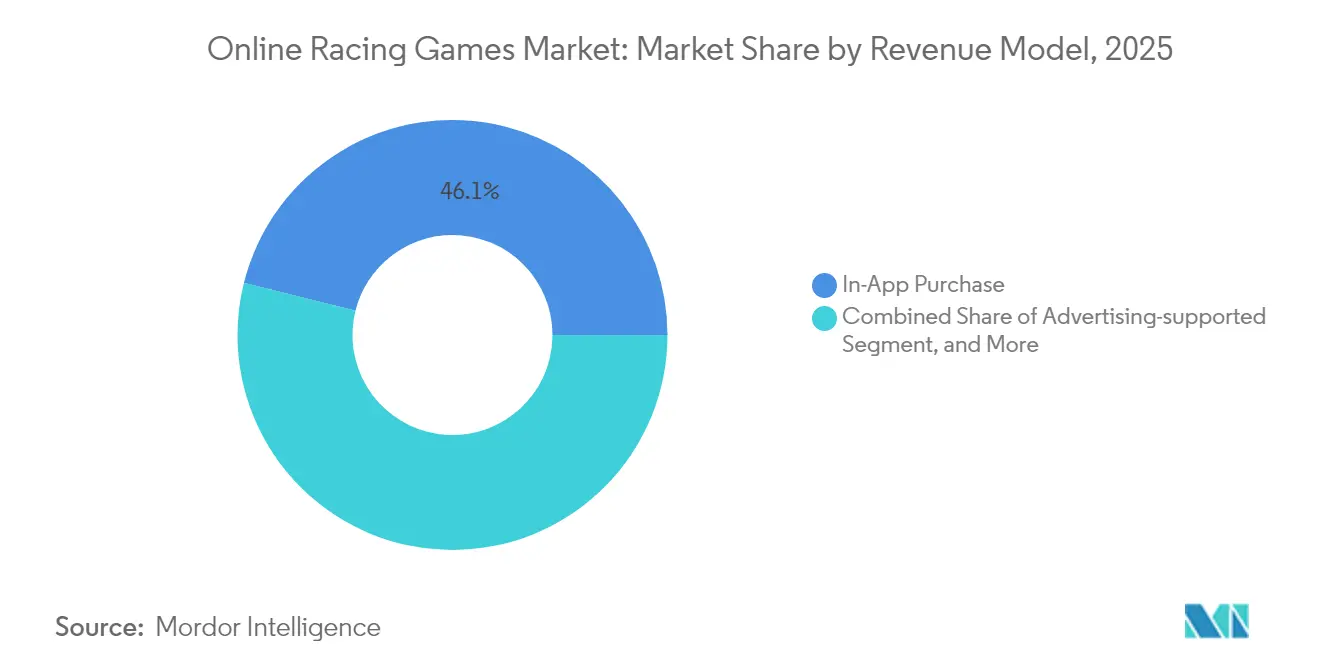
In 2025, in-app purchases held 46.10% share of the online racing games market size, driven by cosmetic skins and performance parts that preserve competitive balance while generating dependable microtransaction revenue. Subscriptions and season passes are rising 6.64% annually, supporting predictable cash flows that sustain live-ops content teams and analytics functions. Advertising-supported formats remain viable in regions with low card penetration, yet privacy limits dampen CPMs, nudging publishers toward brand partnerships and sponsored challenges.
Segment evolution shows how value shifts from one-off sales to recurrent access. Minecraft’s Marketplace Pass illustrates subscription value hinges on a steady cadence of user-generated tracks and vehicles. For simulation die-hards, premium outright purchases coexist with optional telemetry modules and coaching subscriptions, reflecting a hybrid stack of mon¬etization tailored to engagement depth. As churn sensitivities mount, studios invest in sentiment analysis bots monitoring Discord and Reddit for early churn predictors, refining content drops that stabilize recurring revenue within the online racing games market.


By Platform: Mobile Dominance Faces Cloud Disruption
Mobile accounted for 52.10% of 2025 revenue, cementing its primacy in the online racing games market. Improved SoC efficiency lets 120 fps arcade racers run on USD 200 handsets, while gyroscope steering eases onboarding for casual audiences. Concurrently, cloud-streaming clients are projected to grow at 6.78% CAGR, vaulting them from experimentation to mainstream by 2031. PC rigs preserve simulation loyalty because triple-screen cockpits and load-cell pedals remain unmatched in fidelity.
Console vendors counter attrition with cross-gen entitlements and 120 hz performance modes, yet increasingly pivot toward cloud APIs that extend their storefronts to smart TVs. VR and AR headsets add a premium strata; although volumes are nascent, attach-rate for high-ticket DLC doubles that of flatscreen cohorts. The cross-pollination of local rendering for UI and streamed physics calculations optimizes battery life on mobile, making performance parity credible and enlarging subscriber funnels for the online racing games market.
By Game Type: Open-World Racing Gains Momentum
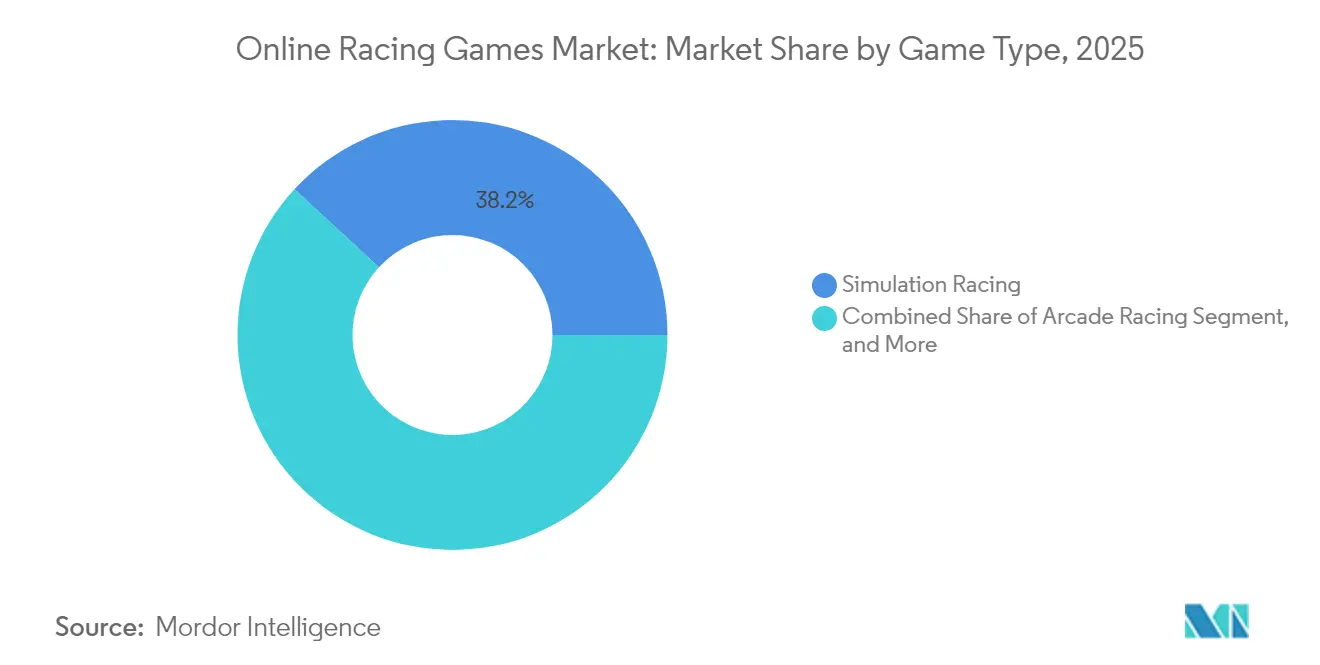
Simulation titles captured 38.15% of 2025 revenue as esports endorsements and tactile wheel ecosystems deepened user investment. Open-world street racers, however, are forecast to rise 6.18% CAGR through 2031 on the back of procedural cityscapes, social hubs, and photo modes conducive to influencer sharing. Arcade racers hold mass appeal but rely on ad-monetization, a model hurt by ATT privacy shifts.
Content pipelines now rotate seasonal events synced with real-world motorsport calendars, galvanizing re-engagement like FIFA’s Team-of-the-Week drops. MILE-scale multiplayer events leverage cloud servers to field 500-car endurance races, producing viral clips that push organic installs. Kart subgenres use crossover IP to court family audiences and diversify the portfolio mix, whereas rally sims command passionate micro-communities who pay for laser-scanned stages and historical car packs, collectively sustaining revenue diversity inside the online racing games market.
By Player Engagement Level: Mid-Core Competitive Dominates
Mid-core competitors comprised 42.30% of user hours in 2025, blending accessible controls with ranked ladders that encourage skill progression and drive retention. AI tutors analyze corner-exit speeds and gift ghost replays, shortening the learning curve and boosting conversion to paying tiers. Hardcore sim racers invest in USD 1,000 pedal sets and telemetry dashboards, delivering ARPPU multiples of casual cohorts.
Meanwhile, cloud-based engagement is scaling 6.29% CAGR as device-agnostic accounts let players resume races on subway commutes and living-room TVs alike. Casual audiences still enter via ad-supported hyper-short sessions but face competition from culturally localized games, pushing racing studios to integrate regional festivals and vehicle skins. Cohort funnels increasingly merge; arcade newcomers migrate toward sim-lite playlists as skill grows, expanding lifetime value and fortifying the online racing games market against genre fatigue.
Geography Analysis
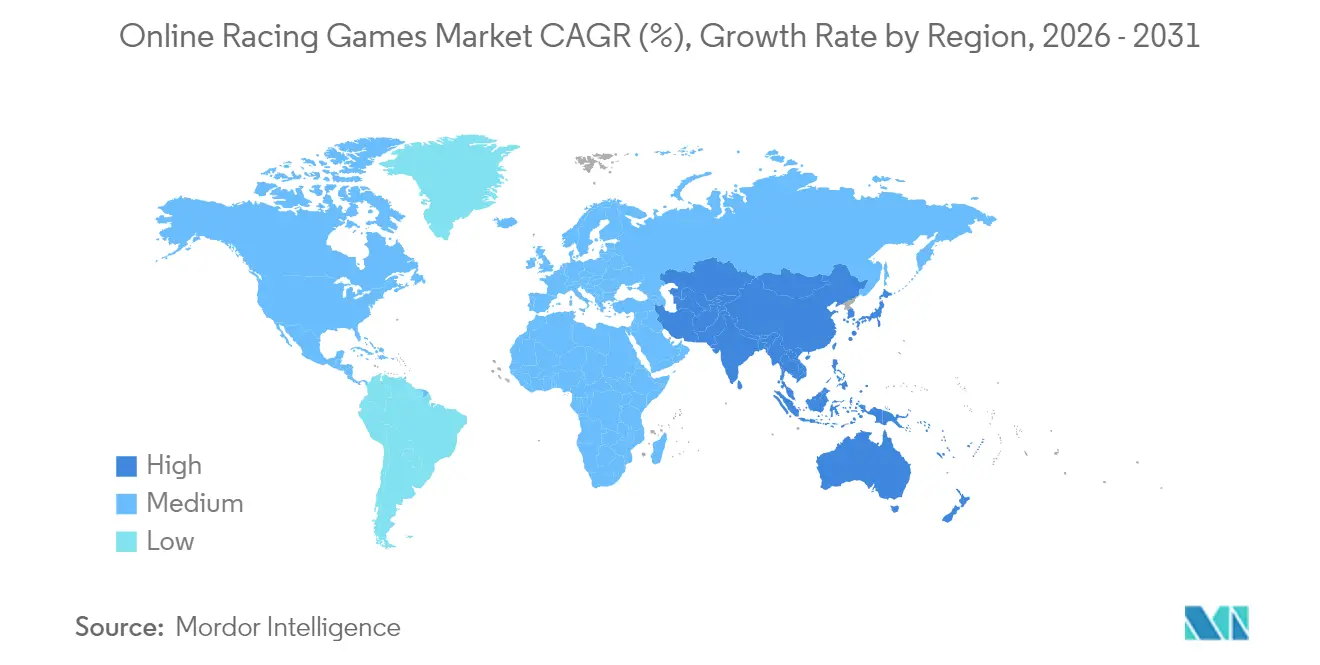
North America retained 37.40% share in 2025, buoyed by entrenched console culture and early 5G rollouts that underpin low-latency cross-play. Publishers leverage favorable ARPPU and live-service adoption as 83% of Electronic Arts’ USD 1.67 billion Q1 FY26 revenue flowed from recurring content. Canada’s e-hockey fandom overlaps with racing through cross-promotions, and Mexico’s mobile uptake accelerates through prepaid 5G bundles.
Asia-Pacific is the fastest-growing region at 6.18% CAGR to 2031, with China’s mobile games reaching USD 86.6 billion in 2024 and racing showing resilience amid overall download softness. Japan’s USD 21 ARPU motivates premium haptic-enabled releases, while South Korea’s PC-bang culture hosts licensed simulation leagues. India leads in volume with 8.45 billion downloads yet lags in monetization, spurring studios to add regionalized storylines and low-SKU cosmetic tiers tailored to local payment norms.
Europe balances privacy rigor with premium spending, as GDPR compliance bolsters user trust that supports subscription uptake. Automotive OEM density in Germany, Italy, and the U.K. fuels branded content alliances, while pan-EU esports circuits add broadcast value. The Middle East and Africa witness rapid mobile adoption; youth bulges and improving fintech rails unlock new payer cohorts, albeit with localization demands on livery design and event timing to respect cultural norms. These dynamics collectively shape regional revenue trajectories for the online racing games market.

Regulatory Landscape
In 2026, India implemented the Promotion and Regulation of Online Gaming Rules, 2026 via the Ministry of Electronics and Information Technology on April 22, 2026, with effect May 1, 2026, alongside the full operationalization of the Promotion and Regulation of Online Gaming Act, 2025. The Online Gaming Authority of India (OGAI) will oversee registration, grievance redressal, and compliance requirements for publishers operating esports, social games, and money-linked formats.
In China, the Cyberspace Administration issued a 2026 policy document effective April 1, 2026, defining platform criteria for platforms with significant influence on minors. The Ministry of Public Security also issued GA 1277.17-2026, a security management standard for online game services, effective July 1, 2026. Together, these measures increase the emphasis on robust security controls and age-appropriate safeguards for multiplayer racing services and cross-platform accounts.
Competitive Landscape
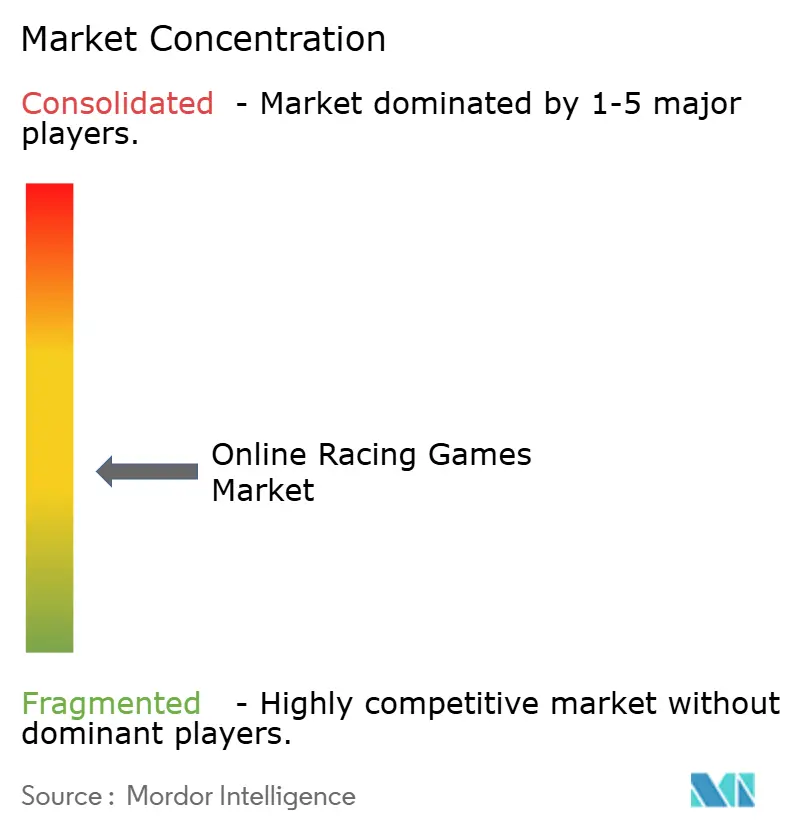
The online racing games market reflects moderate concentration. Electronic Arts leverages Need for Speed and the officially licensed F1 series to anchor cross-media partnerships, including 2025’s F1 movie integration that bundles exclusive story modes. Tencent exploits mobile platform dominance and robust backend tech to syndicate racing titles into super-apps like WeChat. Codemasters’ specialized physics engine remains a moat, and its EA ownership secures marketing reach.
Cloud-native challengers such as Velocima Games build server-side renderers that scale on Kubernetes, halving content deployment time versus traditional console pipelines. These start-ups benefit from lower capital intensity yet face hurdles in brand awareness and licensing access. Vertical integration is intensifying: Corsair’s USD 110 million Fanatec purchase merges hardware and software ecosystems, aiming to lock enthusiasts into proprietary peripherals that synergize with premium DLC.
M&A tallied USD 6.6 billion in Q1 2025, signaling ongoing consolidation as infrastructure demands and UA costs favor well-capitalized actors. Patent portfolios around adaptive AI and haptic telemetry further fortify incumbents; newcomers must navigate licensing minefields or embrace open-source stacks. Regulatory scrutiny focuses on loot-box mechanics, compelling publishers to pivot toward transparent season passes, but market leaders adapt swiftly, maintaining their advantage inside the online racing games market.
Online Racing Games Industry Leaders
Electronic Arts Inc.
Microsoft Corporation
Gameloft SE
Aquiris Game Studio SA
THQ Nordic GmbH
- *Disclaimer: Major Players sorted in no particular order

Market Opportunities and Future Outlook
White-space emerges where professional motorsport ecosystems, live events, and game platforms converge into always-on competitive programming. Formula 1 launched the 2026 Sim Racing World Championship at DreamHack Birmingham and moved rounds into a dedicated studio at the Media and Technology Centre in Biggin Hill, reinforcing sim racing as a permanent broadcast format rather than a one-off tournament series.
A second opportunity cluster focuses on high-fidelity immersion delivered through spatial computing and VR optimizations. iRacing announced work with Apple and NVIDIA to bring iRacing to Apple Vision Pro using CloudXR streaming and foveated rendering, while KUNOS Simulazioni added foveated rendering improvements in Assetto Corsa EVO updates, aligning premium sim experiences with new display and input stacks. This combination keeps attention on optimized, low-latency multiplayer architectures, cross-device identity, anti-cheat, and rendering pipelines.
Recent Industry Developments
- July 2026: Playground Games rolled out the Italian Exotics update for Forza Horizon 6, adding new Ferrari and Lamborghini models alongside AI behavior fixes and a new event playlist. The content drop supports live-ops retention while keeping the title aligned with automotive brand partnerships that help offset user acquisition headwinds in privacy-constrained markets.
- June 2026: Electronic Arts released the F1 25: 2026 Season Pack on PlayStation 5, Xbox Series X|S, and PC. Shipping 2026 rules and season-aligned content as a paid pack reinforces the franchise shift toward recurring seasonal monetization and longer live-service arcs between major annual releases.
- October 2024: NVIDIA launched the GeForce Developer Network (GDN) to support developers optimizing games for cloud rendering and streaming workflows. For online racing titles, these tools support lowering device barriers while maintaining latency and visual quality targets that multiplayer racing requires.


Research Methodology Framework and Report Scope
Market Definition and Coverage
This market covers the revenues earned from online racing video games, where gameplay and monetization happen through an internet-connected experience across devices and stores.
Scope exclusions: Offline-only racing games that do not require any online connectivity for core play and monetization are excluded.
Segmentation Overview
- By Revenue Model
- Advertising-supported
- In-App Purchase (Micro-transactions)
- Premium Purchase (Paid App / Full Game)
- Subscription / Season Pass
- By Platform
- Mobile Smartphones and Tablets
- PCs
- Game Consoles
- Cloud-Streaming Clients
- VR / AR Headsets
- By Game Type
- Arcade Racing
- Simulation Racing
- Kart and Party Racing
- Open-World / Street Racing
- MILE-style Mass Events
- By Player Engagement Level
- Casual / Hyper-casual
- Mid-core Competitive
- Hardcore Simulation / Esports
- By Geography
- North America
- United States
- Canada
- South America
- Brazil
- Argentina
- Rest of South America
- Europe
- Germany
- United Kingdom
- France
- Spain
- Russia
- Rest of Europe
- Asia Pacific
- China
- Japan
- India
- South Korea
- Rest of Asia Pacific
- Middle East and Africa
- Middle East
- Saudi Arabia
- United Arab Emirates
- Rest of Middle East
- Africa
- South Africa
- Nigeria
- Rest of Africa
- Middle East
- North America
Data Sources, Market Sizing, and Validation
Desk Research
Desk work starts with mapping how online racing game revenue is created and recorded, then matching it to the closest public data signals we can track over time. We rely on public and official sources such as ITU connectivity statistics, World Bank income and population indicators, OECD digital economy datasets, and government telecom regulators for 4G and 5G rollout context. We also use app store policy notes, platform documentation, company filings, investor presentations, and reputable press to understand monetization shifts such as subscriptions and in-app purchases.
After the market map is clear, we convert secondary inputs into sizing drivers and check assumptions against historical patterns. A paid subscription for company financials and news helps track regional exposure, product mix commentary, and major corporate actions that can affect reported gaming revenue. We reference a paid patent database selectively to validate the direction of features that influence engagement, for example matchmaking, physics simulation, and latency reduction. These sources are not exhaustive, and we also used other public documents and data tables for collection, validation, and clarification.
Primary Interviews and Surveys
Primary work is used to confirm what portion of racing game revenues should count as online, and how revenue models behave across mobile, PC, console, and cloud clients. We spoke with a mix of publishers, developers, live-ops teams, distribution partners, and industry advisors across major regions so gaps in pricing, take rates, and engagement assumptions could be closed with practical inputs.
Distribution of primary research fieldwork respondents
| Company type | Respondent position | Region |
|---|---|---|
| Top tier: 33% | CXOs: 13% | APAC: 49% |
| Mid tier: 48% | Functional/Unit leaders: 43% | EMEA: 29% |
| Smaller Players: 19% | Managers: 44% | Americas: 22% |
Market-Sizing & Forecasting
The market is sized using a top-down approach once, where the demand pool is reconstructed from connected gamer base trends, platform mix, and monetization intensity for racing titles, then filtered through what share is truly online. To keep totals realistic, we corroborate results with selective bottom-up approximations such as sampled title-level revenue ranges, channel checks on in-app purchase and subscription uptake, and an ASP-like spend per active user check by platform.
Model inputs include smartphone and broadband penetration, time spent in racing genres, online multiplayer participation rate, share of revenue coming from in-app purchases and season passes, and regional ARPU direction tied to disposable income. Because online racing is sensitive to network quality, we stress-test the model using latency and 5G availability signals to avoid overstating adoption in areas with weaker coverage. For forecasting, we run scenario analysis around drivers such as cloud streaming adoption, subscription bundling, and regulation-linked changes in monetization, then align the chosen trajectory to expert views from interviews. Where bottom-up checks are incomplete for smaller titles or emerging regions, we handle gaps through proxy ratios based on platform share and engagement split, then recheck those proxies in validation.
Data Validation & Update Cycle
Validation is done by triangulating the model output against independent signals, including platform mix shifts, monetization model changes, and region-level connectivity and spending indicators. Large variances are flagged, and the assumptions are revisited before sign-off, with follow-up outreach triggered when a driver moves in a way the model cannot explain cleanly. A second analyst review is completed to confirm formulas, unit consistency, and year alignment, and then a final pass is run right before delivery so late market events are reflected.
The report is refreshed annually, and interim updates are performed when material events occur, such as major pricing changes, policy changes affecting in-app purchases, or a demand shock tied to new platform launches.
Mordor Intelligence's Global Online Racing Games Market Estimate Compared With Other Published Estimates
Published market sizes for online racing games can appear far apart because teams count different revenue buckets and apply different assumptions for what "online" means at the point of sale. In practice, the biggest swings usually come from scope inclusions, the year used for currency conversion, and how fast ARPU is assumed to rise in mobile-heavy regions.
Offline-only racing game revenue sits outside Mordor Intelligence's scope, which is why some broader "racing games" estimates can look lower or higher depending on how they mix offline unit sales with online monetization. Another driver is whether esports and live-ops revenue is counted only when it is tied to racing titles, and whether subscriptions are measured at gross spend or net after store and platform fees. Finally, refresh timing matters, since new season pass structures and cloud streaming expansion can change the run rate quickly within a single year.
Benchmark comparison
| Source | Market Size | Gaps in Research Methodology |
|---|---|---|
| Mordor Intelligence | USD 13.69 B (2026) | |
| Industry Report Publisher A | USD 8.70 B (2024) | Uses an earlier base year and a narrower revenue capture that appears to undercount subscriptions and live-ops in mature markets, and it may apply conservative ARPU progression for mobile-led regions. |
| Gaming Research Publisher B | USD 12.13 B (2025) | Appears to cover a broader racing game set where online qualifiers are not consistently applied, and the estimate can shift based on whether offline unit sales and bundled subscription revenue are treated as in-scope. |
Looking across the three figures, the spread is mainly explained by what is counted as online revenue and how subscriptions and live-ops are treated in the total. Our sizing stays traceable because the drivers are tied back to platform mix, monetization shares, and region-level connectivity and spending signals, and then checked again with interview-based reality tests before the final number is set.


Key Questions Answered in the Report
What is the projected size of the global online racing games market by 2031?
The global market is forecast to hit USD 17.92 billion by 2031, growing at a 5.54% CAGR.
How fast is the cloud-streaming client segment expanding?
Cloud-streaming clients are on track for a 6.78% CAGR through 2031, the fastest among delivery platforms.
Which revenue model is gaining the most momentum?
Subscriptions and season passes are rising at a 6.64% CAGR as publishers pivot toward predictable, recurring income.
Why is Asia-Pacific considered the fastest-growing region?
Mobile-first gaming cultures and rapid 5G rollouts are pushing Asia-Pacific to a 6.18% CAGR through 2031.
What share do mobile platforms hold in online racing games?
Smartphones and tablets commanded 52.10% of global revenue in 2025, making them the dominant access point.
Page last updated on:






