
Online Event Ticketing Market Size and Share
Market Overview
| Study Period | 2020 - 2031 |
|---|---|
| Market Size (2026) | USD 88.38 Billion |
| Market Size (2031) | USD 105.17 Billion |
| Growth Rate (2026 - 2031) | 3.55% CAGR |
| Fastest Growing Market | Asia Pacific |
| Largest Market | North America |
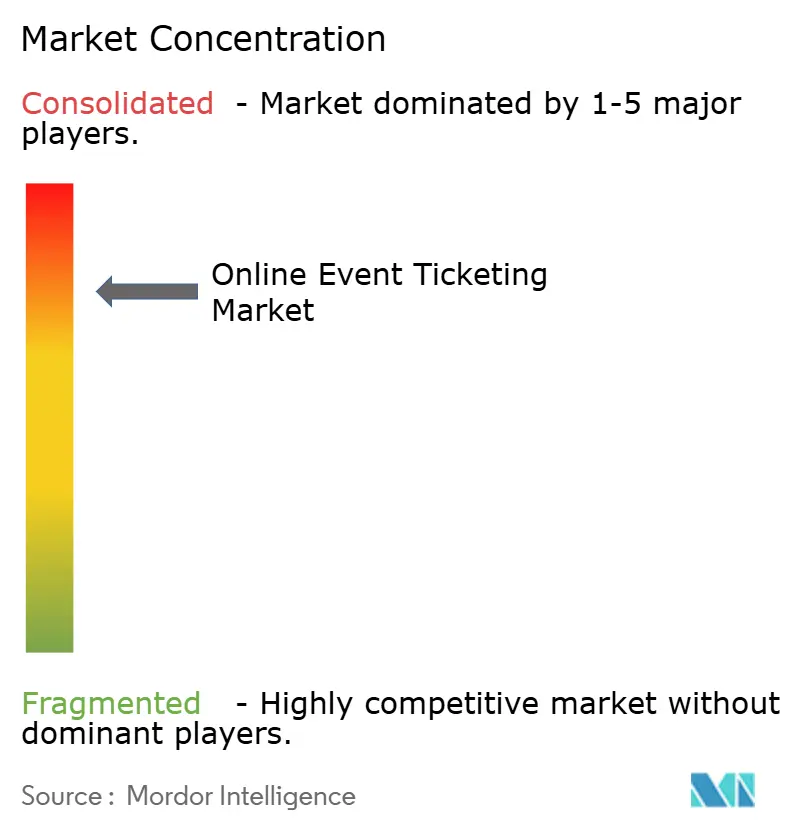
| Market Concentration | High |
Major Players *Disclaimer: Major Players sorted in no particular order Image © Mordor Intelligence. Reuse requires attribution under CC BY 4.0. | |
Online Event Ticketing Market Analysis by Mordor Intelligence
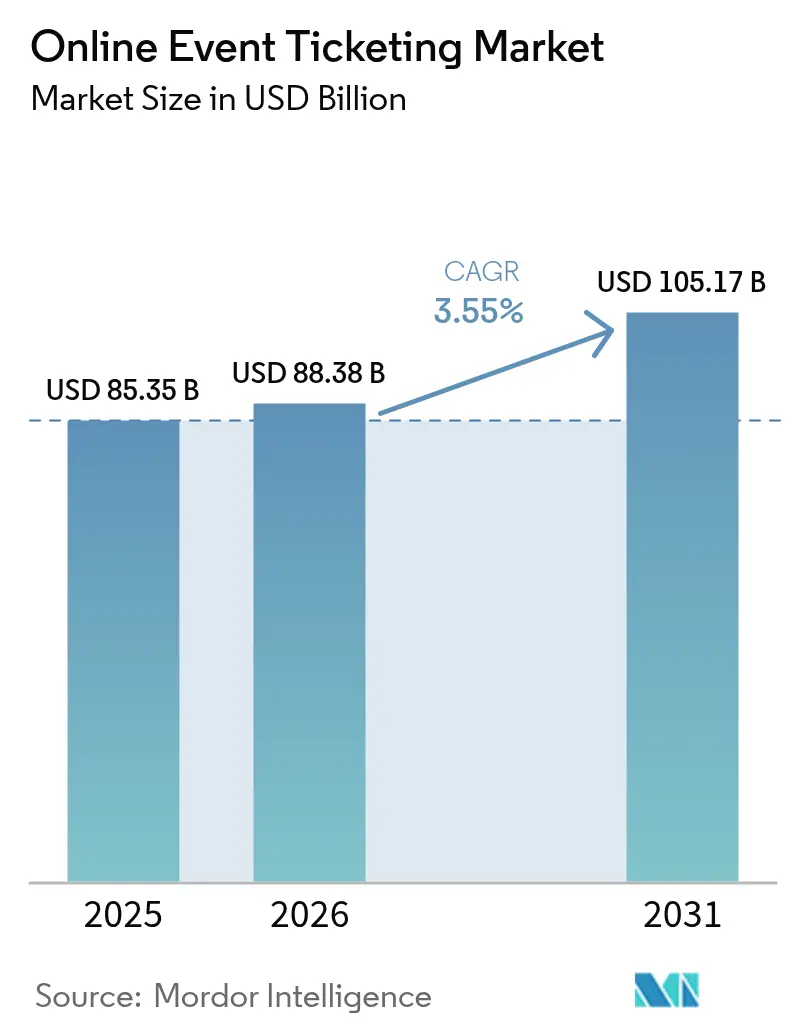
Online event ticketing market size in 2026 is estimated at USD 88.38 billion, growing from 2025 value of USD 85.35 billion with 2031 projections showing USD 105.17 billion, growing at 3.55% CAGR over 2026-2031. This expansion occurs in a digital ecosystem where mobile-first shopping, premium add-ons, and AI-driven pricing anchor revenue streams, while antitrust scrutiny and fee-transparency mandates restrain margin upside. Mobile devices already account for 58.95% of total transactions, and their 4.65% CAGR underscores how 5G coverage, digital wallets, and social discovery reinforce friction-free purchases. Music concerts and festivals regained momentum after pandemic disruption and now command 36.73% of 2024 revenue, bolstered by international tours and fans’ willingness to pay for immersive experiences. North America maintains the largest regional presence at 38.76% 2024 share, yet Asia Pacific generates the fastest trajectory at 3.99% CAGR, due to widespread smartphone adoption and real-time payment rails. Competitive intensity rises as SeatGeek and regional specialists deploy AI pricing, NFT authentication, and vertically integrated offerings to chip away at incumbency advantages held by Ticketmaster, CTS Eventim, and StubHub.
Key Report Takeaways
- By event type, music concerts and festivals captured 36.12% of the online event ticketing market share in 2025 and are progressing at a 3.92% CAGR through 2031.
- By platform, mobile channels controlled 58.40% of the online event ticketing market size in 2025 and are projected to expand at a 4.42% CAGR.
- By revenue model, VIP and premium packages posted the fastest 4.51% CAGR while the ticket face-value stream retained 66.55% of 2025 revenue in the online event ticketing market.
- By end user, individual consumers held 57.05% of 2025 demand, whereas corporate and MICE customers are accelerating at a 4.25% CAGR in the online event ticketing market.
- By geography, Asia Pacific is advancing at a 3.84% CAGR in the online event ticketing market, even as North America preserved 38.20% 2025 share.
Note: Market size and forecast figures in this report are generated using Mordor Intelligence’s proprietary estimation framework, updated with the latest available data and insights as of 2026.
Global Online Event Ticketing Market Trends and Insights
Drivers Impact Analysis*
| Driver | (~) % Impact on CAGR Forecast | Geographic Relevance | Impact Timeline |
|---|---|---|---|
| Proliferation of high-speed mobile internet and 5G adoption | +1.2% | Global, with APAC and Latin America leading | Medium term (2-4 years) |
| Rising smartphone penetration in emerging economies | +0.8% | APAC core, spill-over to MEA and Latin America | Long term (≥ 4 years) |
| Growth of live music and sports mega-events post-COVID | +0.6% | Global, concentrated in North America and Europe | Short term (≤ 2 years) |
| Dynamic and AI-driven pricing boosting organiser ROI | +0.5% | North America and EU, expanding to APAC | Medium term (2-4 years) |
| Blockchain-based NFT tickets enhancing fan engagement | +0.4% | North America and Europe early adoption | Long term (≥ 4 years) |
| Corporate demand for hybrid employee-engagement events | +0.3% | Global, strongest in developed markets | Short term (≤ 2 years) |
| Source: Mordor Intelligence | |||


Proliferation of High-Speed Mobile Internet and 5G Adoption
Expanding 5G networks make real-time bidding, location-based pricing, and instant confirmation possible, boosting conversion during peak sales windows. Affordable 5G handsets open untapped consumer strata, especially across Southeast Asia, where many users leapfrog desktops entirely. Global 5G connections hit 1.7 billion in 2024, with Asia Pacific supplying 61% of new lines.[1]GSMA, “Global 5G Connections Report 2024,” gsma.comFaster speeds support richer multimedia listings that heighten user engagement and spur impulse buys. Event organizers overlay AI engines on live network data to micro-segment audiences and optimize seat pricing minute-by-minute. The linkage between high-bandwidth access and flexible payment APIs has already trimmed cart-abandon rates, strengthening platform ROI.
Rising Smartphone Penetration in Emerging Economies
Sub-USD 150 smartphones with in-built biometric security normalize mobile checkouts among first-time buyers in India, Indonesia, and Nigeria. India’s Unified Payments Interface alone cleared 13.4 billion transfers worth USD 200 billion in March 2025, underscoring mobile payments’ scale.[2]National Payments Corporation of India, “UPI Transaction Statistics March 2025,” npci.org.in Such ubiquity means users expect one-tap ticket purchases and social-media discovery rather than desktop browsing. Regional event promoters exploit this mobile primacy by marketing directly through messaging super-apps, skipping costly physical distribution. The smartphone wave thus broadens the total addressable base and pulls micro-events, college festivals, and local sports into formal ticket commerce.
Growth of Live Music and Sports Mega-Events Post-COVID
Pent-up appetite for shared experiences forces longer booking windows and high pricing ceilings. MLB’s London Series averaged 55,000 attendees and spurred 133% U.K. social engagement growth in 2024. International tours by K-pop acts, F1 Grand Prix rotations, and global esports finals follow a similar cross-border template. Platforms must now handle multi-currency checkouts, tax compliance, and localized language support. Corporations nest entertainment access inside hospitality suites to deepen client ties, further raising average ticket outlays. The result is a resilient demand curve that props up overall online event ticketing market growth even as macro conditions soften.
Dynamic and AI-Driven Pricing Boosting Organiser ROI
Machine-learning models ingest social chatter, secondary-market listings, and venue occupancy statistics to update face values every few seconds. Live Nation’s Premium suite records 300–500% uplifts over base admission for VIP tiers.[3]Live Nation Entertainment, “Premium Services Overview,” livenation.com Smaller venues procure off-the-shelf SaaS tools to mimic this sophistication without in-house data teams, democratizing revenue optimization. Dynamic tiers suppress scalper arbitrage because price gaps narrow between primary and secondary outlets. Better capacity utilization supports promoters’ gross margins, encouraging risk-taking on niche or debut events, which broadens consumer choice across the online event ticketing market.
Restraints Impact Analysis*
| Restraint | (~) % Impact on CAGR Forecast | Geographic Relevance | Impact Timeline |
|---|---|---|---|
| Heightened antitrust and fee-transparency scrutiny | -0.7% | North America and EU, expanding globally | Short term (≤ 2 years) |
| Cyber-fraud and bot resale activity | -0.4% | Global, concentrated in high-value markets | Medium term (2-4 years) |
| Venue exclusivity clauses limiting new entrants | -0.3% | North America and Europe, selective APAC markets | Medium term (2-4 years) |
| Volatile event calendars amid macro shocks | -0.2% | Global, with emerging markets most vulnerable | Short term (≤ 2 years) |
| Source: Mordor Intelligence | |||
Heightened Antitrust and Fee-Transparency Scrutiny
The FTC Junk Fees Rule, effective May 2025, obliges upfront disclosure of all ticket charges, erasing revenue once earned from surprise add-ons.[4]Federal Trade Commission, “FTC Junk Fees Rule Implementation,” ftc.gov Parallel DOJ litigation contests Live Nation’s exclusivity pacts, while U.K. regulators probe secondary-market markup practices. Compliance requires revamped invoicing, user-interface redesign, and legal counsel, inflating overheads just as price ceilings firm. Smaller players initially gain competitive oxygen, but legal ambiguity still deters fresh entrants, tempering aggregate online event ticketing market expansion in the short run.
Cyber-Fraud and Bot Resale Activity
Automated scripts routinely clear entire ticket blocks within seconds, later relisting at steep premiums that erode consumer trust. Platforms counter with CAPTCHA, device fingerprinting, and AI anomaly detection, all of which raise infrastructure spend without direct revenue offset. Users frustrated by bot-driven sellouts delay future purchases, lengthening sales cycles. Regulatory stances diverge: the U.S. BOTS Act carries fines, while several APAC nations emphasize industry self-governance, complicating multinational compliance. Persistent fraud risk therefore subtracts points from the online event ticketing market CAGR until authentication technologies mature.
*Our forecasts treat driver/restraint impacts as directional, not additive. The impact forecasts reflect baseline growth, mix effects, and variable interactions.
Segment Analysis
By Event Type: Music Dominates Growth Trajectory
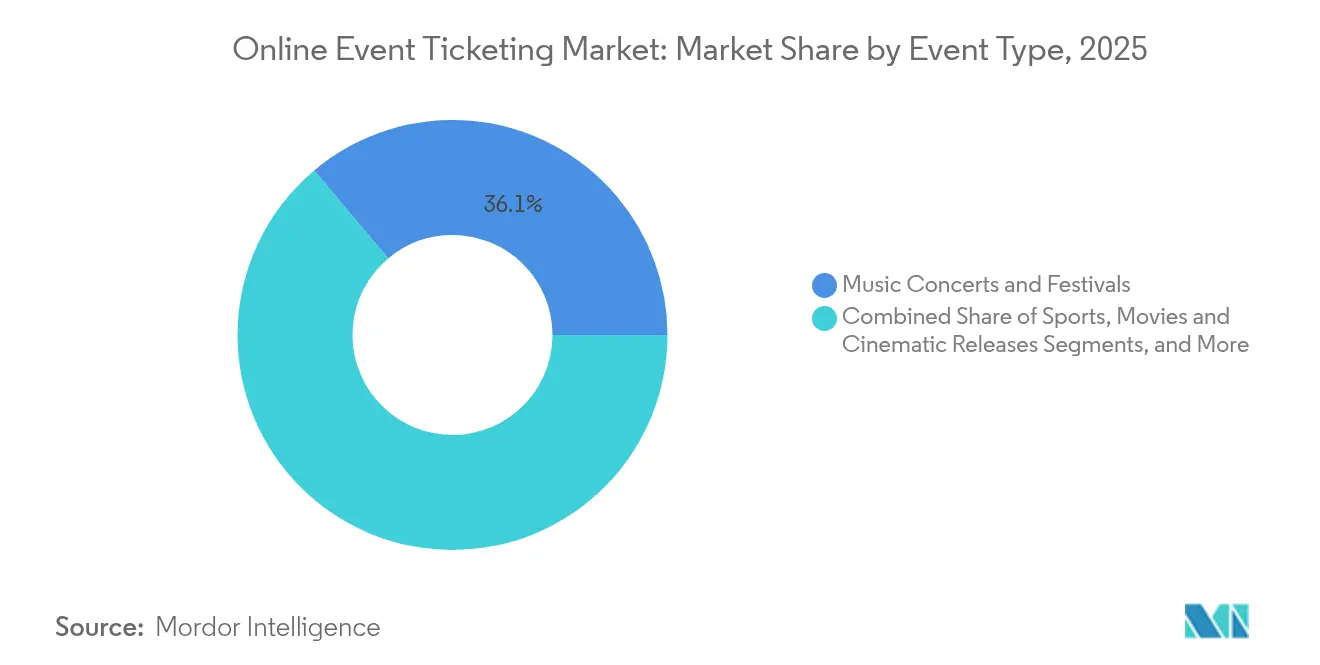
Music concerts and festivals controlled 36.12% of 2025 revenue, the largest slice of the online event ticketing market size, and are projected to climb 3.92% CAGR to 2031. Season-ticket sports retain loyal bases, but arena capacity caps temper volume gains. Premium cinema formats offer differentiation against streaming, yet remain niche. Comedy, theater, and esports collectively widen demographic reach and bolster weekday seat utilization.
Sustained fan appetite propels pre-sales months ahead of show dates, assisting promoter cash flow. Younger cohorts aged 18–34 pay USD 70 more on average for live acts and attend 1.4 times more frequently than older patrons. Hybrid bundles that grant backstage virtual access or NFT collectibles further inflate yields. Consequently, online event ticketing market demand concentrates around music, even as new genres nurture incremental volume.


By Platform: Mobile Supremacy Accelerates
Mobile devices accounted for 58.40% of 2025 transactions, the dominant channel within the online event ticketing market size, and are forecast to rise 4.42% CAGR through 2031. Desktop usage contracts as Generation Z favors apps that enable thumbprint authentication and instant wallet pay. Smart-TV ticket buttons emerging inside Netflix or Apple TV trailers illustrate omnichannel convergence.
Real-time inventory alerts, social-media referrals, and geofenced discounts give mobile an engagement edge. Apple Wallet’s richer pass features, from venue maps to loyalty stamps, improve entry flow and post-event upselling. Combined with BNPL and crypto acceptance, mobile channels unlock fresh cohorts, cementing their strategic centrality across the online event ticketing market.
By Revenue Model: Premium Experiences Drive Margins
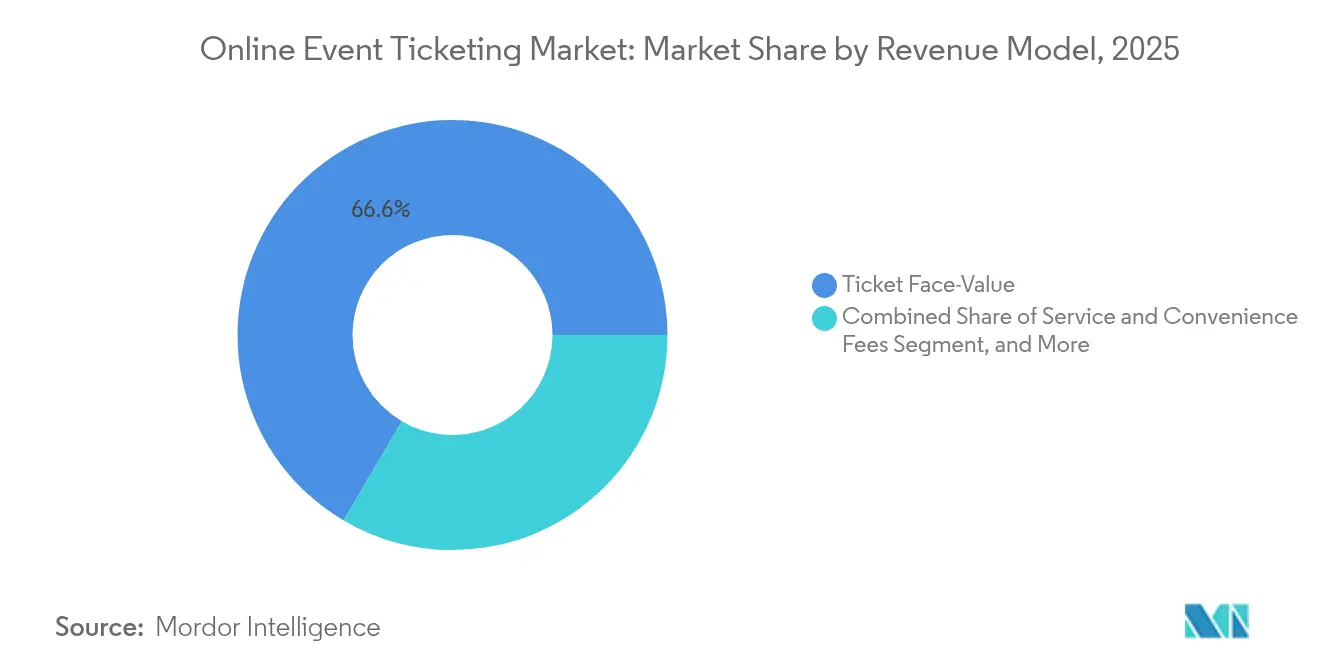
Ticket face value still comprised 66.55% of 2025 revenue, but VIP bundles exhibit the swiftest 4.51% CAGR as consumers trade up for exclusivity. Transparent fee rules squeeze convenience-fee monetization, pushing platforms toward value-added experiences such as artist meet-and-greets or luxury seating.
Data analytics personalize offer ladders, leveraging past spending and social affinity—to maximize revenue per head. Sponsorship-linked passes align brands with curated fan groups, injecting supplemental income while preserving price clarity demanded by regulators. This pivot to experiential monetization underpins future online event ticketing market growth despite fee caps.
By End User: Corporate Segment Accelerates
Individuals generated 57.05% of 2025 ticket volume, yet corporate and MICE demand shows a stronger 4.25% CAGR outlook. Hybrid work compels employers to foster culture via live outings, driving block purchases at premium price points. Organizers benefit from predictable lead times and higher average order values, smoothing revenue volatility.
Bulk buying also yields data insights, such as preferred genres by department, that fuel cross-sell opportunities. Disintermediation trends see festivals offering direct enterprise portals, reducing reliance on generalist brokers. The net effect is a more diversified online event ticketing market with B2B inflows balancing consumer cycles.
Geography Analysis
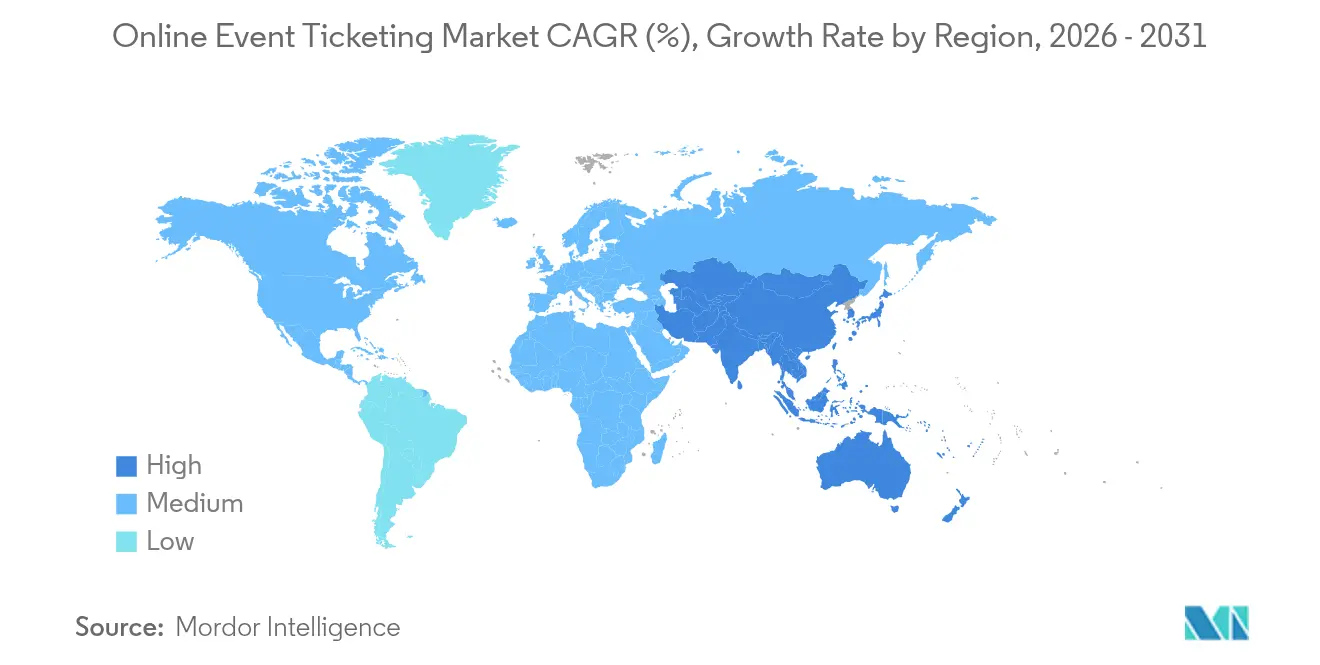
North America commanded 38.20% of 2025 global revenue, supported by dense venue networks and high disposable income. Yet saturation and antitrust probes clip upside, nudging platforms to innovate around loyalty ecosystems rather than sheer volume. Hybrid corporate gatherings that marry in-person concerts with virtual streaming gain traction, sustaining ticket flow despite regulatory friction.
Asia Pacific posts the quickest 3.84% CAGR as smartphone usage exceeds 80% in India, Indonesia, and Thailand. UPI alone processed USD 200 billion of March 2025 payments, exemplifying digital wallet maturity. Chinese super-apps integrate discovery, chat, and checkout, setting experiential benchmarks Western rivals strive to emulate. Rising middle-class incomes and government bets on sports tourism, such as Indonesia’s MotoGP, extend inventory supply.
Europe maintains moderate gains due to cultural tourism and festival diversity. However, compliance costs climb as each nation tightens consumer protection and fee-disclosure policies. Post-Brexit frictions add foreign-exchange and settlement complexity for U.K.–EU cross-sales. Emerging regions such as Brazil and Saudi Arabia provide upside, contingent on stable macro backdrops and continued investment in broadband and transport links.

Regulatory Landscape
Regulation is increasingly centered on fee transparency and competition policy, shaping how platforms display prices and structure service charges. In the United States, the Federal Trade Commission finalized an all-in pricing approach for live-event ticketing through its junk-fees rulemaking (issued in December 2024 and effective May 2025 per the report context), while the US Department of Justice and multiple state attorneys general have pursued antitrust action against Live Nation Entertainment and Ticketmaster since May 2024, keeping venue exclusivity and tying practices under active scrutiny.
Outside the US, enforcement is also tightening around consumer protection and secondary-market behavior. The UK Competition and Markets Authority secured undertakings from Ticketmaster in September 2025 on clearer price disclosures and labeling, and Canada added province-level guardrails with Quebec assenting to Bill 10 in June 2026 to address abusive practices in ticket reselling and certain online subscription renewals (with effect later in 2026). Together, antitrust action and price-disclosure mandates are pushing ticketing providers and marketplaces to redesign checkout flows, update fee presentation, and strengthen controls against deceptive resale listings across regions.
Competitive Landscape
Market concentration is high: Ticketmaster’s vertically integrated model secures key venues and promotions, enabling data synergies and bargaining power. DOJ litigation and the U.K. Competition and Markets Authority inquiry could mandate divestitures or open access, reshaping competitive lanes. SeatGeek leverages its Deal Score algorithm to rank value, winning contracts with NFL teams and Barclays Center. StubHub’s March 2025 S-1 filed for NYSE relisting rekindles investor focus on secondary marketplaces despite fee curbs
Regional entrants focus on specialization, Korea’s Interpark excels in K-pop, while Brazil’s Eventim Latin America localizes payment and fraud tools to bypass national constraints. Consolidation continues: Victory Live bought Logitix to fuse ticket and venue software, and Zomato acquired Paytm’s ticket unit for USD 244 million to weave entertainment into its lifestyle super-app. Technology differentiation, AI pricing, NFT passes, and biometric entry, defines next-generation advantages as regulatory cost burdens escalate.
Looking ahead, platforms with robust compliance architecture, multichannel engagement, and premium-experience design should command pricing power even if headline fees shrink. In contrast, fragmented newcomers risk margin erosion amid cybersecurity investments and rising acquisition costs. Overall, the online event ticketing market favors scale married to innovation.
Online Event Ticketing Industry Leaders
Bigtree Entertainment Pvt. Ltd
Zoonga
Ticketmaster Entertainment LLC (Live Nation Entertainment Inc.)
Eventbrite Inc.
SeatGeek Inc.
- *Disclaimer: Major Players sorted in no particular order

Market Opportunities and Future Outlook
Wallet-based and conversational discovery are becoming more direct routes to purchase, creating whitespace for platforms that can link entertainment discovery, identity, and checkout in a single flow. Ticketmaster rolled out interactive Google Wallet passes in EMEA in June 2026 (starting with OVO Hydro in Glasgow), adding real-time updates and in-pass engagement, while SeatGeek expanded discovery beyond traditional search through a February 2026 Spotify integration and a March 2026 launch within ChatGPT. These moves strengthen distribution partnerships and API-led inventory access as a competitive lever, particularly in a market where apps and mobile web already drive most transactions.
Regulatory pressure on drip pricing and resale markups is also opening product opportunities around controlled resale, identity, and compliance tooling that can be packaged as platform capabilities for venues and organizers. Ticketmaster, for example, expanded face-value resale options via integrations such as CashorTrade (April 2026), and new identity-bound ticketing concepts are entering the market. Open Distribution approaches are also moving forward, including TicketSocket integrating listings with StubHub and viagogo in July 2026. With Asia Pacific identified as the fastest-growing region in the report context, localization around real-time payments, fraud defenses, and compliant fee presentation remains a practical whitespace for both global leaders and regional specialists.
Recent Industry Developments
- July 2026: Ticketmaster partnered with Seated to route late-release ticket inventory to fans via artist-managed waitlists. The move targets a persistent pain point for high-demand shows by converting last-minute holds into verified fan sales and improving primary-market capture without relying on broad secondary listings.
- May 2026: Ticketmaster and SM Prime launched SM Ticketmaster, marking Ticketmaster's entry into the Philippines with an end-to-end ticketing offering. This expands primary inventory reach in a mobile-first market and raises the competitive bar for local payment, fraud, and fulfillment capabilities.
- June 2024: The US Department of Justice and multiple state attorneys general escalated antitrust scrutiny of Live Nation Entertainment and Ticketmaster following the May 2024 lawsuit, keeping venue exclusivity and integrated promotion-ticketing practices in focus. The action reinforced compliance investment needs across major platforms and increased the commercial importance of transparent pricing and open distribution options.


Research Methodology Framework and Report Scope
Market Definition and Coverage
For this methodology, the market is defined as revenues earned from selling event tickets through online channels, including web and mobile booking flows, for consumer-facing events.
Scope exclusions: offline box office-only ticketing, venue access control hardware, and non-ticket event software that does not directly monetize ticket sales are excluded from the revenue base.
Segmentation Overview
- By Event Type
- Sports
- Music Concerts and Festivals
- Movies and Cinematic Releases
- Other Live Shows (Comedy, Theatre, Esports)
- By Platform
- Mobile Devices (Apps and Mobile Web)
- Desktop / Laptop
- Smart-TV and OTT Interfaces
- By Revenue Model
- Ticket Face-Value
- Service and Convenience Fees
- VIP and Premium Packages
- Sponsorship-Bundled Passes
- By End User
- Individual Consumers
- Corporate and MICE Clients
- Event Organisers and Promoters
- By Geography
- North America
- South America
- Europe
- Asia Pacific
- Middle East and Africa
Data Sources, Market Sizing, and Validation
Desk Research
Desk research was used to set clear boundaries and to track demand signals year over year. We relied on public sources such as national statistics offices (for household consumption and digital commerce), telecom regulators and ITU-style indicators (for internet and smartphone adoption), the OECD and World Bank (for macro baselines), and UN trade databases where they provided service activity proxies. For event intensity and ticketing behavior, we also reviewed association and organizer publications such as live entertainment bodies, sports league attendance releases, and venue operator updates.
On the supply side, annual reports, earnings call transcripts, and investor presentations were used to map revenue logic, fee take rates, and major geography exposure for leading platforms and promoters. Patent databases were scanned to understand payments, identity checks, and mobile ticketing feature direction, which helps set realistic ASP and conversion assumptions. We also used paid subscriptions for company financials and intelligence, news and financials, and global contracts and tenders when public disclosure was limited. These sources are illustrative and not exhaustive, and additional references were used to collect, validate, and clarify inputs throughout the study.
Primary Interviews and Surveys
Primary work focused on validating what drives ticketing revenue in practice, including typical service fees, refund and chargeback impacts, and the online share of total ticketing by event category. We spoke with platform-side leaders, venue and promoter teams, and payment and fraud stakeholders across the Americas, EMEA, and APAC so assumptions could be pressure-tested for both mature and fast-growing markets.
Distribution of primary research fieldwork respondents
| Company type | Respondent position | Region |
|---|---|---|
| Top tier: 31% | CXOs: 18% | APAC: 42% |
| Mid tier: 49% | Functional/Unit leaders: 27% | EMEA: 32% |
| Smaller Players: 20% | Managers: 55% | Americas: 26% |
Market-Sizing & Forecasting
Sizing starts from a demand-pool build using digital purchasing behavior and event activity as anchors, and then revenue is reconstructed through online ticket volumes multiplied by observed fee and price patterns. In practice, we use a top-down approach once, converting attendance and event cadence signals, along with online channel penetration, into implied ticket transactions and value across regions. After that, selective bottom-up checks are run using a limited roll-up of large platform disclosures, sampled event pricing, and channel checks with venues and promoters, which helps adjust totals where public reporting is uneven.
Inputs that materially shape the model include the number of ticketed events and attendance intensity, the online share of ticket purchases (web versus mobile behavior), average ticket price movement by major event categories, service fee and convenience fee ranges, and refund rates during disruption periods. Where direct transaction counts are not available, gaps are handled through proxy ratios validated in interviews, such as tickets per event day for large venues and conversion ranges for discovery-to-purchase flows.
For forecasting, we rely mainly on multivariate regression with scenario analysis, since demand responds to a mix of macro drivers and digital adoption rather than a single time trend. Key drivers include real income growth, urban population and tourism direction, smartphone and mobile payment adoption, and the expected event calendar normalization. Expert inputs are used to keep fee progression and online penetration assumptions realistic for each region.
Data Validation & Update Cycle
Validation is done through multiple checkpoints so totals remain tied to real-world signals. We compare model outputs against independent indicators such as disclosed ticketing revenue ranges, major event attendance patterns, and reported shifts in online purchasing behavior, and then investigate variances that fall outside expected ranges. When anomalies appear, assumptions are revisited, and follow-up outreach is triggered to confirm whether the driver is scope, currency timing, or a real market shift.
Before sign-off, the model and assumptions go through a multi-step analyst review so calculations can be replicated and traced back to inputs. Reports are refreshed annually, and interim updates are made when material events occur, such as major policy changes affecting fees, step changes in refund behavior, or large event pipeline disruptions. Before delivery, a fresh analyst pass is completed so clients receive the latest updated view.
Mordor Intelligence's Global Online Event Ticketing Market Market Size Compared Against Other Published Estimates
Published market sizes for online event ticketing can differ even when the topic name looks the same, because the underlying counting rules are not always consistent. The main reasons are the event scope counted, the treatment of fees and taxes inside revenue, and how far forecasts are extended beyond the most recently validated year.
Evidence from disclosed platform revenue notes, venue and promoter booking patterns, and observed online purchase penetration checks is what keeps Mordor Intelligence aligned to ticketing revenue that is actually transacted online for ticketed events, rather than broader live events spending. Differences also show up when some estimates fold in adjacent items like event management software, secondary resale economics, or offline-to-online migration assumptions that are not reconciled to attendance and ticket price signals.
Benchmark comparison
| Source | Market Size | Gaps in Research Methodology |
|---|---|---|
| Mordor Intelligence | USD 88.38 B (2026) | |
| Industry Press Release A | USD 56.70 B (2024) | Uses an earlier anchor year and does not clearly state whether revenues include full ticket value, only platform fees, or taxes, which can shift totals materially when back-cast to a different base. |
| Industry Press Release B | USD 58.73 B (2023) | Starts from a pre-normalization year for live events and applies an aggressive growth path to 2032, with limited visibility on how online penetration, refund rates, and fee take rates are validated across regions. |
The spread in published numbers mostly comes from the anchor year chosen and what is counted as ticketing revenue (gross ticket value versus platform monetization). By tying assumptions to repeatable checks like event attendance intensity, online share, and fee ranges, we keep the estimate traceable and practical for planning.


Key Questions Answered in the Report
What is the projected size of the online event ticketing market by 2031?
The online event ticketing market size is expected to reach USD 105.17 billion by 2031.
Which event category is expanding the fastest?
Music concerts and festivals lead growth, advancing at a 3.92% CAGR through 2031.
Why is Asia Pacific drawing attention from ticketing platforms?
Smartphone penetration above 80% and mature real-time payments like UPI are propelling Asia Pacific to the fastest 3.84% CAGR region.
How will the FTC Junk Fees Rule influence pricing?
Platforms must reveal all fees upfront, squeezing hidden-fee revenue and accelerating the shift toward value-added VIP bundles.
What technologies are reshaping ticket issuance?
AI-driven dynamic pricing, blockchain-based NFT tickets, and biometric mobile wallets streamline buying and strengthen fraud prevention.
Page last updated on:


