
Online Board Games Market Size and Share
Market Overview
| Study Period | 2020 - 2031 |
|---|---|
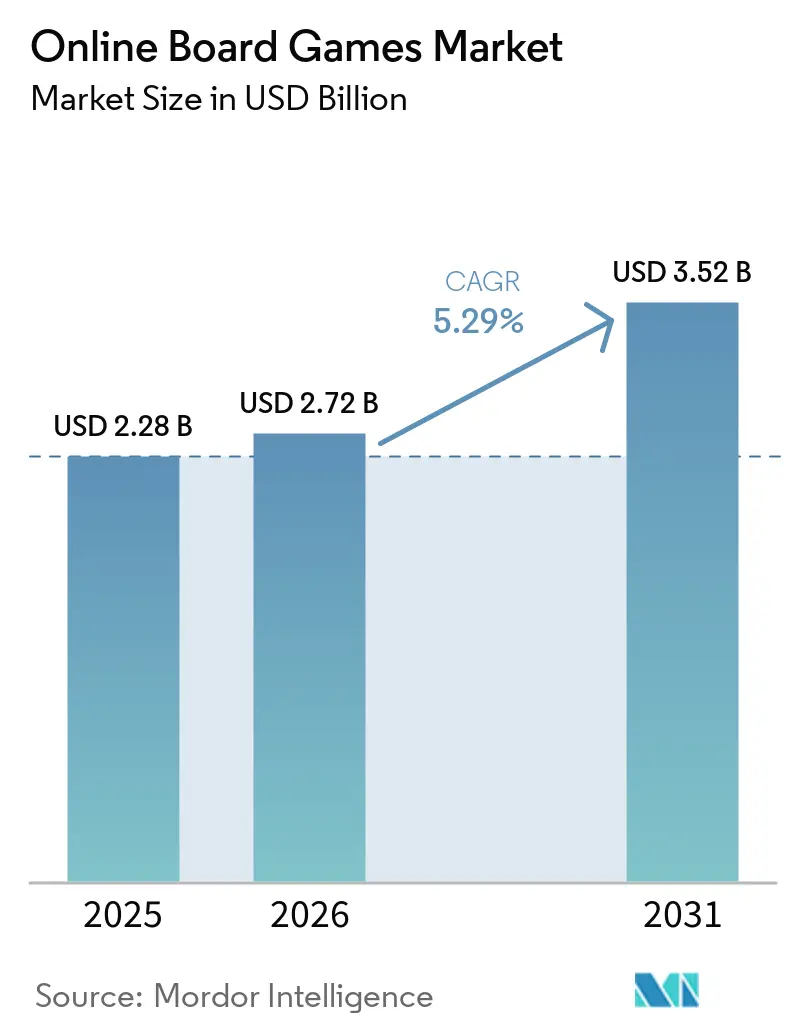
| Market Size (2026) | USD 2.72 Billion |
| Market Size (2031) | USD 3.52 Billion |
| Growth Rate (2026 - 2031) | 5.29 % |
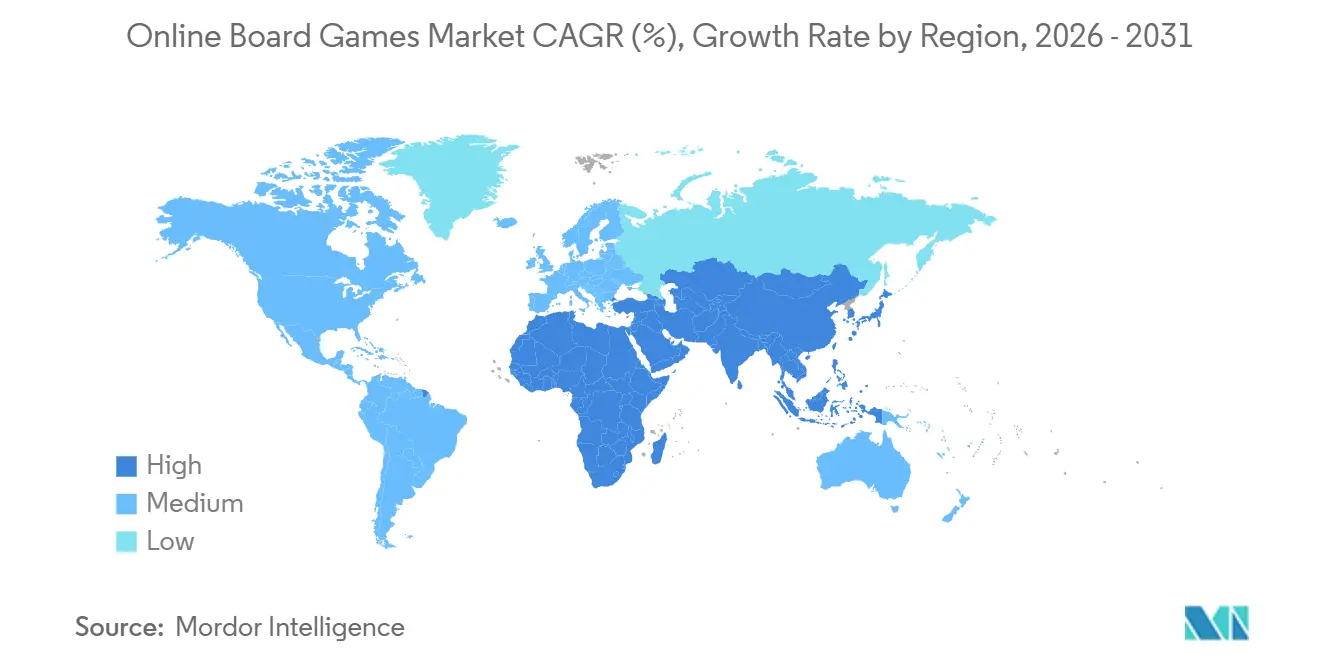
| Fastest Growing Market | Middle East |
| Largest Market | Asia Pacific |
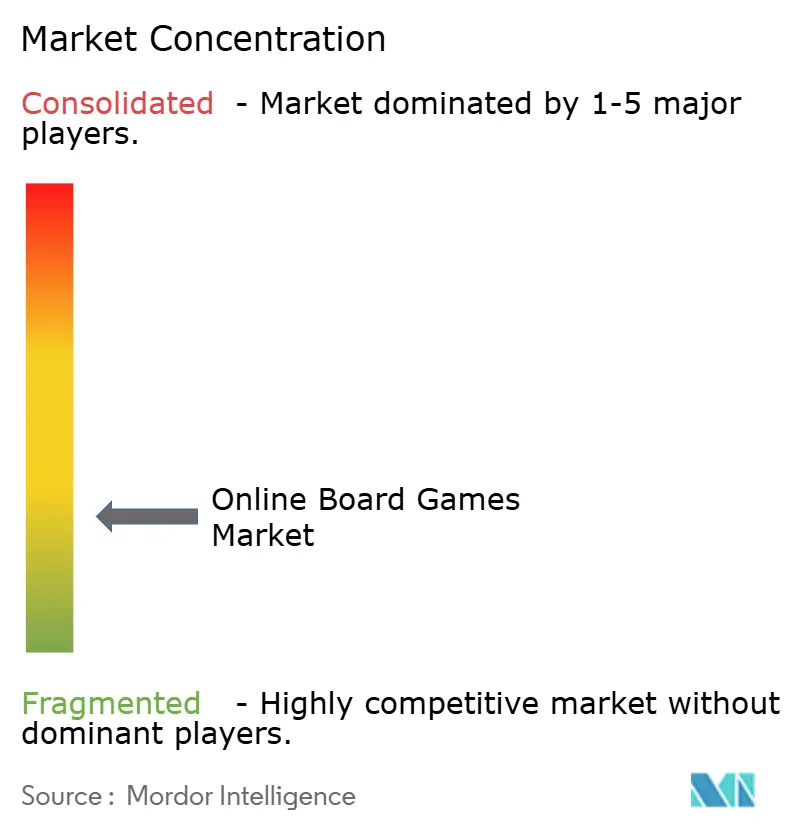
| Market Concentration | Low |
Major Players *Disclaimer: Major Players sorted in no particular order Image © Mordor Intelligence. Reuse requires attribution under CC BY 4.0. | |
Online Board Games Market Analysis by Mordor Intelligence
The online board games market size is projected to expand from USD 2.28 billion in 2025 and USD 2.72 billion in 2026 to USD 3.52 billion by 2031, registering a 5.29% CAGR between 2026 to 2031. Always-connected play, generative-AI scenario creation, and carbon-neutral blockchain ownership are shifting the revenue base from one-time sales to subscriptions and secondary-market royalties. Infinite procedural campaigns lower content-production costs and extend user engagement, encouraging publishers to bundle ongoing access into predictable monthly plans. Carbon-efficient proof-of-stake protocols allow NFT-backed pieces and boards to trade peer-to-peer with low fees, adding perpetual royalty income. Asia-Pacific leads adoption, supported by smartphone penetration and national policies that prioritize local intellectual property, while Middle East investment funds accelerate infrastructure and studio acquisitions. Platform holders such as Netflix and Amazon integrate controller-based titles into living-room screens, broadening addressable audiences beyond mobile.
Key Report Takeaways
- By platform, mobile captured 70.63% of online board games market share in 2025; console and smart-TV deployments are advancing at a 5.84% CAGR through 2031.
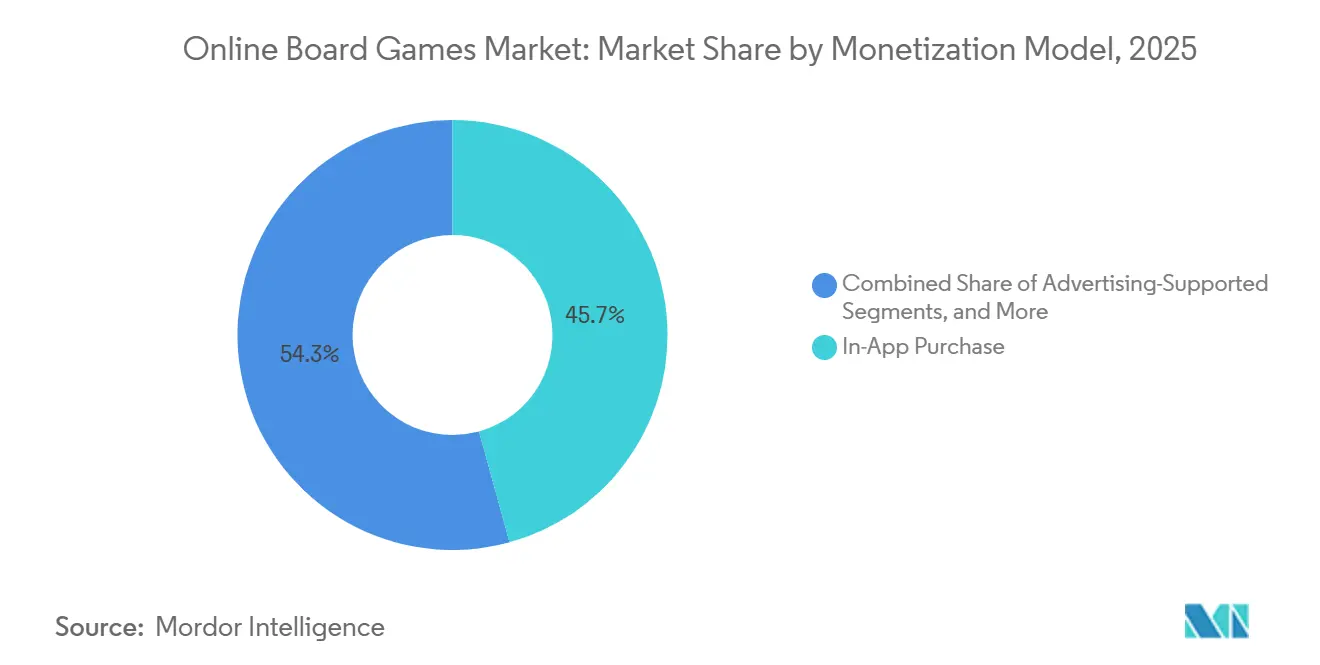
- By monetization model, in-app purchases led with 45.72% of revenue in 2025, whereas subscription and season-pass models are expanding at a 5.57% CAGR to 2031.
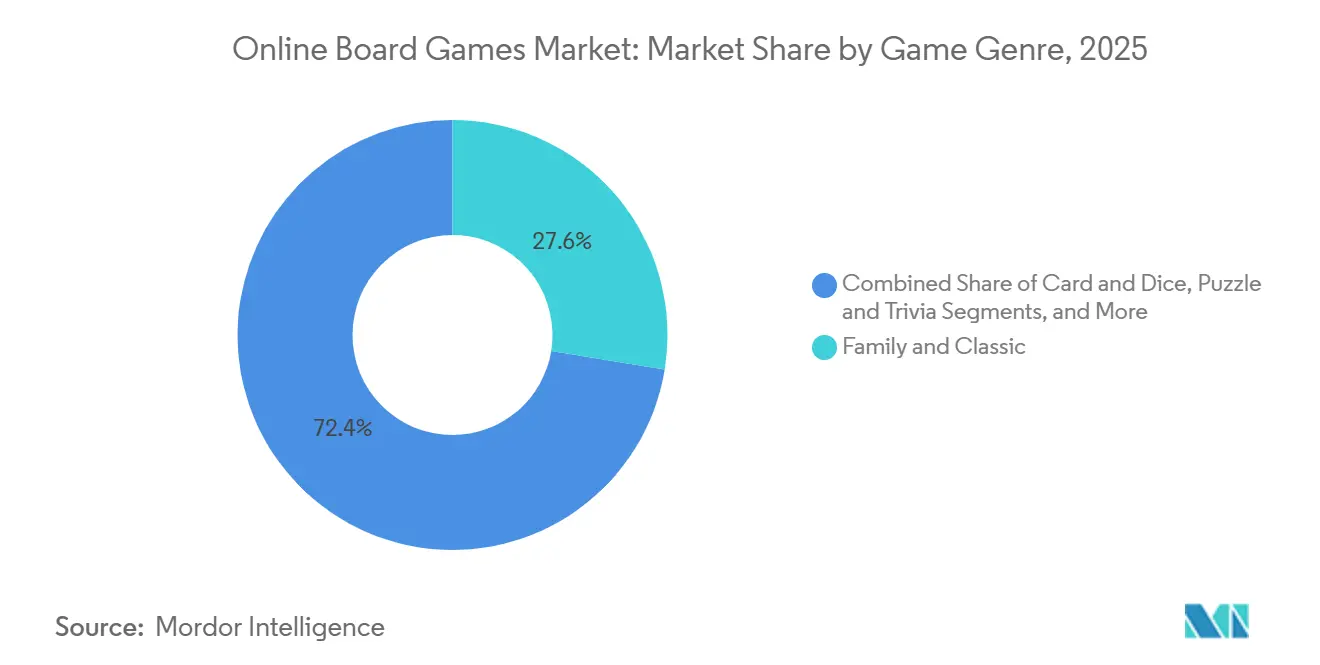
- By genre, family and classic titles held 27.57% of revenue in 2025, while RPG and adventure conversions are projected to post the fastest 6.01% CAGR.
- By player mode, multiplayer accounted for 63.81% of revenue in 2025 and is forecast to grow at a 6.17% CAGR, the quickest among mode segments.
- By geography, Asia-Pacific retained 34.53% of 2025 revenue, and the Middle East is poised for the highest regional growth at a 5.98% CAGR through 2031.
Note: Market size and forecast figures in this report are generated using Mordor Intelligence’s proprietary estimation framework, updated with the latest available data and insights as of January 2026.
Market Trends and Insights
Drivers Impact Analysis of Online Board Games Market*
| Driver | (+ ) % Impact on CAGR Forecast | Geographic Relevance | Impact Timeline |
|---|---|---|---|
| Integration of Generative-AI dungeon-master modules creating infinitely replayable board scenarios | +0.9% | Global, with early adoption in North America and Asia-Pacific | Medium term (2-4 years) |
| NFT-backed ownership of digital board assets unlocking secondary-market monetization streams | +0.7% | North America, Europe, Middle East | Long term (≥4 years) |
| Voice-controlled gameplay adoption among visually-impaired users broadening total addressable market | +0.4% | Global, particularly North America and Europe | Medium term (2-4 years) |
| Cross-IP mash-ups featuring streaming-series franchises in limited-time board events | +0.8% | Global, with highest impact in North America and Asia-Pacific | Short term (≤2 years) |
| Carbon-neutral blockchain protocols easing environmental concerns around on-chain board gaming | +0.5% | Europe, North America | Long term (≥4 years) |
| 5G-driven latency reduction enabling synchronous multiplayer on-the-go | +1.0% | Asia-Pacific core, spill-over to Middle East and Africa | Medium term (2-4 years) |
| Source: Mordor Intelligence | |||
Integration Of Generative-AI Dungeon-Master Modules Creating Infinitely Replayable Scenarios
Large language models now fabricate coherent board narratives on demand, trimming design labor by roughly 60% and turning finite campaigns into evergreen services. Publishers who previously shipped 20 to 30 scripted levels now deploy generative engines that produce millions of permutations, converting board games from finite products into infinite services. This shift favors subscription monetization over one-time purchases, as players perceive ongoing value from algorithmically refreshed content. Smaller studios gain parity because narrative depth now scales with compute rather than payroll. The competitive field, therefore, widens even as compliance questions around AI-generated intellectual property remain unresolved.[1]Microsoft Research, “WHAM: World Model for Hierarchical Action Models,” microsoft.com
NFT-Backed Ownership Of Digital Board Assets Unlocking Secondary-Market Monetization
Carbon-neutral layer-2 protocols mint and trade board pieces with negligible fees, letting players capture resale value and granting publishers a 5%-10% royalty on every secondary sale. However, regulatory scrutiny is intensifying; the European Union's Markets in Crypto-Assets Regulation mandates disclosure of environmental impact and consumer-protection safeguards, raising compliance costs for smaller developers. Immutable X processed more than 50 million such transactions in 2024 without gas charges, illustrating the scale possible when energy costs and environmental objections disappear.[2]Immutable X, “Carbon-Neutral NFT Transactions,” immutable.com
Voice-Controlled Gameplay Broadening Access For Visually Impaired Players
Natural-language interfaces narrate board states, accept spoken moves, and clarify rules, opening play to an estimated 2.2 billion people with vision impairment. A 2024 study published in the ACM Conference on Human Factors in Computing Systems found that voice-controlled chess interfaces improved move accuracy by 40% among visually impaired participants compared to tactile boards.[3]ACM Conference Proceedings, “Voice-Controlled Chess Interfaces for Visually Impaired Users,” dl.acm.orgPublishers embedding these tools also qualify for accessibility grants and public-sector procurement that require Section 508 compliance. The incremental development cost is modest-typically under USD 50,000 for voice-API integration-yet adoption remains uneven, as many studios prioritize features that appeal to the majority sighted demographic.
5G-Driven Latency Reduction Enabling Synchronous Multiplayer On The Go
Standalone 5G cut round-trip times below 10 milliseconds in live operator trials, making synchronous board turns feasible during commutes. SoftBank and Ericsson recorded a 90% latency drop versus 4G, while T-Mobile’s U.S. rollout posted similar figures. Developers that optimize for portrait-mode one-handed play now reach urban riders who previously defaulted to asynchronous titles. Publishers are redesigning user interfaces to accommodate one-handed play and portrait orientation, optimizing for subway riders who cannot deploy tablets. The competitive implications are stark: developers who fail to optimize for 5G will cede market share to mobile-first studios that treat cellular connectivity as the primary distribution channel.
Restraints Impact Analysis of Online Board Games Market*
| Restraint | ( ) % Impact on CAGR Forecast | Geographic Relevance | Impact Timeline |
|---|---|---|---|
| Regulatory clampdown on loot-box mechanics aligning them with gambling laws | -0.6% | Europe (Belgium, Netherlands, UK), with spillover to North America | Short term (≤2 years) |
| Bandwidth-throttling policies on ad-supported traffic in emerging markets reducing play quality | -0.4% | Asia-Pacific (India, Indonesia), Africa | Medium term (2-4 years) |
| Rising cyber-bullying incidents in multiplayer board lobbies triggering parental backlash | -0.3% | Global, with highest impact in North America and Europe | Short term (≤2 years) |
| Open-source board-game AIs cannibalizing premium puzzle titles via free GitHub distribution | -0.5% | Global, particularly North America and Europe | Medium term (2-4 years) |
| Source: Mordor Intelligence | |||
Regulatory Clampdown On Loot Boxes
Belgium and the Netherlands already ban randomized rewards, and the United Kingdom is drafting similar rules that force odds disclosure and spending caps. Publishers pivot to deterministic season passes, but average revenue per paying user falls 15%-25% as the variable-ratio reinforcement loop disappears. Smaller studios lacking the resources to redesign monetization systems face existential risk, while incumbents like Electronic Arts and Activision Blizzard have absorbed compliance costs and repositioned loot boxes as "surprise mechanics" in jurisdictions with ambiguous statutes. The regulatory trajectory suggests that loot-box bans will expand to additional markets, compressing margins across the industry.
Bandwidth-Throttling Policies On Ad-Supported Traffic
Telecom regulators in India and Indonesia permit carriers to charge for priority routing, relegating free-to-play video ads to slower lanes. Session drops during ad playback prompt uninstalls and raise customer-acquisition costs. Developers compress creatives or pre-cache video but still face 10%-20% higher operating expense.[4]Telecom Regulatory Authority of India, “Differential Pricing Frameworks 2024,” trai.gov.in The long-term solution may involve hybrid monetization that combines lightweight ads with microtransactions, but this approach risks alienating price-sensitive users who gravitate toward ad-supported models precisely because they avoid upfront payments.
*Our forecasts treat driver/restraint impacts as directional, not additive. The impact forecasts reflect baseline growth, mix effects, and variable interactions.
Online Board Games Market Segment Analysis
By Monetization Model:
Subscriptions Reshape Revenue PredictabilityIn-app purchases delivered 45.72% of 2025 revenue, yet subscription and season-pass plans are set to expand at 5.57% CAGR, the fastest among models. Warmachine’s digital pass converted 22% of its base in the first year, demonstrating that bundled perks and constant content refresh shift spend from episodic to recurring. Flick Solitaire launched a three-tier season-pass system in 2025-free, premium at USD 4.99 per month, and ultimate at USD 9.99 per month-that gates exclusive card backs and daily challenges behind paywalls, generating 35% higher lifetime value than one-time purchasers.
Apple’s privacy rules lowered ad-targeting accuracy, pushing eCPM down and crowding screens with more ads, so diversification across revenue streams now hedges volatility. Paid-up-front apps languish in the single digits because freemium trials dominate discovery. Netflix’s inclusion of board titles inside its video subscription signals that recurring access, not individual SKU sales, will anchor future online board games market growth.


By Platform:
Console And Smart-TV Deployments AccelerateMobile owned 70.63% of 2025 spending, but console and smart-TV formats will climb at a 5.84% CAGR as households pivot to living-room play. Netflix launched 40 mobile games in 2024 and expanded to smart-TV interfaces in 2025, embedding titles like Oxenfree and Into the Breach into its streaming app to keep subscribers engaged between content releases Netflix Investor Letter Q4 2024. Amazon's Fire TV integrated Xbox Cloud Gaming in 2024, enabling subscribers to play board-game adaptations like Catan and Ticket to Ride on television screens without purchasing dedicated consoles.
Tablets claim mid-teen share for family game nights. Meanwhile, PCs serve deep-strategy fans, though their growth lags the shift toward handheld and big-screen casual sessions. Cross-platform progression, where players start on phones and finish on TVs, is emerging as a core retention feature despite raising QA spend up to 40%.
By Game Genre:
RPG Conversions Lead The Tabletop RenaissanceFamily classics such as Monopoly, Scrabble, and Ludo accounted for 27.57% of 2025 income, underscoring the pull of nostalgia. However, RPG and adventure board conversions are expanding at 6.01% CAGR through 2031, the fastest rate among genre segments, as the success of Baldur's Gate 3-which sold 15 million copies and won Game of the Year in 2023-validated demand for rules-heavy digital tabletop experiences. High-tech technology for the game is in trend and driving the Global Online Adventure Game Market by giving more real-time experiences to the users.
Strategy and abstract titles remain evergreen due to competitive ladders, while card-and-dice games rely on event-driven tournaments and cosmetic sales. The genre fragmentation reflects divergent player motivations: family games prioritize accessibility and nostalgia, RPG conversions cater to min-maxers, and strategy titles reward pattern recognition and long-term planning.
By Player Mode:
Multiplayer Dominance Reflects Social ImperativeMultiplayer captured 63.81% of 2025 spend and will rise at 6.17% CAGR as synchronous play cements community stickiness. Voice chat, ranked ladders, and cross-device lobbies deepen engagement. Player-versus-player formats dominate competitive genres like chess and card games, where ranked ladders and leaderboards provide extrinsic motivation, while co-op and team-play modes appeal to households seeking shared entertainment experiences
Single-player AI modes serve onboarding and low-bandwidth niches but face free open-source competition such as Stockfish and Leela Chess Zero. Turn-based asynchronous loops cater to working adults seeking flexible session lengths, preserving relevance within the online board games industry.
Geography Analysis
APAC Online Board Games Market
Asia-Pacific generated 34.53% of 2025 revenue, powered by China’s preference for homegrown IP, Japan’s commuter gaming culture, and India’s 400 million-player base supported by sub-USD 100 smartphones. Tencent met new real-name and minor play-time limits via biometric verification, sustaining reach within the online board games market. Bandwidth throttling, however, undercuts ad-funded models in India and Indonesia.
North America Online Board Games Market
North America accounted for roughly 28% of 2025 spend thanks to high ARPU and console-to-mobile crossover adoption. State-level fragmentation around loot-box rules complicates compliance, yet sizable discretionary income still enables robust virtual-goods demand. Canada’s mandatory French localization for Quebec elevates production budgets but unlocks a lucrative bilingual cohort.
EMEA and South America Online Board Games Market
Europe supplied about 22% of revenue. GDPR limits behavioral advertising and accelerates subscription uptake, while Belgium and the Netherlands enforce outright loot-box bans. The Middle East, led by Saudi Arabia’s USD 38 billion Savvy Games Group program, is the fastest-growing territory, with a 5.98% CAGR, as the region builds studios and esports venues. Africa remains nascent due to sub-10 Mbps average speeds, but M-Pesa mobile money in Kenya and South Africa enables microtransactions where credit cards are scarce. South America sits in low single-digit share; Brazil’s macro volatility tempers dollar-denominated growth even as player numbers climb.

Regulatory Landscape
Regulation for online board games is increasingly shaped by rules that treat monetization mechanics, safety controls, and intermediary-service obligations as compliance pillars. In the European Union, the Digital Services Act (effective since February 17, 2024) applies obligations to services with interactive features such as in-game chat and user-generated content, pushing studios toward stronger notice-and-action processes and, for non-EU providers, the appointment of an EU legal representative.
India moved toward a dedicated governance structure for online games with the Promotion and Regulation of Online Gaming Rules, 2026, notified by the Ministry of Electronics and Information Technology (MeitY) on April 22, 2026 and in force from May 1, 2026. The rules establish the Online Gaming Authority of India as an attached office under MeitY to oversee registration and classification, which raises compliance requirements for publishers distributing monetized titles in one of the largest mobile-first markets.
Value Chain Analysis
The value chain starts with IP owners and publishers (including tabletop licensors) defining game scope, monetization, and live-ops cadence, then shifts to third-party studios and independent developers who translate rulebooks into deterministic digital rules engines. Core inputs include development stacks (Unity and web frameworks), rule frameworks such as boardgame.io, and backend components for real-time play (state storage, matchmaking, and synchronization services).
Increasingly, creator and publishing platforms such as Board Game Arena provide studio tooling, while no-code or assisted-build services (Boardible, Board.fun, Boardcade) reduce time-to-market through templates, shared infrastructure, and distribution-ready packaging. Distribution then runs through mobile app stores, Steam, and browser-based portals, with monetization handled via platform payments and in-game commerce. Operational bottlenecks remain centered on multiplayer reliability (authoritative state validation, reconnection handling, and websocket scaling), cheat resistance, and cross-platform UI consistency, which together increase ongoing infrastructure and QA costs; publishers that reuse proven synchronization patterns and platform backends can redirect spend toward content updates, IP events, and community features that support subscriptions and in-app purchases.
Competitive Landscape
The online board games market remains fragmented; the top five publishers-Zynga, Tencent, Scopely, Hasbro, and Nintendo-controlled an estimated 35% of 2025 revenue. Zynga cross-promotes Words With Friends and Poker to cut acquisition costs 40%. Tencent embeds mini-board games in WeChat, bypassing app store fees and reaching 600 million monthly players. Scopely’s Monopoly GO! crossed USD 3 billion lifetime revenue by aligning limited-time boards with real-world holidays.
Large incumbents lean on franchise licensing to leverage built-in fan bases, while independents emphasize accessibility and procedural content. Hasbro’s Universes Beyond brings Magic: The Gathering and Warhammer into Dungeons and Dragons digital scenarios to cross-pollinate communities. Voice-interface startups target visually impaired gamers, and blockchain-native studios monetize perpetual royalties on secondary trades. Microsoft’s 2024 patent for real-time difficulty adjustment hints at adaptive AI as the next moat.
Open-source AI chess engines erode premium single-player revenue, so differentiation now centers on social features, cosmetics, and cross-device convenience. Compliance agility likewise shapes advantage as publishers navigate divergent loot-box policies, data-privacy mandates, and sustainability disclosures across regions.
Online Board Games Industry Leaders
Zynga Inc.
Tencent Holdings Ltd.
Scopely (MONOPOLY GO!)
Supercell OY
PLR Worldwide Sales Limited
- *Disclaimer: Major Players sorted in no particular order
Online Board Games Market Companies Covered in this Report
- Zynga Inc.
- Tencent Holdings Ltd.
- Scopely (MONOPOLY GO!)
- Marmalade Game Studio
- Asmodee Digital
- Nintendo Co., Ltd.
- GungHo Online Entertainment
- Chess.com
- Mattel163
- Hasbro Inc.
- Versus Evil, LLC
- PLR Worldwide Sales Limited
- Supercell OY
- Ravensburger Digital
- SciPlay (Playtika)
- King Digital Entertainment
- Games24x7
- Moonfrog Labs
- SubZero Entertainment Pvt. Ltd.
- Jam City
- Niantic Inc.

Market Opportunities and Future Outlook
Product and platform opportunities are widening around creation tools, frictionless access, and hybridized play formats that connect physical and digital sessions. In June 2026, Board raised USD 20 million in Series A funding led by Union Square Ventures and paired it with Board Studio, an AI-assisted creation workflow that enables custom game building via natural-language prompts. The funding and workflow point to renewed focus on user-generated board-game content and premium hybrid hardware experiences. Alongside this, browser-based, no-download portals and lightweight web stacks lower installation barriers and can expand reach in markets where storage constraints and device variability limit conversion on heavier native clients.
Monetization and engagement opportunities increasingly depend on deterministic alternatives to chance-based mechanics and on scalable live-ops content pipelines. Subscription and season-pass bundles fit generative content refresh and cross-platform progression, while IP-led events remain a repeatable retention lever when acquisition costs are high. Web3 and tradable digital assets offer incremental revenue through secondary-market royalties, but uptake hinges on clear consumer-protection disclosures and readiness for regional compliance, including EU crypto-asset and service obligations and local gaming-rule classifications in markets such as India.
Recent Industry Developments in Online Board Games Market
- June 2026: Scopely launched The Simpsons collaboration in MONOPOLY GO! (running from June 3 through July 29, 2026) with themed events and collectibles. The scale and duration of the crossover reinforced the game’s live-service playbook of IP-driven seasons to sustain engagement and monetize time-limited progression loops.
- December 2025: Scopely rolled out a Harry Potter collaboration for MONOPOLY GO! starting December 10, 2025. The partnership extended the title’s cadence of franchise tie-ins that refresh content without rebuilding core gameplay systems.
- December 2024: Netflix extended its games catalog to smart-TV platforms in about 50 countries and introduced controller-compatible gameplay. The move broadened the addressable living-room footprint for digital board and party-style titles distributed inside a video subscription bundle.


Online Board Games Market Report Scope and Research Methodology
Market Definition and Coverage
For this report, the market covers revenue generated from playing board games through online or connected digital formats. Here, gameplay is delivered on the internet through apps or browser-based platforms, and revenue is recognized from purchases, subscriptions, ads, or in-app spending.
Scope exclusions: We exclude sales of physical boxed board games that do not have an online play component.
Segments Covered in This Report
- By Monetisation Model
- Advertising-Supported
- In-App Purchase (Virtual Goods/Boosters)
- Paid-App Purchase (Premium)
- Subscription/Season-Pass
- By Platform
- Mobile (Smartphone)
- Tablet
- PC / Browser
- Console and Smart-TV
- By Game Genre
- Strategy and Abstract (Chess, Go, Xiangqi)
- Card and Dice (Uno, Yahtzee, Poker)
- Family and Classic (Monopoly, Scrabble, Ludo)
- Puzzle and Trivia
- RPG and Adventure Board Conversions
- By Player Mode
- Multiplayer (Real-time/Turn-based)
- PvP
- Co-op/Team-play
- Single-Player (AI)
- Multiplayer (Real-time/Turn-based)
- By Geography
- North America
- United States
- Canada
- South America
- Brazil
- Argentina
- Rest of South America
- Europe
- Germany
- United Kingdom
- France
- Italy
- Spain
- Rest of Europe
- Asia-Pacific
- China
- Japan
- South Korea
- India
- Australia
- New Zealand
- Rest of Asia-Pacific
- Middle East
- United Arab Emirates
- Saudi Arabia
- Rest of Middle East
- Africa
- South Africa
- Kenya
- Rest of Africa
- North America
Data Sources, Market Sizing, and Validation
Desk Research
Desk work began with clarifying what counts as an online board game and how revenue recognition should be handled, since some sources mix these titles into wider casual gaming categories. We referenced public sources such as ITU connectivity indicators, World Bank macro series on income and internet access, OECD digital economy publications, and app marketplace policy pages covering payment and monetization rules, since these affect how spend gets recorded.
To ground assumptions, we also used company filings and investor decks from listed publishers and platform operators, along with association websites and reputable press coverage on gaming engagement and consumer spend. For spot checks on patent activity linked to digital gameplay features and monetization mechanics, we used a paid patent database, and for company financials and news tracking we relied on a paid financial intelligence subscription. These examples are not exhaustive, and other public and paid sources were used to collect data, validate it, and close open questions.
Primary Interviews and Surveys
Primary discussions were used to pressure-test monetization splits, typical price points, and how much play happens on mobile versus browser or PC, since platform mix can shift the revenue total. We spoke with publishers, platform operators, and channel-side experts across major regions to validate adoption trends, payer conversion assumptions, and the pace at which subscriptions and in-app purchases are replacing one-time paid downloads.
Distribution of primary research fieldwork respondents
| Company type | Respondent position | Region |
|---|---|---|
| Top tier: 30% | CXOs: 12% | APAC: 48% |
| Mid tier: 56% | Functional/Unit leaders: 32% | EMEA: 34% |
| Smaller Players: 14% | Managers: 56% | Americas: 18% |
Market-Sizing & Forecasting
Sizing was built using a top-down and bottom-up blend. The main path reconstructs demand by linking online gaming participation to payer behavior, then translating it into revenue by platform and monetization model. Practically, we started from regional online user bases and gaming participation signals, applied board-game share and payer conversion inputs, and then used average revenue per paying user and ad yield assumptions to land at total value.
To keep the model connected to observable signals, inputs were tuned using variables such as smartphone and broadband penetration, time spent on gaming apps, the mix of free-to-play versus paid download behavior, subscription take-up for game libraries, and typical in-app purchase price ladders. Where needed, selective bottom-up checks were used, including sampled title-level price points, publisher revenue disclosures where available, and channel checks on how revenue is split across mobile stores versus browser-based play. When public disclosures were thin, gaps were handled by using proxy ranges from adjacent digital board game catalogs and then narrowing them through expert feedback.
For forecasting, we used scenario analysis supported by primary feedback, since growth depends on changing monetization (subscriptions, ads, and in-app spending) as much as it does on user growth. Scenarios were anchored around adoption pace in Asia-Pacific, regulatory shifts impacting digital payments, and expected changes in app store fee structures and promotion dynamics.
Data Validation & Update Cycle
Outputs were cross-checked against independent signals such as app category rankings, shifts in mobile versus browser usage, and whether implied spend per payer remained realistic by region. Any sharp step-ups or drop-offs were reviewed, and assumptions were re-checked with follow-up calls when the numbers could not be explained by known events.
Before sign-off, the model goes through a multi-step analyst review so that arithmetic, definitions, and year-to-year movement remain consistent. Reports are refreshed annually, and interim updates are done when material events occur, such as major platform policy changes or step changes in monetization. Right before delivery, we run a final review pass so clients receive the most current view available.
Mordor Intelligence's Global Online Board Games Market Sizing Compared With Other Published Estimates
Published numbers for online board games often differ because sources do not always treat online play, monetization, and platform coverage the same way, and then those differences get amplified when they are projected forward. It is also common to see different base years, different currency timing, and different assumptions for payer conversion and ad monetization.
The table points to a narrow spread around the low USD 2B range, and the largest gap usually comes from what is counted as an online board game versus what gets pulled into wider digital board and card gaming. Under Mordor Intelligence's scope, physical boxed board game sales are excluded and revenue is counted only when play is delivered through connected apps or browser platforms with online delivery and monetization, which avoids inflating totals with offline retail and adjacent tabletop spend.
Benchmark comparison
| Source | Market Size | Gaps in Research Methodology |
|---|---|---|
| Mordor Intelligence | USD 2.28 B (2025) | |
| Industry Research House A | USD 2.30 B (2024) | Uses a different base year and tends to treat the category as a single total without clearly separating browser-based online play from broader digital tabletop and card game revenue, which can shift inclusion boundaries. |
| Regional Consultancy B | USD 2.30 B (2024) | Provides a point estimate around USD 2.3B but offers limited clarity on whether ad-supported play and subscriptions are fully captured, and how regional currency conversion timing is handled. |
Across the three figures, most of the variance is explained by scope edges (online-only revenue versus broader digital tabletop) and by how monetization is normalized across regions and years. By keeping the model tied to observable adoption and monetization inputs, the final number stays traceable to repeatable steps rather than being driven by one broad assumption.


Key Questions Answered in the Report
How fast will revenue from subscriptions grow?
Subscription and season-pass plans are on track to rise at a 5.57% CAGR between 2026 and 2031, the quickest pace among monetization models.
Which region is the quickest riser?
The Middle East is projected to log a 5.98% CAGR through 2031, outpacing all other territories due to large-scale sovereign investment.
Why are RPG board conversions surging?
Successful digital adaptations such as Dungeons and Dragons campaigns demonstrate pent-up demand for deep rulesets, leading the genre to a 6.01% CAGR outlook.
Will loot-box bans cut overall spending?
Short-term revenue dips of 15%–25% are expected where random rewards are restricted, but publishers are offsetting with deterministic season passes and cosmetics.
How large is multiplayer’s share today?
Multiplayer modes represented 63.81% of 2025 revenue and hold the strongest growth trajectory at a 6.17% CAGR through 2031.
Page last updated on:


 Your data is secure and never sold or shared.


