
Online Action Games Market Size and Share
Market Overview
| Study Period | 2020 - 2031 |
|---|---|
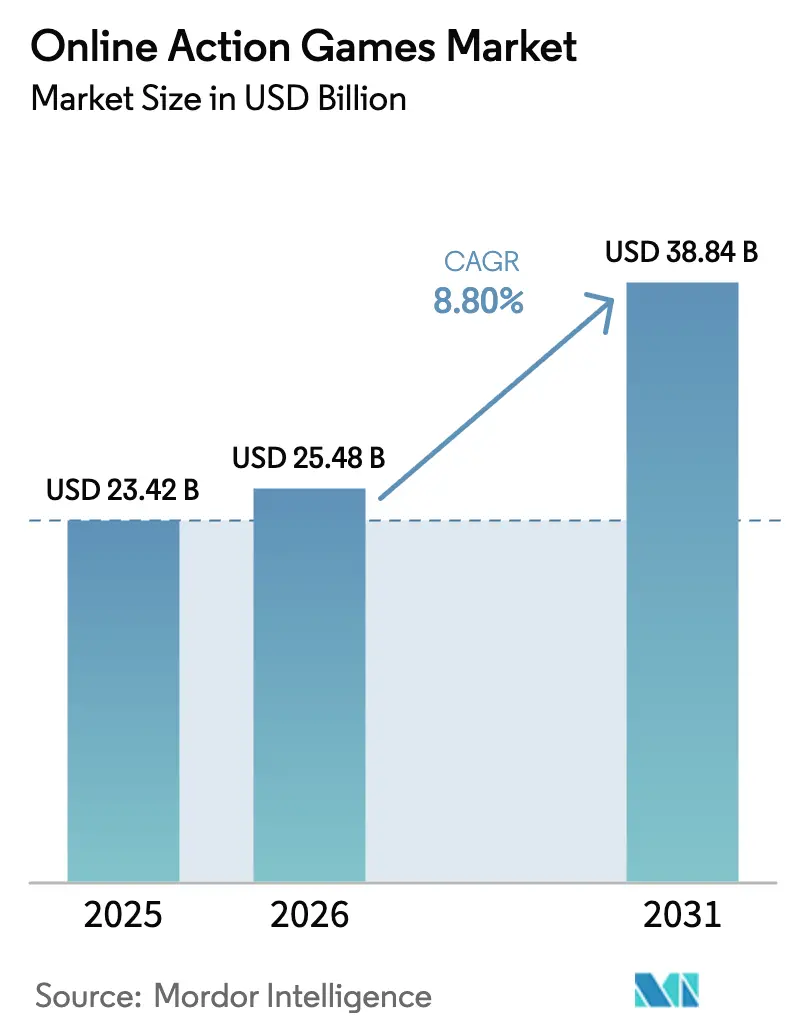
| Market Size (2026) | USD 25.48 Billion |
| Market Size (2031) | USD 38.84 Billion |
| Growth Rate (2026 - 2031) | 8.80% CAGR |
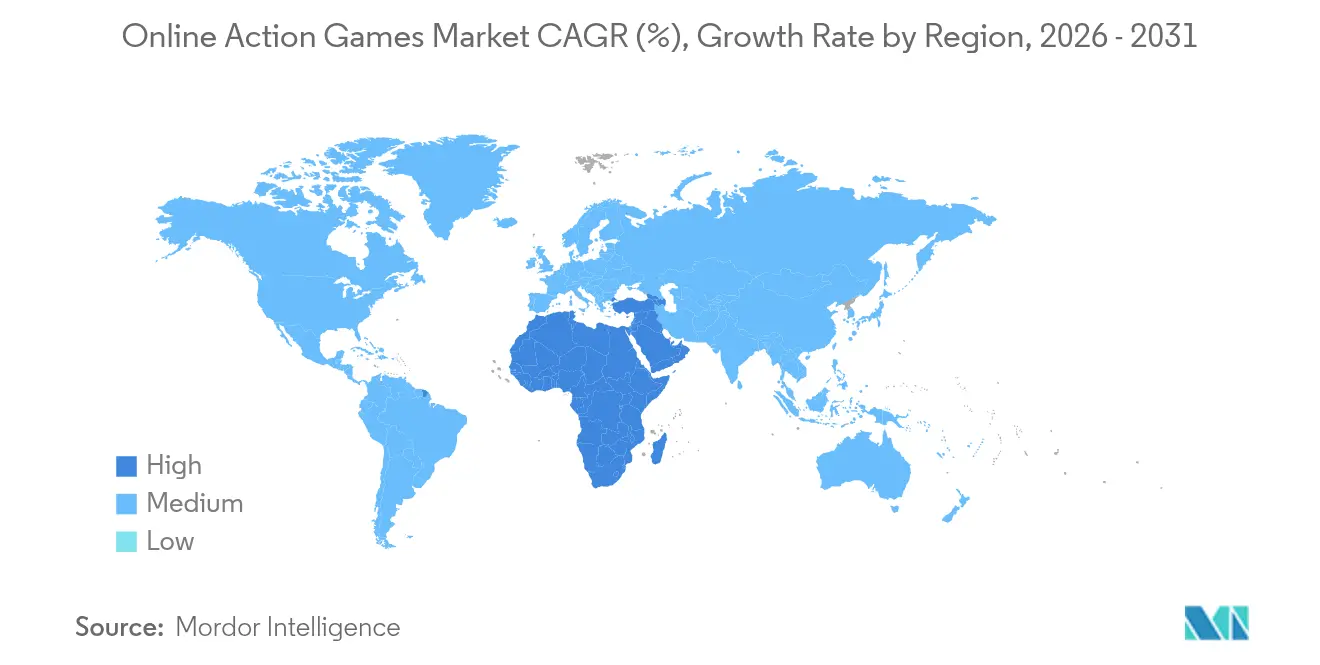
| Fastest Growing Market | Middle East |
| Largest Market | Asia |
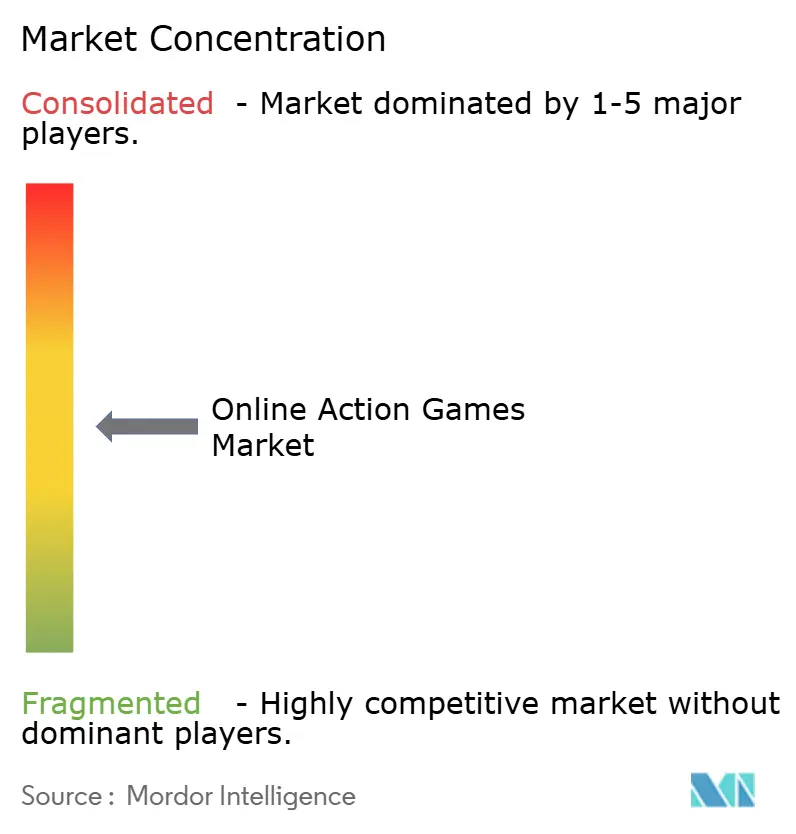
| Market Concentration | Medium |
Major Players *Disclaimer: Major Players sorted in no particular order Image © Mordor Intelligence. Reuse requires attribution under CC BY 4.0. | |
Online Action Games Market Analysis by Mordor Intelligence
Online Action Games Market size in 2026 is estimated at USD 25.48 billion, growing from 2025 value of USD 23.42 billion with 2031 projections showing USD 38.84 billion, growing at 8.80% CAGR over 2026-2031.
The Online Action Games Market size is estimated at USD 23.42 billion in 2025, and is expected to reach USD 38.60 billion by 2030, at a CAGR of 8.95% during the forecast period (2025-2030). Uptake of 5G handsets in Asia-Pacific (APAC) and the Middle East and North Africa (MENA) is lowering median multiplayer latency below 40 ms, driving longer play sessions and higher conversion to in-game purchases.[1]Ericsson, “Elevating 5G with differentiated connectivity,” ericsson.com Cross-platform engines such as Unreal and Unity are compressing porting schedules, enabling publishers to ship day-one builds for console, PC, and mobile with a single art pipeline.[2]Epic Games, “Building Multi-Platform Games in Unreal Engine,” unrealengine.com Cloud-streaming alliances with telcos and smart-TV makers are widening access in bandwidth-constrained markets, a shift that is already visible in Brazil, India, and Nigeria.[3]Xbox Wire, “Xbox Gaming Coming to Amazon Fire TV: Play More Games, No Console Needed,” news.xbox.com Meanwhile, escalating esports prize pools in the shooter sub-genre are amplifying spectator interest and funneling fresh advertising spend into first-person and hero-shooter ecosystems. On the monetization front, generative-AI-powered operations are supporting tailored events and dynamic storefronts, lifting average revenue per user (ARPU) in tier-1 markets
Key Report Takeaways
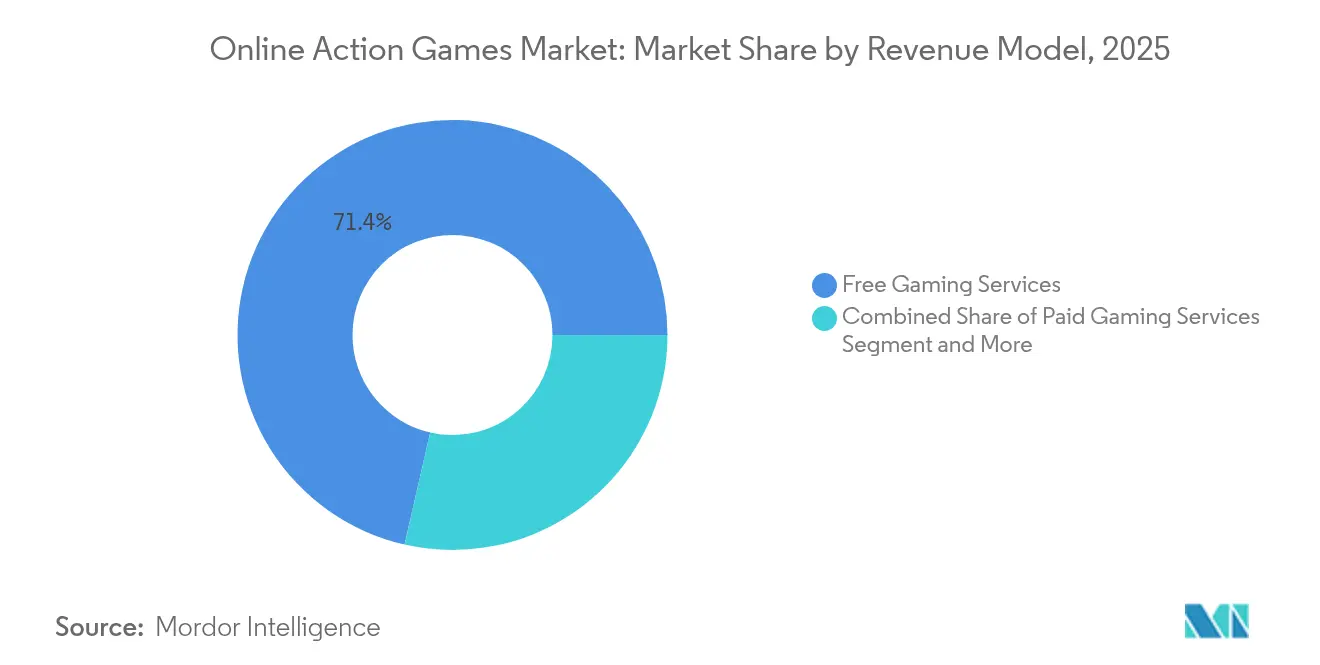
- By revenue model, free gaming services led with 71.42% share in 2025; subscription-based gaming services show the highest projected CAGR at 12.35% through 2031.
- By platform, mobile phones commanded 55.23% of 2025 revenue; cloud gaming platforms are forecast to expand at an 17.62% CAGR to 2031.
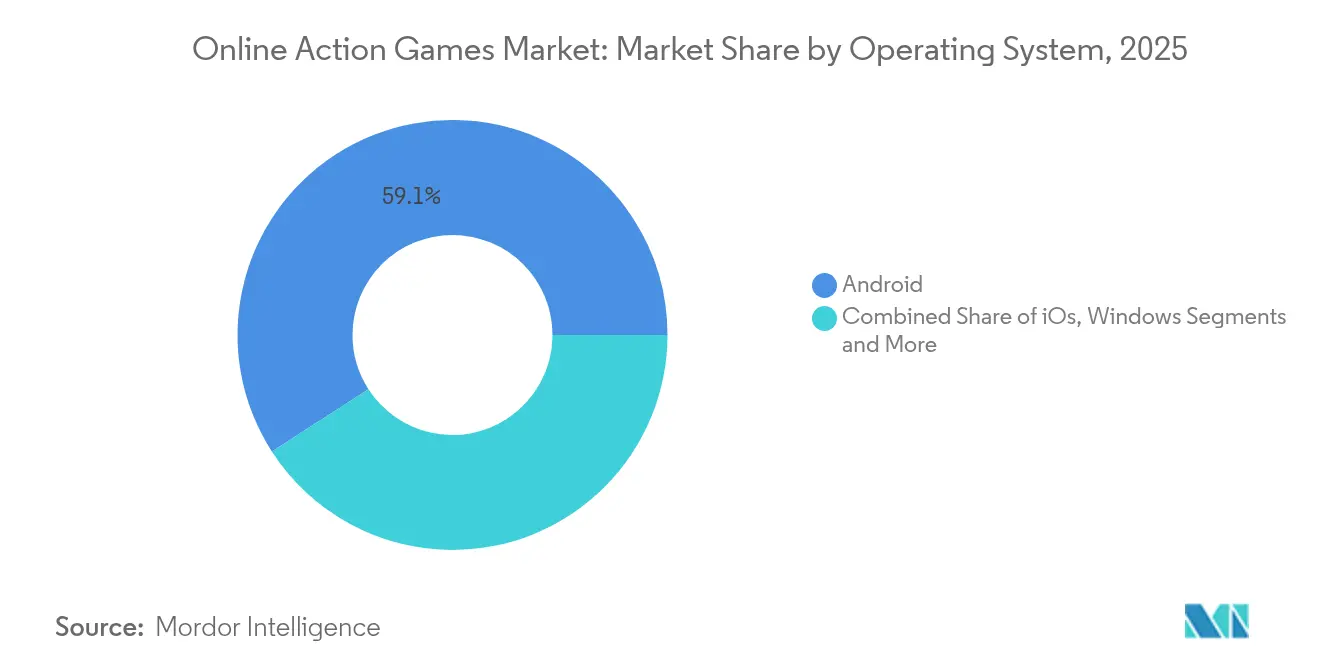
- By operating system, Android captured 59.12% share in 2025 while iOS is poised for the fastest 2026-2031 growth at 9.88% CAGR.
- By geography, Asia-Pacific generated 51.35% of 2025 sales; the Middle East and Africa is projected to grow the quickest at a 13.58% CAGR through 2031.
Note: Market size and forecast figures in this report are generated using Mordor Intelligence’s proprietary estimation framework, updated with the latest available data and insights as of 2026.
Global Online Action Games Market Trends and Insights
Drivers Impact Analysis*
| Driver | (~) % Impact on CAGR Forecast | Geographic Relevance | Impact Timeline |
|---|---|---|---|
| 5G-enabled low-latency mobile play | +1.10% | APAC, MENA | Medium term (2-4 years) |
| Cross-platform engines reducing porting costs | +0.80% | Global | Short term (≤ 2 years) |
| Cloud-streaming partnerships in emerging markets | +0.90% | Latin America, Africa | Medium term (2-4 years) |
| Esports prize-pool escalation in shooter titles | +0.60% | North America, Europe, Korea | Long term (≥ 4 years) |
| GenAI-driven live-ops personalization boosting ARPU | +0.70% | North America, Europe, Japan | Short term (≤ 2 years) |
| European tax incentives stimulating AAA pipelines | +0.40% | France, United Kingdom, Italy, Spain | Medium term (2-4 years) |
| Source: Mordor Intelligence | |||
5G-Enabled Low-Latency Mobile Action Gaming Adoption across APAC and MENA
Commercial 5G rollouts across India, Saudi Arabia and the United Arab Emirates have slashed median round-trip latency for multiplayer titles, enabling real-time hit detection and smoother competitive play. Network-slicing pilots in Riyadh and Mumbai allocate assured throughput tiers for game packets, translating into 20% higher session lengths compared with 4G cohorts. Publishers are responding by staging timed live-ops events optimized for sub-50 ms latency, accelerating regional revenue pick-up.
Cross-Platform Game Engines Reducing Porting Costs
Unreal Engine and Unity now ship multi-target build tools that reuse shaders and asset bundles across PC, console and mobile SKUs, trimming porting cycles by up to 30 days per platform. Independent studios can therefore reach addressable install bases exceeding 2 billion devices while maintaining a single QA pipeline. The move also improves time-to-market for downloadable content, reinforcing player retention.
Cloud-Streaming Partnerships Expanding Access in Emerging Markets
Microsoft’s Boosteroid and Amazon Fire TV tie-ups provide console-grade action titles on sub-USD 50 streaming sticks, eliminating hardware barriers in mass-market households. Telcos bundle zero-rated data tiers with premium game passes, converting prepaid subscribers who exhibit low willingness to pay for consoles. The model broadens funnel reach for AAA shooters and brawlers in Brazil, South Africa and Indonesia.
Esports Prize-Pool Escalation in Shooter Sub-genre
The 2024 VALORANT Champions purse of USD 2.25 million outranked 2023’s pot by 29%, catalyzing record peak concurrent viewership of 1.3 million across Twitch and Huya. Higher visibility translates into brand-sponsored in-game cosmetic bundles and battle-pass uplifts, channeling incremental funding back to tournament circuits and sustaining a virtuous monetization loop.
Restraints Impact Analysis*
| Restraint | (~) % Impact on CAGR Forecast | Geographic Relevance | Impact Timeline |
|---|---|---|---|
| Post-ATT mobile user-acquisition cost spike | −0.7% | North America, Europe | Short term (≤ 2 years) |
| Violence-content regulations in China and South Korea | −0.6% | East Asia | Medium term (2-4 years) |
| High real-time multiplayer infrastructure costs for indies | −0.5% | Global | Short term (≤ 2 years) |
| Escalating cybersecurity threats in competitive play | −0.4% | Global | Long term (≥ 4 years) |
| Source: Mordor Intelligence | |||
Rising User-Acquisition Costs post-ATT on Mobile Ad Networks
Apple’s App Tracking Transparency (ATT) framework has suppressed ID-level targeting, inflating average CPI (cost per install) for action genres by 25% year on year. Publishers divert spend toward influencer-led discovery channels, but conversion efficiency remains below pre-ATT baselines, compressing margins on free-to-play launches.
Violence-Related Content Regulations in China and South Korea
Stringent content grading standards in China’s National Press and Publication Administration and South Korea’s Game Rating and Administration Committee impose capricious approval timelines for blood and gunfire depictions. Studios often reshoot entire cinematics or recolor particle effects, inflating localization budgets and delaying monetization windows in two of the world’s most lucrative markets.
*Our forecasts treat driver/restraint impacts as directional, not additive. The impact forecasts reflect baseline growth, mix effects, and variable interactions.
Segment Analysis
By Revenue Model: Subscription momentum complements dominant free-to-play economics
Subscription offerings contribute 13.25% of 2025 spend, yet their growth trajectory at 12.35% CAGR exceeds that of ad-funded free services. Competitive publishers differentiate by bundling a rotating catalog of premium shooters, early access to DLC and platform-agnostic cloud saves. In turn, the online action games market size for subscription tiers is projected to reach USD 6.23 billion by 2031, capturing players averse to micro-transactions.
Diversified hybrids such as battle-pass models combine predictable recurring revenue with aspirational cosmetic unlocks. Premium passes priced at USD 9.99 per season achieve an attach rate above 35% in tier-1 countries, feeding into higher monthly active user retention. Conversely, advertising-supported experiences remain critical for emerging markets where average spend per paying user trails the global mean by over 45%.


By Platform: Mobile leads, cloud accelerates
Mobile phones held 55.23% revenue share in 2025, anchored by extensive Android device penetration in India, Indonesia and Nigeria. Edge-rendering and low-memory texture packs now secure console-like fidelity on mid-tier SOCs, narrowing the experiential gap with dedicated hardware. Cloud gaming platforms, although only 5.6% of revenue in 2025, enjoy the fastest climb at an 17.62% CAGR, aided by bundled 5G fixed-wireless plans. The online action games market share for cloud services could breach 11.75% by 2031 if 5G SA networks achieve 65% nationwide coverage across APAC.
Interoperability gains traction as Xbox Cloud Gaming broadens to Amazon Fire TV, and Boosteroid introduces day-one AAA releases. This mitigates hardware cycle risk for publishers and enables asset amortization across a larger paying audience. Parallel improvements in Wi-Fi 6E routers further reduce input lag, strengthening living-room cloud adoption.
By Operating System: Android breadth confronts iOS monetization edge
Android captured 59.12% of gross spending as of 2025, largely due to handset affordability in Asia and Africa. Yet iOS devices deliver lifetime value per payer that is 1.7 times higher, influenced by higher disposable income segments in North America and Western Europe. Cross-save ecosystems encourage dual-device play, with one-third of Korean shooter users alternating between iPhone and Windows PC during a single 24-hour period.
Platform holders intensify efforts to keep developers loyal: Apple elevates Metal performance layers for Unreal Engine, while Google Play Games for PC exits beta with full keyboard and mouse remapping. Such moves narrow feature disparities and incentivize simultaneous update cadences across operating systems.
Geography Analysis
Asia-Pacific generated 51.35% of global revenue in 2025, underpinned by mobile-first markets such as China, South Korea and India. Government-led fiber-to-home investment in South Korea pushes average downstream speeds beyond 200 Mbps, sustaining 240 Hz shooters and 4K streaming campaigns. However, the introduction of play-time caps in China tempers under-18 monetization velocity, shifting publisher focus toward adult whales and cross-border Southeast Asian growth.
North America follows as the second-largest territory, benefitting from console install-base density and robust esports infrastructure. Franchise tie-ins with Hollywood IP accelerate brand recognition, while league-based monetization—echoing traditional sports media rights—strengthens recurring revenue streams. Yet rising labor costs in California and Texas AAA studios encourage outsourcing to Montreal, Vancouver and Guadalajara to preserve project margins.
Europe’s regulatory climate remains fragmented; tax incentives in France, the United Kingdom and Italy underpin the resurgence of AAA single-player action titles, enriching the wider ecosystem through asset reuse in multiplayer expansions. Eastern Europe, spearheaded by Poland and Romania, emerges as a cost-competitive hub for Unreal Engine programmers, attracting outsourcing contracts from Western publishers seeking to expedite concurrent PC-console releases.

Regulatory Landscape
Regulatory landscape developments across major markets in 2026 point to tighter requirements for youth protection, monetization design, and data privacy. In India, the Promotion and Regulation of Online Gaming Rules, 2026 took effect on May 1, 2026, establishing the Online Gaming Authority of India to register games and handle grievances. In the United States, effective April 22, 2026, COPPA was amended to expand what counts as personal information and to raise consent requirements for certain advertising practices. In Brazil, the Felca Law, effective March 17, 2026, prohibits paid loot boxes in games accessible to minors and introduces age verification expectations.
In Europe, safety and transparency obligations are reinforced through the EU Digital Services Act and the UK Online Safety Act, while PEGI updates cover in-game spending and communication features. Gibraltar's new Gambling Act entered into force on April 1, 2026, updating licensing and compliance requirements.
Competitive Landscape
The market features a blend of platform holders and content specialists. Tencent, Sony Interactive Entertainment (SIE) and Activision Blizzard jointly accounted for an estimated top-five combined share of around 45% in 2024. Tencent leverages its multi-tenant cloud infrastructure to run battle-royale instances hosting 120-player lobbies, enhancing retention rates among Gen Z users. SIE’s minority stake in African publisher Carry1st signals a sustained effort to seed PlayStation Network presence across sub-Saharan Africa.
Activision Blizzard continues to refine seasonal cadence for its flagship first-person shooter, integrating AI-assisted anti-cheat modules to curb competitive integrity threats. Ubisoft doubles down on its proprietary Anvil engine for open-world brawlers, while simultaneously trialing Unreal Engine 5 for vertical-slice prototypes to fast-track next-gen console scalability. Independent darlings such as FromSoftware and PlatinumGames cultivate niche yet loyal fan bases via distinctive combat mechanics and punishing difficulty loops.
Consolidation remains a salient feature: Embracer Group’s divestitures open acquisition windows for cash-rich platform holders pursuing exclusive cloud-streaming rights. Meanwhile, NetEase and NEXON scale Western satellite studios to secure fresh IP that resonates beyond their domestic markets.
Online Action Games Industry Leaders
Tencent
Sony Interactive Entertainment
Konami
Capcom
Ubisoft
- *Disclaimer: Major Players sorted in no particular order

Market Opportunities and Future Outlook
Cloud delivery and cross-platform development continue to create distribution and monetization whitespace for online action games, especially where consoles remain underpenetrated. Cloud gaming accounted for 5.6% of 2025 revenue, while mobile phones contributed 55.23% share. Partnerships that pair cloud streaming with telcos and smart-TV makers broaden access in markets such as Brazil, India, and Nigeria, and Xbox Cloud Gaming expansion to Amazon Fire TV further supports that availability.
Operational execution also remains a key opportunity area. Platform-grade back-end services and AI-enabled tooling are being used to improve matchmaking, anti-cheat, and personalization at scale. Tencent is positioning itself as a Games-as-a-Service infrastructure provider, offering backend ecosystems, anti-cheat protocols, and matchmaking to Western partners such as Ubisoft, helping smaller studios tap shared capabilities. Capcom, meanwhile, reports a global gaming player base of 3.5 billion, with PC and Console segments reaching 1.5 billion users, and is focused on extending catalog value through multi-platform strategies that align with recurring content drops, seasonality, and hybrid monetization models.
Recent Industry Developments
- July 2026: Tencent - Globally launched ADP 4.0, an enterprise-grade AgentOps platform for AI agent development, unveiled at the World Artificial Intelligence Conference. The release strengthens tooling that can be repurposed across game operations workflows such as customer support automation, live-ops experimentation, and internal content pipelines, supporting faster iteration cycles for online action titles. It also reinforces the trend of large game ecosystems commercializing platform capabilities beyond content alone.
- July 2026: Tencent - Launched Hy3, a hybrid fast-and-slow-thinking model with 295 billion parameters, following its April 2026 preview. The model provides a scalable AI backbone for game development, publishing, and monetization workflows. This strengthens Tencent's AI-driven capabilities across its global games ecosystem.
- May 2026: Tencent Games - Announced 45 major updates at SPARK 2026 conference for Chinese and global markets. The breadth of updates signals continued platform evolution and monetization enhancements across Tencent's live-service portfolio. The announcements reinforce Tencent's commitment to a dynamic live-service cadence across core shooter and brawler franchises.


Research Methodology Framework and Report Scope
Market Definition and Coverage
For this study, the market covers revenue earned from online action video games across PC, console, and mobile, including paid game sales and recurring spend like subscriptions and in-game purchases. We treat revenue as recognized spending tied to active online gameplay and live-service delivery.
Scope exclusions: We exclude offline-only action titles, hardware sales, esports betting, and pure advertising revenues that are not directly linked to an online action game.
Segmentation Overview
- By Revenue Model
- Free Gaming Services
- Paid Gaming Services
- Subscription-Based Gaming Services
- Hybrid Battle-Pass Models
- In-Game Advertising-Supported Free Services
- By Platform
- PCs
- Consoles
- Mobile Phones
- Cloud Gaming Platforms
- XR/VR Devices
- By Operating System
- iOS
- Android
- Windows
- Other Operating Systems (macOS, Linux, ChromeOS)
- By Geography
- North America
- United States
- Canada
- Mexico
- South America
- Brazil
- Argentina
- Rest of SouthAmerica
- Europe
- Germany
- United Kingdom
- France
- Italy
- Spain
- Rest of Europe
- Asia-Pacific
- China
- Japan
- South Korea
- India
- Australia
- New Zealand
- Rest of Asia-Pacific
- Middle East and
- United Arab Emirates
- Saudi Arabia
- Rest of Middle East
- Africa
- South Africa
- Rest of Africa
- North America
Data Sources, Market Sizing, and Validation
Desk Research
Desk research is used to set the market boundary, map online action game monetization flows, and anchor regional demand signals before modeling starts. We typically begin with public statistics and filings that provide consistent time series, which helps avoid overfitting the model to a single strong year.
Key public sources include ITU connectivity and broadband adoption data, World Bank macro indicators, OECD digital economy and household ICT access tables, national telecom regulators' 4G and 5G coverage updates, and IAB style digital advertising and measurement guidance for monetization context. These are then supplemented with company filings, investor presentations, app store policy updates, reputable press reporting, and selective use of paid subscriptions for company financials and intelligence, plus patent databases to track engine, networking, and live-ops innovation signals. The sources listed here are illustrative only, and additional references were used to collect data, validate assumptions, and clarify gaps.
Primary Interviews and Surveys
Primary work is used to pressure test the online action games revenue logic, especially around conversion, retention, and monetization mix by platform and region. We spoke with a mix of publishers, live-ops and monetization leaders, distribution and platform-side stakeholders, and regional experts across the main demand centers, then used their feedback to adjust key assumptions that desk sources cannot reliably show.
These discussions also helped us sanity check price points, promo intensity, and the pace at which new content cycles translate into recurring spend, which then tightens the forecast ranges.
Distribution of primary research fieldwork respondents
| Company type | Respondent position | Region |
|---|---|---|
| Top tier: 31% | CXOs: 20% | APAC: 44% |
| Mid tier: 47% | Functional/Unit leaders: 35% | EMEA: 37% |
| Smaller Players: 22% | Managers: 45% | Americas: 19% |
Market-Sizing & Forecasting
Our sizing starts from a top-down view where the global gaming spend pool is reconstructed by platform and region, and then filtered using genre and online-play penetration indicators to isolate online action titles. After that, we corroborate results using selective bottom-up checks, such as sampled title revenue signals, reasonable ASP and volume proxies for paid downloads, and channel checks on live-service ARPU ranges, which are then used to tune the final totals.
Inputs used in the model include active gamer base and online connectivity indicators, smartphone and console install base trends, in-game purchase mix versus paid downloads, subscription bundle adoption, and live-service content cadence that influences retention and seasonal peaks. When market coverage is thin in smaller regions, gaps are handled by applying penetration and spend intensity ratios validated through interviews, and then rechecking them against broader regional digital spending capacity.
For forecasting, we rely on scenario analysis supported by variable-level outlooks gathered from experts, followed by smoothing of the final series to avoid unrealistic jumps. Growth is then linked back to practical drivers like 5G coverage expansion, cross-platform play availability, and shifting monetization from one-time purchases to recurring spend, so the forecast remains explainable on a client call.
Data Validation & Update Cycle
Model outputs are triangulated against independent signals such as connectivity adoption, platform mix shifts, and observed changes in monetization mechanics that should show up in spending patterns. Outliers are flagged for analyst review, and assumptions are rechecked when a region or platform shows growth that is not supported by engagement or install base direction.
Before sign-off, the work goes through a multi-step review that includes cross-checking math, revalidating key conversion and pricing assumptions, and selectively re-contacting experts when a mismatch remains. Reports are refreshed annually, with interim updates triggered by material events like major platform policy changes, large-scale pricing moves, or sudden regional access disruptions. A final freshness pass is completed right before delivery.
Mordor Intelligence's Global Online Action Games Market Size Measured Against Other Published Estimates
Published market values for online action games often differ because the definition of what is counted as "online" is not consistent, and because recurring spend is treated differently across sources. We keep the estimate tied to observable demand signals, and then use interviews to confirm what portion of spending behavior truly belongs to online action gameplay.
Engagement trends, platform install base direction, and monetization mix checks are the evidence that keep Mordor Intelligence aligned to a realistic revenue pool for online action games, rather than a broader action category that can include offline sales or adjacent genres.
Benchmark comparison
| Source | Market Size | Gaps in Research Methodology |
|---|---|---|
| Mordor Intelligence | USD 25.48 B (2026) | |
| Trade Publisher A | USD 12.91 B (2025) | Uses a combined "online action and adventure" definition with a different base year, and the monetization scope can undercount live-service revenue when it is grouped under broader digital entertainment spend. |
| Industry Portal B | USD 16.31 B (2023) | Covers action games as a broad category without consistently separating online-only play, and the older base year can miss recent shifts toward in-game purchases and subscription bundles. |
Overall, the spread is mainly explained by boundary choices, timing of the base year, and how recurring revenue is classified. By keeping the scope centered on online gameplay revenue and by rechecking key variables through interviews and external signals, our number stays traceable to repeatable inputs rather than a blended genre total.


Key Questions Answered in the Report
What is the current size of the online action games market?
The online action games market stood at USD 25.48 billion in 2026 and is forecast to reach USD 38.84 billion by 2031.
Which platform contributes most to online action game revenue?
Mobile phones lead with 55.23% of 2025 revenue, thanks to widespread Android handset adoption in Asia and Africa.
How fast is cloud gaming growing within the online action games market?
Cloud gaming platforms are expanding at an 17.62% CAGR from 2026 to 2031, the fastest among all delivery platforms.
Why is 5G important for online action games?
5G reduces multiplayer latency below 40 ms, enabling smoother competitive play and encouraging longer in-game sessions, particularly in APAC and MENA.
Which revenue model is accelerating the quickest?
Subscription-based gaming services are projected to grow at a 12.35% CAGR through 2031, as bundled catalogs and cross-save features gain traction.
What are the main restraints on market growth?
Higher user-acquisition costs after Apple’s privacy changes and content restrictions in China and South Korea weigh on short-term revenue expansion.
Page last updated on:






