
Market Overview
| Study Period | 2021 - 2031 |
|---|---|
| Market Size (2026) | USD 680.85 Billion |
| Market Size (2031) | USD 830.62 Billion |
| Growth Rate (2026 - 2031) | 4.06 % |
| Fastest Growing Market | Asia Pacific |
| Largest Market | Asia Pacific |
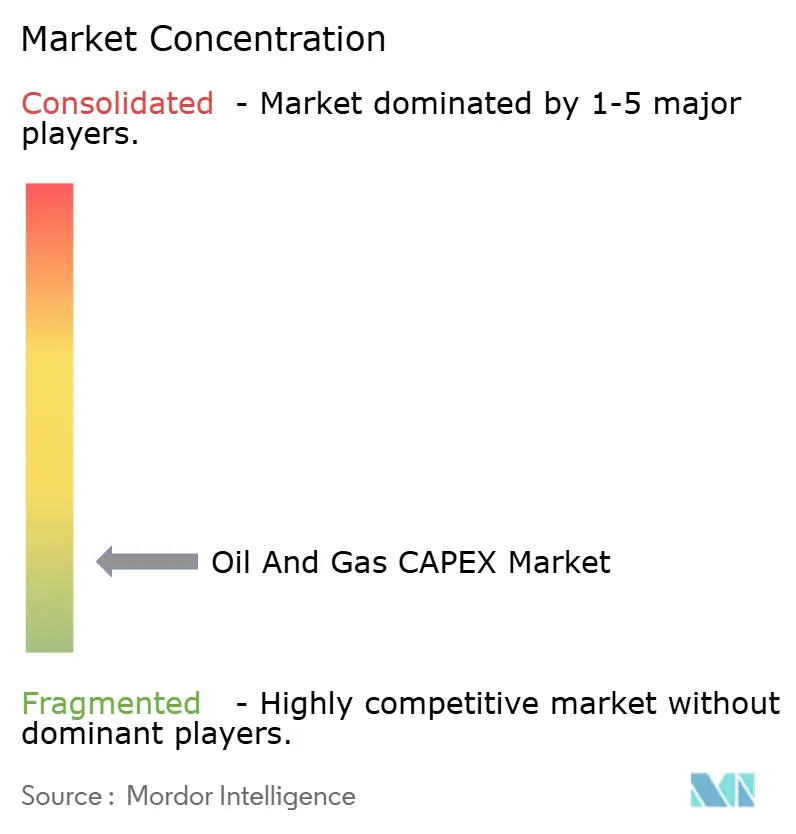
| Market Concentration | Low |
Major Players *Disclaimer: Major Players sorted in no particular order Image © Mordor Intelligence. Reuse requires attribution under CC BY 4.0. | |
Oil And Gas CAPEX Market Analysis by Mordor Intelligence
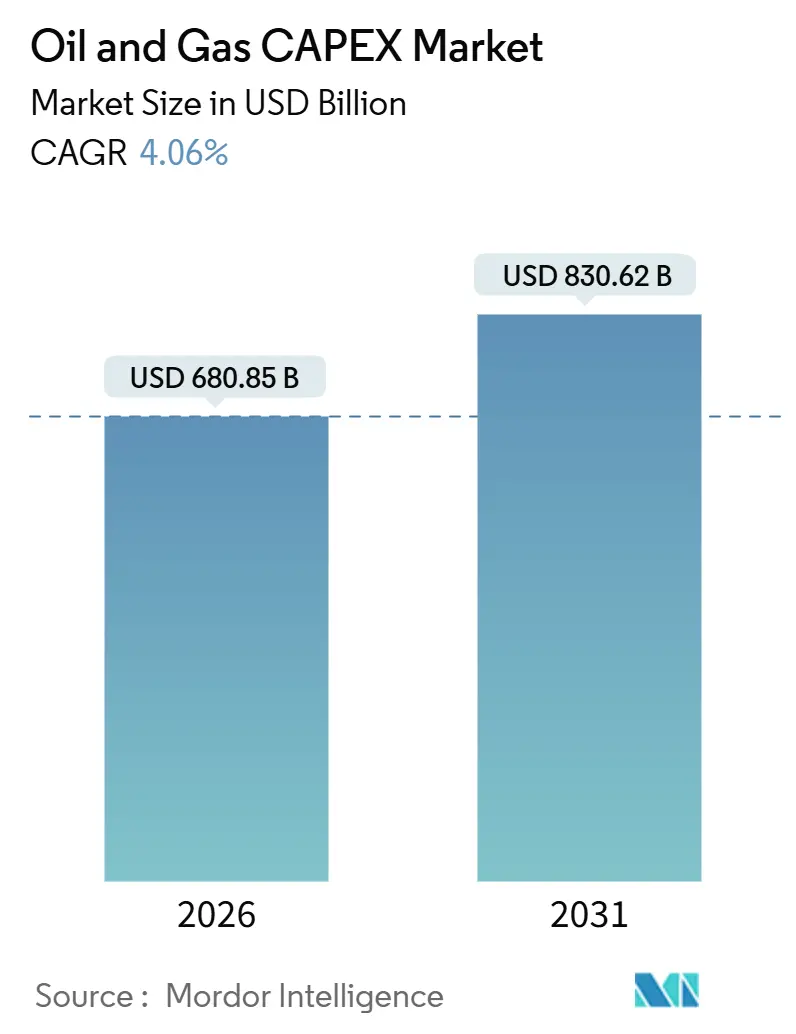
The Oil And Gas CAPEX Market size is estimated at USD 680.85 billion in 2026, and is expected to reach USD 830.62 billion by 2031, at a CAGR of 4.06% during the forecast period (2026-2031).
State-backed operators in the Middle East and Asia are accelerating long-cycle investments even as OECD-based majors curb upstream budgets under tightening ESG covenants, creating a two-speed capital landscape. Deepwater final investment decisions (FIDs) that sanctioned 15 billion barrels of oil-equivalent reserves in 2024, together with modular floating LNG units, are compressing breakeven costs to USD 35-40 per barrel and sustaining offshore momentum. Onshore projects still command most spending, but standardized FPSO hulls, subsea tiebacks, and digital-twin workflows are redirecting incremental capital to offshore developments. Maintenance budgets for methane capture, electrification, and carbon-capture retrofits rival greenfield allocations, signaling a pivot from reserve replacement toward emissions-intensity mitigation.
Key Report Takeaways
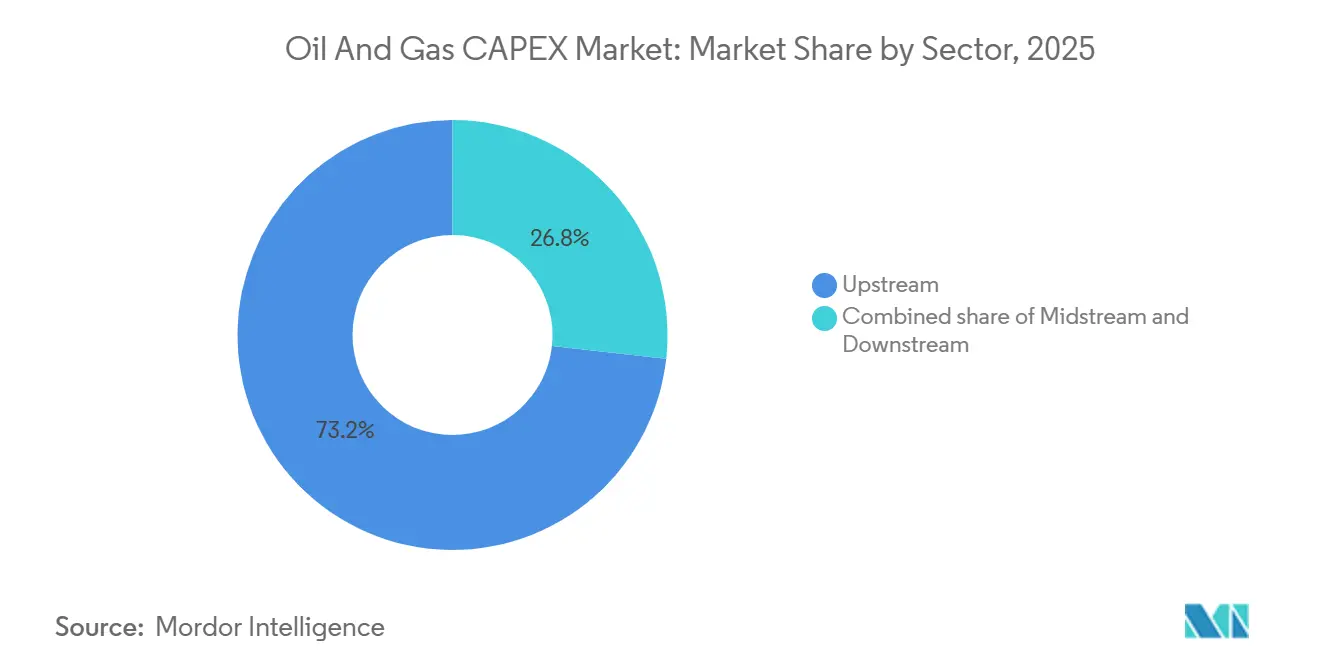
- By sector, upstream captured a 73.24% CAPEX oil & gas market share in 2025 and is forecast to expand at a 4.12% CAGR through 2031.
- By location, onshore projects held 79.43% of spending in 2025, while offshore is projected to grow at a 7.21% CAGR through 2031.
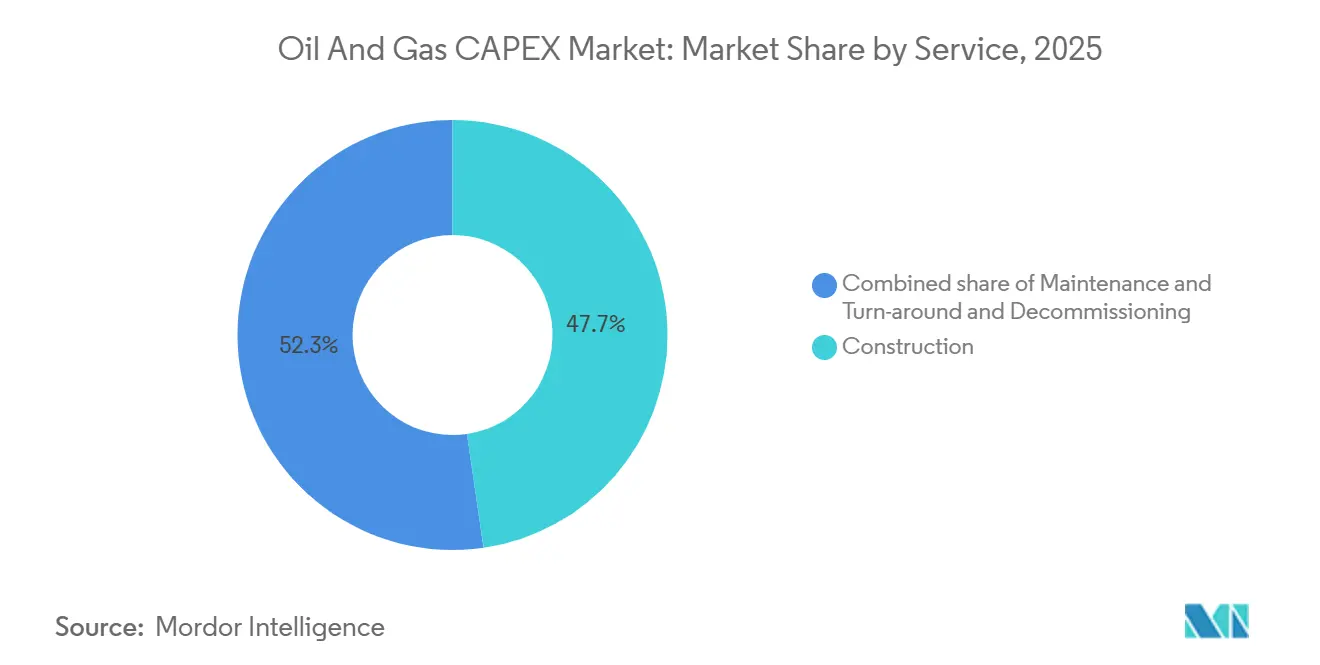
- By service, construction accounted for 47.70% of 2025 expenditure, whereas decommissioning is expected to register the fastest 6.55% CAGR to 2031.
- By geography, Asia-Pacific led with 29.36% of CAPEX in 2025; the region is set to advance at a 4.83% CAGR to 2031.
Note: Market size and forecast figures in this report are generated using Mordor Intelligence’s proprietary estimation framework, updated with the latest available data and insights as of January 2026.
Market Trends and Insights
Drivers Impact Analysis of Oil And Gas CAPEX Market*
| Driver | (~) % Impact on CAGR Forecast | Geographic Relevance | Impact Timeline |
|---|---|---|---|
| Increasing LNG-ready gas infrastructure build-out | +1.2% | Global, with concentration in US Gulf Coast, Qatar, Australia, Mozambique | Medium term (2-4 years) |
| Rising deepwater discoveries driving FIDs | +0.9% | South America (Brazil, Guyana, Suriname), West Africa (Angola, Nigeria), Asia-Pacific (Australia) | Long term (≥4 years) |
| NOC upstream spending rebound in Middle East & Asia | +1.1% | Middle East (Saudi Arabia, UAE, Qatar), Asia-Pacific (China, India, Malaysia) | Medium term (2-4 years) |
| Surge in maintenance CAPEX to decarbonise brownfields | +0.7% | North America, Europe (North Sea), Middle East mature fields | Short term (≤2 years) |
| Digital twin roll-outs cutting project overruns | +0.5% | Global, with early adoption in North America, Europe, Middle East NOCs | Short term (≤2 years) |
| Sub-1 MW modular FLNG attracting small-field sanctioning | +0.4% | Asia-Pacific (Southeast Asia, Papua New Guinea), West Africa, South America niche basins | Medium term (2-4 years) |
| Source: Mordor Intelligence | |||
Increasing LNG-Ready Gas Infrastructure Build-Out
IEA tracks 290 billion cubic meters per year of new liquefaction capacity slated for 2025-2030, underpinning a wave of midstream investment.[1] ExxonMobil recommitted USD 30 billion to restart Mozambique LNG in 2026, while Woodside approved a USD 17.5 billion Louisiana export facility expected online in 2029.[2] Asian buyers continue to sign 15-20-year offtake agreements, de-risking project finance and enabling debt-to-equity ratios above 70:30. Lake Charles LNG reached mechanical completion in late 2025, adding 16.5 million tonnes per annum (mtpa) of nameplate capacity. Similar milestones at Plaquemines LNG tighten global supply-demand balances and sustain construction backlogs through decade-end.
Rising Deep-Water Discoveries Driving FIDs
Projects in water depths beyond 1,500 meters received FIDs covering 15 billion barrels of recoverable reserves during 2024-2025. Petrobras sanctioned Búzios 11 and Atapu 3 FPSOs, each rated for 180,000 barrels per day, leveraging standardized hulls that cut fabrication time by 18 months. Shell advanced Sparta in the US Gulf of Mexico at a USD 35 per barrel breakeven, and BP approved Kaskida using subsea boosting to extend plateau production by five years. TotalEnergies’ Kaminho project in Angola integrates subsea-to-shore power, eliminating platform-generator emissions. Guyana’s Whiptail and Hammerhead FPSOs will lift national capacity beyond 1.2 million barrels per day by 2027.
NOC Upstream Spending Rebound in Middle East & Asia
Saudi Aramco’s USD 50 billion 2024 budget prioritized Jafurah unconventional gas and offshore expansions aimed at displacing liquids in domestic power generation. Middle East upstream spend reached USD 130 billion in 2025 as the United Arab Emirates and Qatar scaled offshore capacity. PetroChina exceeded USD 60 billion in 2024 capital outlay, targeting tight-gas and South China Sea exploration, while CNOOC allocated USD 13-14 billion to offshore condensate and gas projects. India’s ONGC earmarked USD 8.6 billion across 2024-2025 for Krishna-Godavari developments and mature-field enhanced recovery.
Surge in Maintenance CAPEX to Decarbonize Brownfields
IEA estimates USD 600 billion will be spent through 2030 retrofitting methane-capture, electrification, and carbon-capture solutions on existing assets. NETL studies show post-combustion amine systems can be integrated at USD 80-100 per tonne of CO₂ when pipelines are nearby. Siemens Energy reports 15-20% emissions reductions after replacing diesel generators with shore-power or hybrid systems. Subsea compression in the North Sea is extending asset life by up to 15 years, deferring abandonment costs under stricter emissions benchmarks. The capital shift reduces reserve-replacement ratios but lengthens economic lives of mature basins under evolving disclosure frameworks.
Restraints Impact Analysis of Oil And Gas CAPEX Market*
| Restraint | (~) % Impact on CAGR Forecast | Geographic Relevance | Impact Timeline |
|---|---|---|---|
| Volatility in Dated Brent discouraging long-cycle projects | -0.8% | Global, with acute impact on frontier deepwater basins in West Africa, East Mediterranean | Medium term (2-4 years) |
| ESG-linked debt covenants capping fossil CAPEX ceilings | -0.6% | OECD markets (North America, Europe), with spillover to international project finance | Long term (≥4 years) |
| Policy pivots toward renewables in OECD | -0.5% | North America (selective), Europe (EU Green Deal jurisdictions), with spillover to international project finance | Long term (≥4 years) |
| Scarcity-pricing of Tier-1 EPC labour elevating costs | -0.6% | Global, with acute pressure in North America (Gulf Coast), Middle East (Qatar, UAE), Asia-Pacific fabrication hubs | Short term (≤2 years) |
| Source: Mordor Intelligence | |||
Volatility in Dated Brent Discouraging Long-Cycle Projects
Brent traded between USD 70 and USD 95 per barrel across 2024-2025, below breakevens for many frontier deepwater prospects, leading operators to defer 8-10 billion barrels of potential resources. Drilling costs above USD 150 million per well and 6-8-year timelines deter FIDs when forward curves flatten.[3] Independent E&P companies saw borrowing costs rise by up to 200 basis points, pushing hurdle rates to 15-18% IRR.[4] Capital is shifting to short-cycle shale and brownfield upgrades, potentially constraining global supply in the early 2030s if sanctioning does not rebound.
ESG-Linked Debt Covenants Capping Fossil CAPEX Ceilings
North American and European lenders embedded emissions-intensity tests into reserve-based lending structures, limiting the share of proceeds eligible for oil and gas spending. OECD fossil-fuel exploration subsidies fell 22% between 2023 and 2025, and private project finance dropped 18%. Shell, BP, and TotalEnergies cut collective oil and gas CAPEX by 12% in 2025 versus 2023 to meet net-zero pathways, redirecting funds to offshore wind and storage. Sustainability-linked loans now ratchet interest margins upward by 25-50 basis points when methane-intensity targets are missed, further steering capital to lower-carbon LNG projects.
*Our forecasts treat driver/restraint impacts as directional, not additive. The impact forecasts reflect baseline growth, mix effects, and variable interactions.
Oil And Gas CAPEX Market Segment Analysis
By Sector:
Upstream Holds DominanceUpstream captured a 73.24% share in 2025, and the CAPEX oil & gas market size for this segment is forecast to grow at a 4.12% CAGR through 2031. Deepwater FIDs totaling 15 billion barrels in 2024 across Brazil, the US Gulf of Mexico, Angola, and Guyana capitalize on standardized FPSO and subsea systems that reduce per-barrel costs. National oil companies are sustaining high spend levels, with Saudi Aramco, PetroChina, and CNOOC together exceeding USD 130 billion in combined upstream budgets during 2024.
Digital-twin platforms deliver 30-40% reductions in cost overruns, freeing capital for parallel projects and shortening schedules by up to 18 months. Midstream investment remains steady as hydrogen-ready pipelines and carbon-capture hubs secure US Department of Energy support. Downstream complexes in Asia and the Middle East integrate refining and petrochemicals to improve margins by 15-20% in response to declining OECD gasoline demand.

By Location:
Offshore Momentum BuildsOnshore projects commanded 79.43% of 2025 expenditure, yet offshore CAPEX is set for a 7.21% CAGR to 2031 as the CAPEX oil & gas market size for deepwater projects grows faster than onshore equivalents. Shell’s Sparta and BP’s Kaskida use subsea boosting and tiebacks to existing infrastructure, cutting development costs 25-30%. New Fortress Energy’s small-scale FLNG fleet monetizes stranded reserves below 1 trillion cubic feet, supporting offshore gas monetization without new pipelines.
Onshore unconventional activity remains intense, with 12,000 wells drilled in the Permian during 2024 to sustain 6 million barrels per day of output. Canada invested USD 12 billion in oil sands expansions, while China’s Sichuan tight-gas program commands USD 15 billion annually. Decommissioning liabilities, £24 billion in the UK North Sea and 14,000 idle Gulf of Mexico structures, create a parallel offshore spend stream focused on safe retirement.
By Service:
Decommissioning Leads GrowthConstruction held 47.70% of 2025 expenditure, but decommissioning is projected to log a 6.55% CAGR, the highest among services within the CAPEX oil & gas market. Plug-and-abandonment costs ranging from USD 1.5-2.5 million per well in the Gulf of Mexico and escalating UK North Sea mandates underpin demand. Robotics-enabled abandonment rigs are reducing intervention time by 40%, attracting specialized contractors and fragmenting a space long dominated by integrated service providers.
Maintenance CAPEX for emissions retrofits totals USD 600 billion through 2030, compelling service firms to scale electrification, methane-capture, and CO₂-sequestration offerings. Simultaneously, liquefaction megaprojects in Qatar, the US Gulf Coast, and Mozambique account for individual construction packages exceeding USD 20 billion, preserving a robust backlog for civil, mechanical, and module-assembly contractors.
Geography Analysis
APAC Oil and Gas CAPEX Market
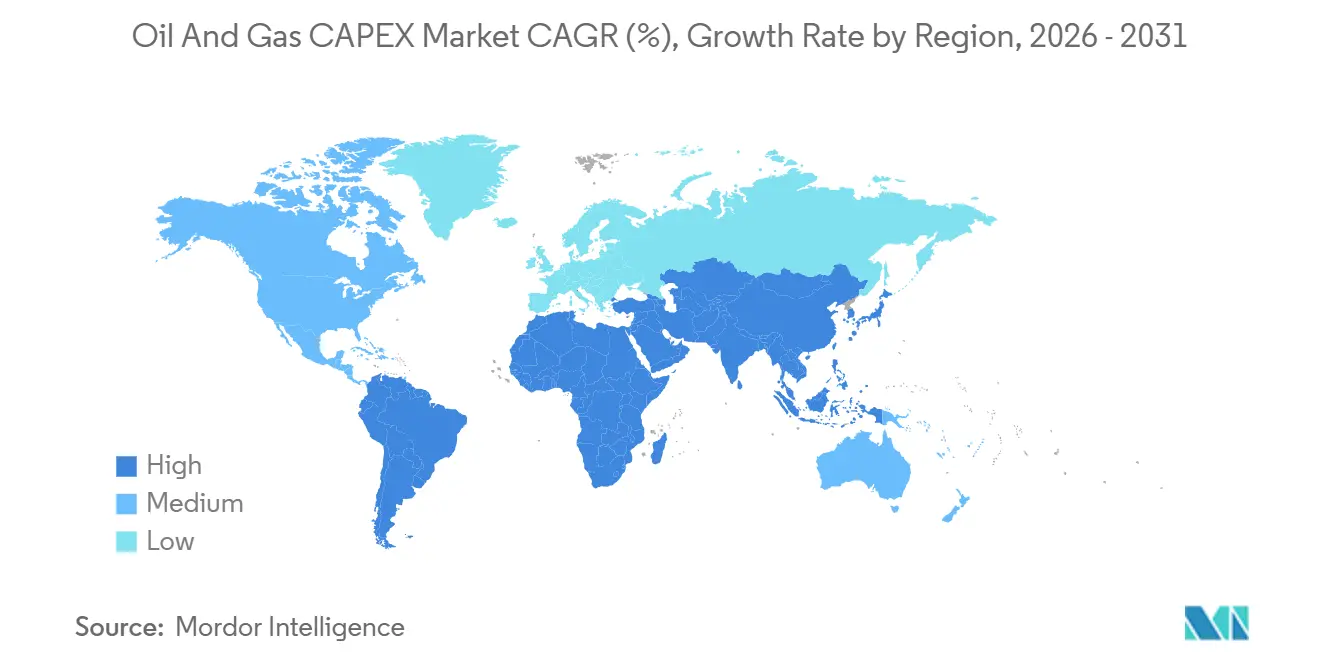
Asia-Pacific captured 29.36% of 2025 spending, and the CAPEX oil & gas market size in the region is forecast to grow at a 4.83% CAGR to 2031. PetroChina’s USD 60 billion annual budget and CNOOC’s USD 13-14 billion offshore program underpin tight-gas and condensate growth targets. India’s ONGC invests USD 8.6 billion in Krishna-Godavari assets and plans 10 mtpa of new regasification capacity by 2030. Woodside’s Scarborough and Browse LNG projects add 13 mtpa of capacity, while Papua New Guinea and Vietnam develop integrated gas-to-power schemes.
North America and Europe Oil and Gas CAPEX Market
North America and Europe together accounted for roughly 35% of 2025 CAPEX but recorded slower growth as institutional capital pivots toward renewables. The United States maintains leadership through 12,000 Permian wells and 27.5 mtpa of new LNG capacity at Woodside, Louisiana, and Lake Charles. Canada’s USD 12 billion oil-sands expansions prioritize 30-year SAGD projects. European majors trimmed oil and gas CAPEX 12% in 2025 to fund offshore wind and batteries, yet Equinor sanctioned Johan Castberg, showing selective approval for high-return Norwegian Barents projects.
MEA and South America Oil and Gas CAPEX Market
The Middle East and Africa hold near-25% of global spending. Saudi Aramco’s USD 50 billion program boosts unconventional and offshore capacity, while QatarEnergy’s North Field expansion adds 48 mtpa of LNG by 2027. Angola’s Kaminho and Brazil’s Búzios 11 demonstrate deepwater momentum, complemented by Guyana’s additional FPSOs raising capacity above 1.2 million barrels per day.
Regulatory Landscape
Regulation affecting oil and gas CAPEX increasingly combines hydrocarbons supply oversight with emissions-performance compliance. In the United States, the Environmental Protection Agency (EPA) issued final technical amendments in April 2026 affecting Clean Air Act requirements for the oil and natural gas sector, including provisions tied to temporary flaring of associated gas and monitoring approaches. This directly feeds into maintenance and retrofit spend on producing assets.
Midstream and LNG-linked CAPEX continues to be shaped by federal permitting and compliance regimes, including FERC-led authorization for interstate natural gas infrastructure alongside NEPA-linked environmental review requirements. In March 2026, FERC issued a final rule (effective May 26, 2026) updating the Reliability Standard CIP-002-7, a compliance change that affects covered entities and reinforces cybersecurity-related investment needs for critical energy infrastructure. In Canada, the Government of Canada and the Government of Alberta signed an Implementation Agreement in May 2026 to advance priority infrastructure projects and the Pathways carbon capture initiative, which provides an additional policy anchor for CCUS-linked oil and gas value chain investment.
Competitive Landscape
Integrated majors and large NOCs account for about 40% of global upstream CAPEX, evidencing moderate concentration in core segments. Saudi Aramco, ExxonMobil, Shell, BP, TotalEnergies, and Chevron leverage balance-sheet strength and engineering scale to secure fabrication slots and negotiate favorable equipment terms. Middle Eastern and Asian NOCs expand upstream budgets by double digits to meet domestic energy-security mandates, offsetting Western capital retreat. Service giants SLB, Halliburton, and Baker Hughes pivot toward digital and emissions-reduction solutions, deploying digital-twin platforms that cut overruns up to 40%.
OECD majors trimmed oil and gas spending by 12% in 2025, reallocating to renewables, while Aramco, PetroChina, and CNOOC raised upstream budgets by 18%, endorsing long-cycle assets with 20-year paybacks. Technology adoption, digital twins, subsea boosting, and modular FLNG reduce per-barrel costs by 15-25%, becoming a key differentiator. Decommissioning invites new entrants with robotics and autonomous inspection, fragmenting a niche historically dominated by integrated service providers.
Oil And Gas CAPEX Industry Leaders
-
Saudi Aramco
-
PetroChina (CNPC)
-
Exxon Mobil Corporation
-
Shell plc
-
Chevron Corporation
- *Disclaimer: Major Players sorted in no particular order
Oil And Gas CAPEX Market Companies Covered in this Report
- Saudi Aramco
- Exxon Mobil Corporation
- Shell plc
- BP plc
- TotalEnergies SE
- Chevron Corporation
- PetroChina (CNPC)
- CNOOC Ltd
- Equinor ASA
- Petrobras
- ConocoPhillips
- ENI SpA
- Suncor Energy
- Occidental Petroleum
- Woodside Energy
- Lukoil PJSC
- ONGC
- Cairn Oil & Gas (Vedanta)
- QatarEnergy
- SLB (Schlumberger)
- Halliburton
Market Opportunities and Future Outlook
LNG capacity additions and brownfield optimization remain the most visible whitespace for incremental CAPEX, with project structuring shifting toward modularization and bankable EPC scopes. In May 2026, Cheniere Energy Partners subsidiaries entered into an EPC contract with Bechtel for Phase 1 of the Sabine Pass Expansion Project (one train plus supporting infrastructure) for more than 6 mtpa, and Caturus announced a positive final investment decision for the 9.5 mtpa Commonwealth LNG export facility in Cameron Parish, Louisiana, backed by USD 9.75 billion in project financing. Together, these moves support construction packages for midstream and liquefaction, site infrastructure, and long-lead equipment orders that draw on upstream gas development and related pipeline and compression needs.
Operational-efficiency and emissions-mitigation spending is also expanding the addressable CAPEX envelope beyond greenfield developments, particularly through digital twins, production optimization enabled by data analytics, and methane-management upgrades on existing assets. The IEA estimated global energy investment at USD 3.4 trillion in 2026, including about USD 1.2 trillion allocated to oil, natural gas, and coal, which underpins continued capital availability across hydrocarbons supply chains. With upstream already the largest spend category in the report scope (73.24% share in 2025) and offshore growing faster than onshore within the study period, vendors and operators that combine subsea tiebacks, standardized floating production concepts, and electrification or carbon-capture retrofits can participate in both newbuild and sustainment CAPEX streams across regions led by Asia-Pacific and the Middle East.
Recent Industry Developments in Oil And Gas CAPEX Market
- July 2026: Saudi Aramco awarded five-year framework contracts for project management consulting and engineering services to 11 global firms, including Worley, Fluor, Wood, and McDermott. The framework approach keeps engineering and project-management resources available across upstream, downstream, and petrochemicals work scopes for a large, multi-project capital program.
- May 2026: PETRONAS signed an agreement to acquire the equity stake held by Saudi Aramco in Pengerang Refining Company and Pengerang Petrochemical Company (PRefChem). Full ownership consolidates control over investment planning and turnaround cycles at the Pengerang Integrated Complex, shaping downstream and petrochemicals CAPEX prioritization in Southeast Asia.
- November 2024: EQT Corp. announced a USD 1.8 billion acquisition of Olympus Energy Holdings, adding 500 MMscf/D of production capacity and 90,000 net acres in Pennsylvania's Marcellus and Utica shale plays. The deal increases scale in a core US gas basin, supporting follow-on drilling, gathering, and processing investment aligned with LNG-linked demand pull.
Oil And Gas CAPEX Market Report Scope and Research Methodology
Market Definition and Coverage
For this report, the market is defined as global capital spending by oil and gas operators and investors on assets and projects needed to find, produce, move, process, store, and refine hydrocarbons, measured in value terms in USD for a given year.
Scope exclusions: operating expenses, routine labor costs not capitalized, and purely financial transactions like mergers and acquisitions are excluded from the CAPEX total.
Segments Covered in This Report
- By Sector
- Upstream
- Midstream
- Downstream
- By Location
- Onshore
- Offshore
- By Asset Type
- Construction
- Maintenance and Turn-around
- Decommissioning
- By Geography
- North America
- United States
- Canada
- Mexico
- Europe
- Norway
- United Kingdom
- Russia
- Netherlands
- Germany
- Rest of Europe
- Asia Pacific
- China
- India
- Japan
- South Korea
- ASEAN Countries
- Australia
- Rest of Asia Pacific
- South America
- Brazil
- Argentina
- Colombia
- Rest of South America
- Middle East and Africa
- Saudi Arabia
- United Arab Emirates
- Qatar
- Nigeria
- South Africa
- Rest of Middle East and Africa
- North America
Data Sources, Market Sizing, and Validation
Desk Research
Desk research was used to set the market boundaries, align definitions of capital spending, and build the first pass of regional and activity splits that later get tested in interviews. We relied on public sources such as the International Energy Agency, OPEC publications, the US Energy Information Administration, and energy investment summaries from the World Bank and the International Monetary Fund for macro signals.
To connect spending to real activity, we also checked upstream and infrastructure indicators from sources such as national energy ministries, offshore regulators, and customs or trade statistics for key equipment categories, and we reviewed peer-reviewed journals that track cost inflation in drilling and project execution. Annual reports, 10-K style filings, investor presentations, and reputable industry press were used to reconcile announced project pipelines with likely timing. Where it helped, paid subscriptions covering company financials and intelligence, energy news, and global contracts and tenders were used to cross-check budgets and award timing. These are illustrative examples only, and many other public and paid sources were also referenced for data collection, validation, and clarification.
Primary Interviews and Surveys
Primary work was used to stress-test how much of announced spending is actually executed, and to understand how cost inflation and schedule slippage change the yearly spend profile. We spoke with a mix of operator-side planners, EPC and service-side managers, and finance and procurement leaders across major producing and consuming regions, so the assumptions could be compared against how budgets are set and tracked in practice.
Distribution of primary research fieldwork respondents
| Company type | Respondent position | Region |
|---|---|---|
| Top tier: 33% | CXOs: 15% | APAC: 45% |
| Mid tier: 51% | Functional/Unit leaders: 27% | EMEA: 33% |
| Smaller Players: 16% | Managers: 58% | Americas: 22% |
Market-Sizing & Forecasting
Sizing starts with a top-down rebuild of yearly oil and gas investment from known demand pools, where global and regional spending is reconstructed from upstream development plans, midstream and LNG buildouts, and downstream project and maintenance cycles. The model then gets checked using selective bottom-up approximations, such as rolling up sampled operator budgets, applying average spend per rig and well activity, and using award-based channel checks for large EPC packages.
Key inputs used in the model include oil and gas price expectations, upstream activity levels (rig count, wells drilled and completed), offshore project sanctioning and decommissioning schedules, refining and petrochemical capacity additions, and cost indices for steel, equipment, and services that influence executed CAPEX in a given year. Because project timing can shift, gaps in bottom-up checks are handled by using ranges from interviews for execution rates, and then applying them to the verified project pipeline rather than assuming full budget realization.
For forecasting, scenario analysis is used so the spend outlook can flex with price bands, policy-driven supply constraints, and financing sentiment. These scenarios are grounded using what operators and contractors shared on budget discipline, cycle-time constraints, and where cost inflation is likely to ease or stay sticky over the forecast window.
Data Validation & Update Cycle
Validation is done through a few checks that can be repeated each cycle. Model outputs are compared with independent signals such as published upstream investment totals, major project sanction lists, and regional spending splits discussed in public filings, and then the mismatches are investigated before sign-off.
When large variances show up, we re-check assumptions behind execution rates, currency timing, and cost escalation, and then reconnect with selected interviewees if the change is material. The report is refreshed annually, and interim updates are made when major events shift capital plans in a visible way, such as sharp price moves or a wave of project deferrals. Before delivery, a final review pass is completed so the numbers reflect the latest available information.
Mordor Intelligence's Global Oil and Gas Capex Market Size Versus Other Published Estimates
Published numbers for oil and gas CAPEX do not always line up because CAPEX gets used differently across sources, and the timing of spending is treated differently. Some estimates focus on operator budgets, while others lean on project awards or macro investment totals, which can pull the annual value up or down.
Mergers and acquisitions spending sits outside Mordor Intelligence's scope for this market, which is one common reason some published figures look higher in years when corporate deal activity is strong. Other gaps come from how quickly cost inflation is updated in the model, whether decommissioning and turnarounds are counted as capital items, and if the estimate assumes full budget execution or applies an execution factor based on project delivery experience.
Benchmark comparison
| Source | Market Size | Gaps in Research Methodology |
|---|---|---|
| Mordor Intelligence | USD 680.85 B (2026) | |
| Trade Journal B | USD 636.00 B (2026) | This figure is presented as a macro outlook number and may reflect a narrower executed-spend view for the year, with less explicit reconciliation to project pipelines, decommissioning, and downstream capital cycles. |
| Industry Publisher A | USD 652.04 B (2025) | The year and forecast window differ, and the published total can shift depending on whether maintenance-related capital, offshore retirement spending, and cost escalation are treated consistently across regions. |
Taken together, the spread in values is mostly explained by scope edges and timing, rather than by disagreement that spending exists. By tying the estimate to visible activity signals and then stress-testing execution and cost assumptions with interview feedback, the final number stays traceable to inputs that can be reviewed and updated each cycle.
Key Questions Answered in the Report
How large is the CAPEX oil & gas market in 2026?
The CAPEX oil & gas market size is USD 680.85 billion in 2026 and is set to reach USD 830.62 billion by 2031 at a 4.06% CAGR.
Which segment holds the highest spend share?
Upstream operations account for 73.24% of 2025 spending and are projected to grow at 4.12% through 2031.
Where is CAPEX growing fastest geographically?
Asia-Pacific leads growth with a 4.83% CAGR to 2031, driven by elevated NOC budgets and LNG infrastructure build-outs.
Why is decommissioning attracting attention?
Regulatory mandates in the Gulf of Mexico and UK North Sea, plus 14,000 idle structures, are pushing decommissioning to a 6.55% CAGR by 2031.
How are digital twins impacting project economics?
Operators report 30-40% fewer cost overruns and the ability to redeploy freed capital, shortening schedules by up to 18 months.