
Office And Contact Center Headset Market Size and Share
Market Overview
| Study Period | 2020 - 2031 |
|---|---|
| Market Size (2026) | USD 3.03 Billion |
| Market Size (2031) | USD 4.72 Billion |
| Growth Rate (2026 - 2031) | 9.27 % |
| Fastest Growing Market | Asia-Pacific |
| Largest Market | North America |
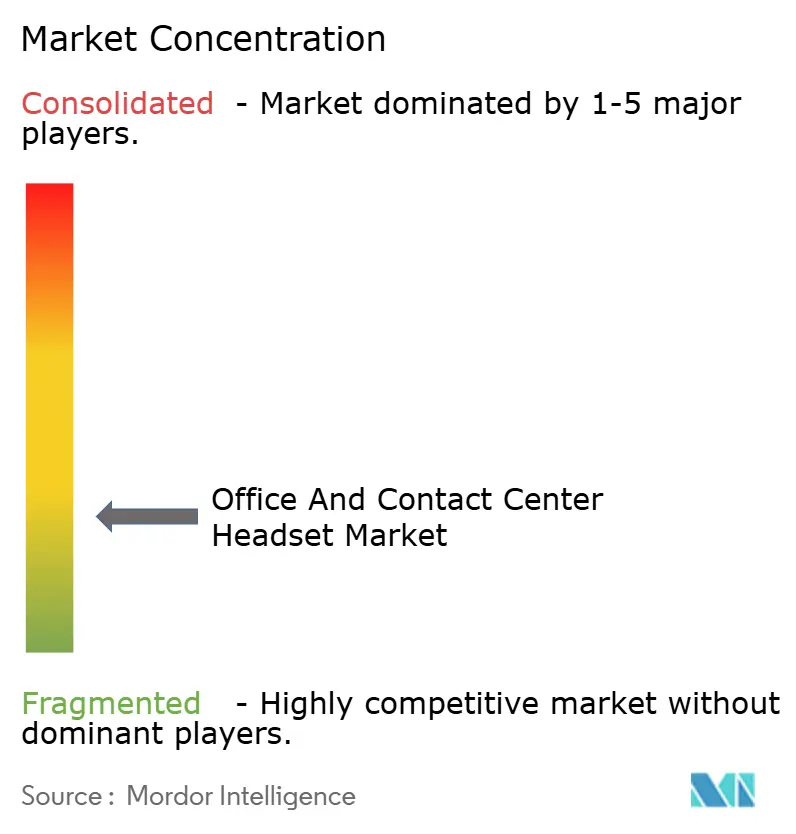
| Market Concentration | Low |
Major Players *Disclaimer: Major Players sorted in no particular order Image © Mordor Intelligence. Reuse requires attribution under CC BY 4.0. | |
Office And Contact Center Headset Market Analysis by Mordor Intelligence
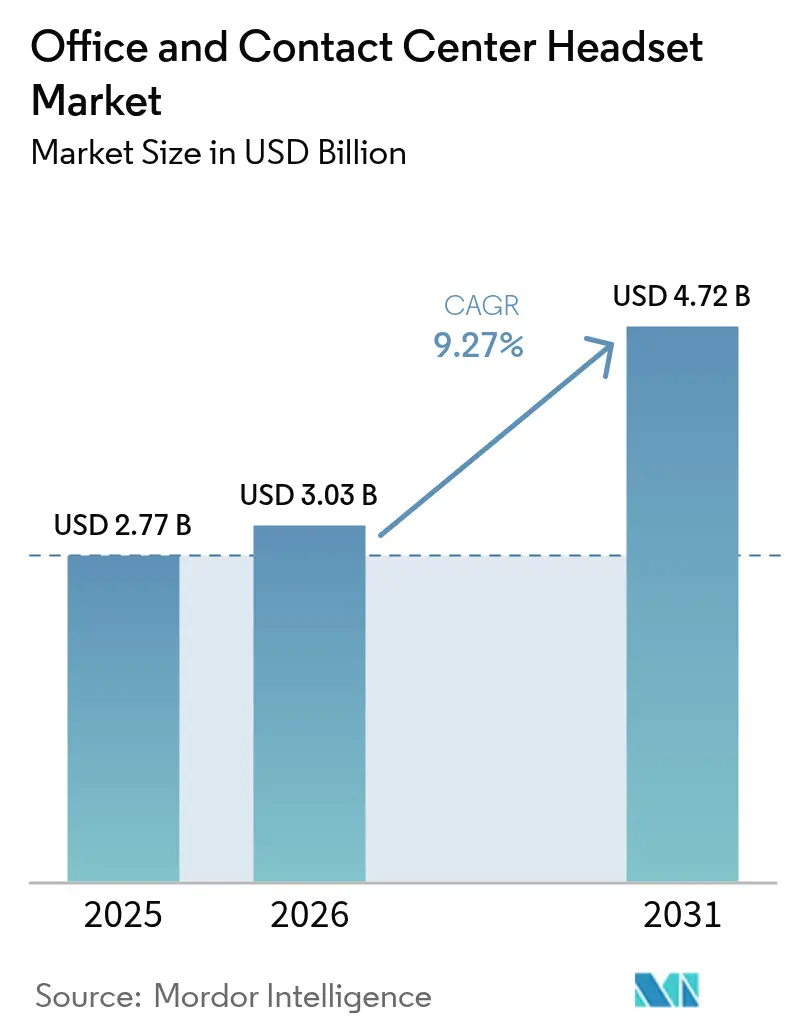
The office and contact center headset market size is expected to grow from USD 2.77 billion in 2025 to USD 3.03 billion in 2026 and is forecast to reach USD 4.72 billion by 2031 at 9.27% CAGR over 2026-2031. This momentum stems from the normalization of hybrid work, cloud-native contact center rollouts, and artificial intelligence-powered voice processing, which repositions headsets as strategic endpoints rather than low-cost consumables. Enterprises now embed telemetry from headsets into workforce analytics, lifting average selling prices while lengthening replacement cycles. Wireless connectivity is expanding as Bluetooth Low Energy lengthens battery life beyond 30 hours, and premium tiers gain ground because adaptive noise cancellation demonstrably trims call handling time. Competitive intensity is rising as certified low-cost Chinese OEMs undercut incumbents, while the migration to softphones trims multi-device attach rates and fuels differentiation through AI features. North America remains the revenue leader, but the Asia-Pacific region outpaces all others due to its dense business process outsourcing (BPO) labor pool and rapid cloud migration.
Key Report Takeaways
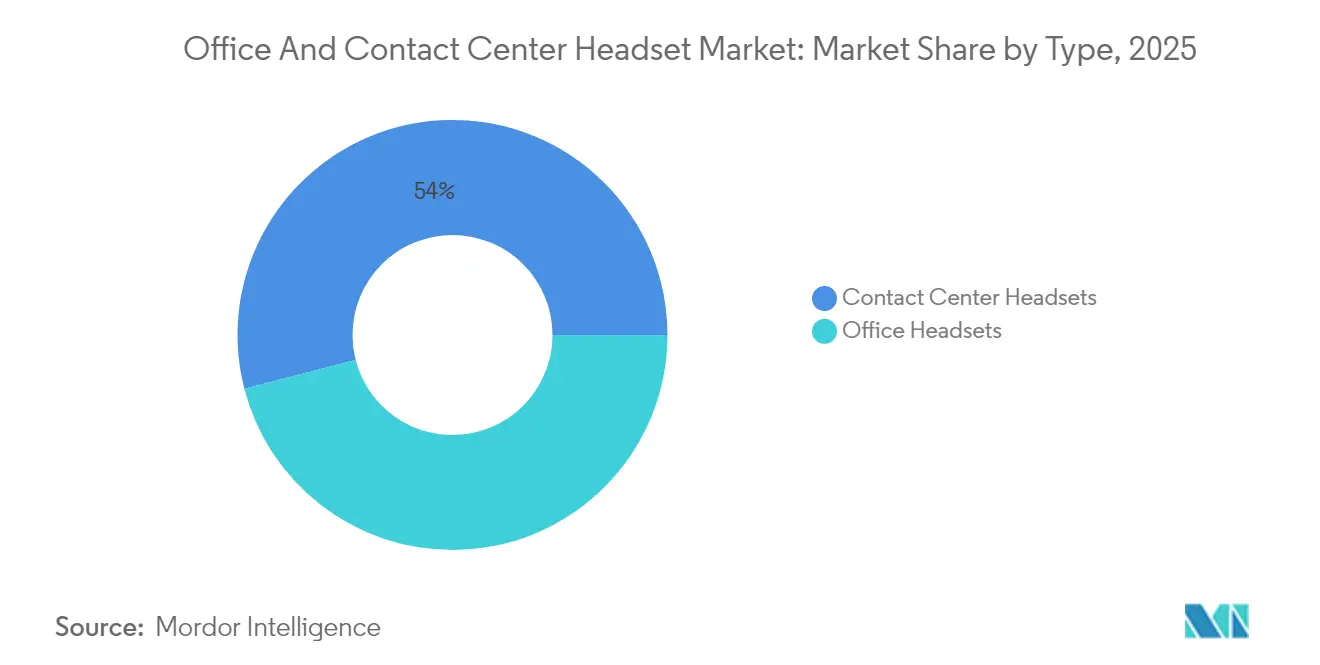
- By type, contact center headsets contributed 54.02% share of the office and contact center headset market size in 2025; office headsets are advancing at a 10.55% CAGR to 2031.
- By connectivity, wireless models controlled 63.55% share of the office and contact center headset market size in 2025 and are forecast to grow at a 10.96% CAGR to 2031.
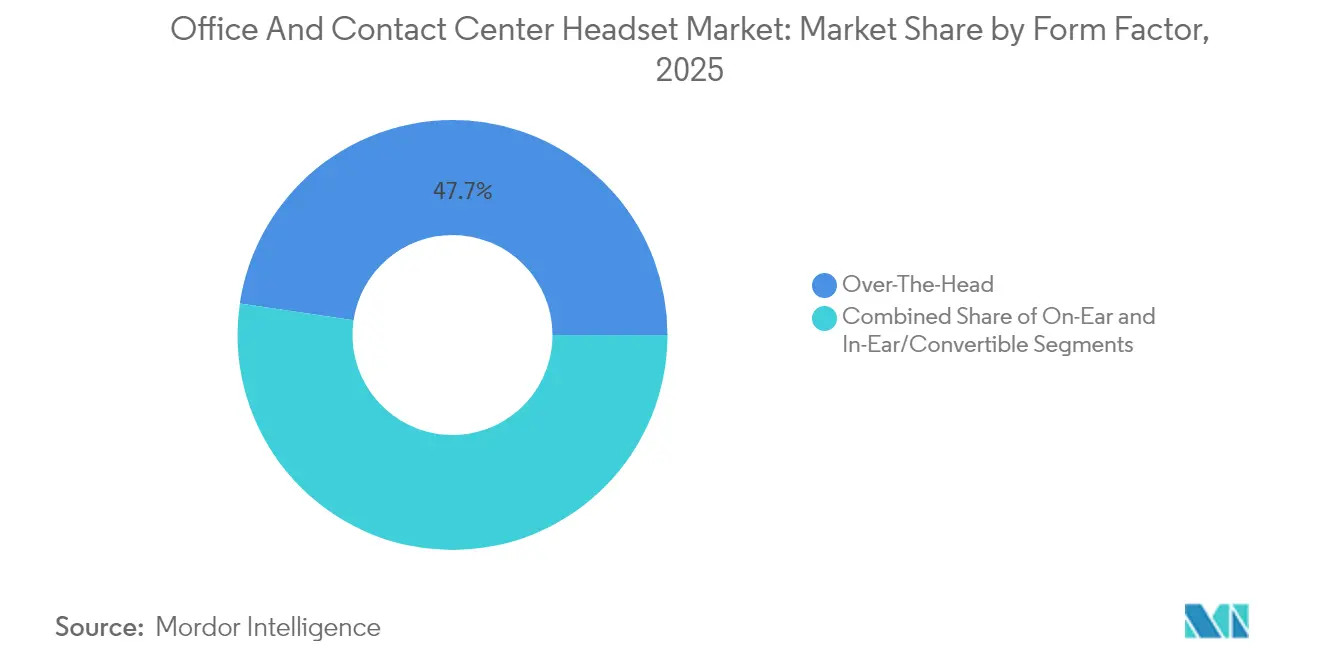
- By form factor, over-the-head designs held 47.66% share of the office and contact center headset market size in 2025, while in-ear and convertible options are expanding at 9.89% through 2031.
- By end-user sector, IT and telecom commanded 28.94% share of the office and contact center headset market size in 2025; healthcare is the fastest mover, growing at 11.08% CAGR through 2031.
- By price band, the USD 101-250 tier captured 41.35% share of the office and contact center headset market size in 2025; the above-USD 250 premium bracket is rising at 10.63% CAGR to 2031.
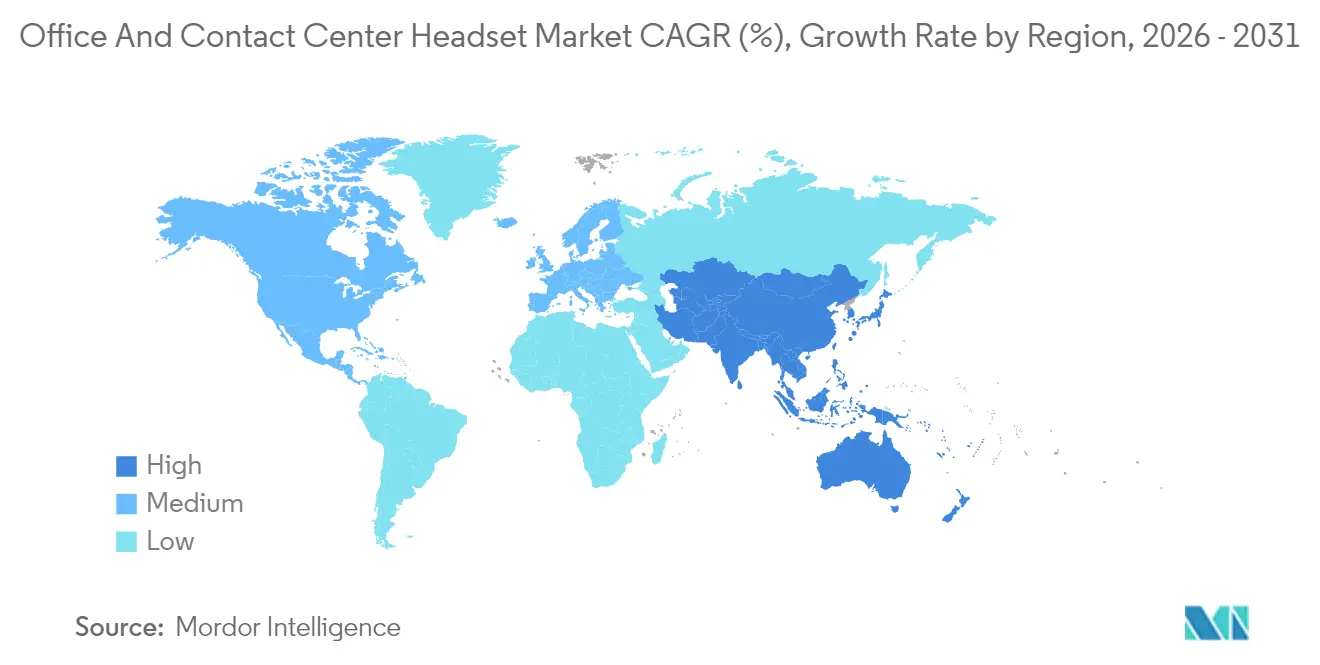
- By region, North America represented 34.18% share of the office and contact center headset market size in 2025, yet Asia-Pacific is set to grow at 10.35% CAGR on the back of its 5.44 million-agent BPO workforce.
Note: Market size and forecast figures in this report are generated using Mordor Intelligence’s proprietary estimation framework, updated with the latest available data and insights as of 2026.
Market Trends and Insights
Drivers Impact Analysis of Office And Contact Center Headset Market*
| Driver | (~) % Impact on CAGR Forecast | Geographic Relevance | Impact Timeline |
|---|---|---|---|
| Persistent Growth of Remote and Hybrid Work Culture | +3.2% | Global, strongest in North America and Western Europe | Medium term (2-4 years) |
| Increasing Cloud-Based Contact Center Adoption | +2.8% | Global, Asia-Pacific Core with spill-over to Middle East and Africa | Long term (≥ 4 years) |
| Advancements in Noise-Cancellation and Voice AI Algorithms | +2.4% | Global, early uptake in North America and Asia-Pacific | Medium term (2-4 years) |
| Expanding Adoption of Unified Communications Platforms in SMEs | +2.1% | North America, Europe, urban Asia-Pacific | Medium term (2-4 years) |
| Integration of Headset Telemetry Data into Workforce Analytics | +1.6% | North America and Europe, emerging in Asia-Pacific | Long term (≥ 4 years) |
| Growing Sales Via Device-as-a-Service Procurement Models | +1.4% | North America and Europe, expanding into Asia-Pacific and Latin America | Long term (≥ 4 years) |
| Source: Mordor Intelligence | |||
Persistent Growth of Remote and Hybrid Work Culture
Hybrid arrangements stabilized at 53% of the global labor force, and 16% work fully remote in 2024.[1] Employers now mandate certified headsets to ensure uniform call quality, especially in professional services and software development. Logitech reported that 68% of its enterprise customers require approved peripherals for all client-facing employees. Durability needs in home offices lengthen replacement cycles to as much as five years, yet higher build specifications raise unit pricing and, in turn, push the office and contact center headset market higher.
Increasing Cloud-Based Contact Center Adoption
Annual spending on cloud contact-center infrastructure reached USD 5.1 billion in 2024. Asia-Pacific leads migration: NASSCOM projects that 73% of India’s 4 million BPO agent seats will be cloud-based by 2026, up from 41% in 2024, NASSCOM.IN. Cloud architectures require IP-native headsets that integrate with Amazon Connect, Genesys Cloud, and Five9, creating pull-through demand for certified wireless devices across the office and contact center headset market.
Advancements in Noise-Cancellation and Voice AI Algorithms
University of Washington researchers demonstrated a semantic hearing system that improved signal-to-noise ratio by up to 4.62 dB in 2024. Chipmaker Airoha’s AB1595 Bluetooth system-on-chip features a neural processing unit for local echo suppression and voice activity detection, achieving a latency of under 20 milliseconds. These gains elevate premium headsets from accessories to cost-saving assets, as every 10-second reduction in average handle time saves approximately USD 1.2 million per 1,000 agents, accelerating the adoption of premium headsets across the office and contact center headset market.
Expanding Adoption of Unified Communications Platforms in SMEs
Microsoft Teams surpassed 320 million monthly active users in 2024, with small enterprises accounting for 62% of the incremental seats. Native device certification lowers support tickets and shortens onboarding, motivating SMEs to replace consumer earbuds with professional headsets. As unified-communications penetration rises, headset demand extends beyond Fortune 500 environments, making SMEs a core incremental buyer segment.
Restraints Impact Analysis of Office And Contact Center Headset Market*
| Restraint | (~) % Impact on CAGR Forecast | Geographic Relevance | Impact Timeline |
|---|---|---|---|
| Proliferation of Consumer-Grade Earbuds Cannibalizing Professional Sales | -1.8% | Global, sharpest in North America and Western Europe | Short term (≤ 2 years) |
| Transition From Desk Phones to Softphones Reducing Multi-Device Attach Rates | -1.3% | North America and Europe, gradual in Asia-Pacific | Medium term (2-4 years) |
| Intensifying Price Pressure From Low-Cost Asian OEMs | -1.1% | Global, concentrated in Asia-Pacific and Latin America | Medium term (2-4 years) |
| Increasing Cybersecurity Certification Costs for Enterprise Headsets | -0.7% | Regulated industries in North America and Europe | Long term (≥ 4 years) |
| Source: Mordor Intelligence | |||
Proliferation of Consumer-Grade Earbuds Cannibalizing Professional Sales
Volume shipments of true-wireless earbuds create an employee perception that personal devices are sufficient for work calls. Enterprises counter by enforcing peripheral policies, yet sub-USD 100 price bands still lose share to earbuds that now match battery life and basic ANC. Vendors respond with enterprise-specific differentiators, such as busy lights and centralized firmware updates, to defend the office and contact center headset market.
Transition From Desk Phones to Softphones Reducing Multi-Device Attach Rates
Widespread softphone migration eliminates the need for headsets that pair with both desk phones and computers, reducing attachment rates for higher-priced models. Vendors are increasingly embedding AI transcription, telemetry, and extended warranties to maintain average selling prices and preserve their share in the office and contact center headset market.
*Our forecasts treat driver/restraint impacts as directional, not additive. The impact forecasts reflect baseline growth, mix effects, and variable interactions.
Office And Contact Center Headset Market Segment Analysis
By Type – Office Headsets Gain Momentum in a Hybrid World
Office headsets are forecast to grow at 10.55% to 2031, narrowing the gap with contact center devices, which still account for over one-half of the revenue. Remote employees bring their own peripherals between hot desks and home offices, boosting demand for foldable, multi-point models such as the Logitech Zone Wireless. The office and contact center headset market size for the office segment is projected to grow the fastest, as telemetry dashboards help HR identify ergonomic or usage issues.
Contact center growth remains anchored in Asia-Pacific cloud migrations. Poly’s Voyager 4320 UC, at USD 249, addresses home-based agents who need 50-hour battery life and adaptive ANC. Premium, rugged units such as the EPOS IMPACT 1060 ANC, at EUR 549 (USD 586), satisfy 24-hour operations, extending life cycles to five years and stabilizing the office and contact center headset market share within large BPO facilities.

By Connectivity – Wireless Dominance Accelerates
Wireless devices controlled a 63.55% share in 2025 and are expected to expand at a 10.96% CAGR. Bluetooth 5.2 and LE Audio deliver over 30 hours of talk time, while DECT remains indispensable on sprawling contact center floors. The office and contact center headset market size for wireless offerings is expected to exceed USD 3.12 billion by 2031, as Teams and Zoom introduce native Bluetooth pairing, eliminating the need for proprietary dongles.
Wired products persist where Bluetooth is banned, notably on trading floors and in some government call centers. Audio-Technica’s BPHS1, priced at USD 199, offers XLR connectivity for analog backup lines, underscoring a resilient niche even as wireless technology scales globally.
By Form Factor – In-Ear Convertibles Lead Growth
In-ear and convertible designs are expected to grow at a rate of 9.89% due to commuting professionals who prefer pocket-sized gear. The Jabra Evolve2 Buds, priced at USD 279, combine IP57 sealing with eight-microphone ANC, underpinning expansion beyond offices into outdoor work settings. The office and contact center headset market share for over-the-head models still stands at 47.66% because contact centers value comfort and battery modularity.
On-ear hybrids appeal to executives who want to make spatial-audio video calls during travel. Bose QuietComfort Ultra, at USD 429, offers 24-hour autonomy and spatial awareness, ensuring senior staff remain engaged in negotiations without visual fatigue.
By End-User Industry – Healthcare Surges as Telemedicine Stabilizes
Telehealth has matured into mainstream care, driving demand for healthcare headsets at an 11.08% CAGR through 2031. Clinicians require HIPAA-compliant audio and busylights that signal consultations in shared living spaces. Noise-isolating microphones also improve behavioral-health outcomes because therapists rely on vocal cues.
IT and telecom retained 28.94% revenue in 2025 but is plateauing in North America and Europe. Asian shared-service centers help offset some saturation, and banks in the BFSI sector upgrade to AI-ready headsets that detect scripting violations in real-time, reinforcing compliance within the office and contact center headset market.
By Price Range – Premium Tier Expands on Productivity ROI
The above-USD 250 bracket grows at 10.63% as enterprises quantify time savings from advanced ANC and voice AI. The Jabra Evolve2 85, priced at USD 469, recovers its premium within one year by reducing support calls, while the EPOS IMPACT 1060 ANC offers a five-year service life that lowers total cost.
The USD 101-250 segment captures the highest unit share at 41.35%, driven by volume BPO rollouts that negotiate bulk discounts while still demanding certified gear. Sub-USD 100 devices face erosion from earbuds unless vendors add enterprise-specific firmware and telemetry to justify their procurement.
Geography Analysis
APAC and Eastern Europe Office and Contact Center Headset Market
The Asia-Pacific region posts the fastest 10.35% CAGR, driven by India’s 4 million agents and the Philippines’ 1.44 million handler workforce, which processes 71% of global voice BPO interactions. NASSCOM values India’s BPO revenue at USD 49.87 billion in 2024, with cloud penetration expected to reach 73% by 2026, maintaining robust headset orders. Eastern Europe emerges as an auxiliary hub, with Poland, Romania, and Ukraine together employing over 700,000 agents and standardizing on IP headsets to service multilingual campaigns.
North America, Europe, LATAM and Africa Office and Contact Center Headset Market
North America generated 34.18% of 2025 revenue through the early adoption of unified communications and the presence of dense Fortune 500 contact centers. Growth decelerates as replacement cycles stretch to five years, but the United States' next-generation 911 funding, a USD 442 million hardware allocation over seven years, sustains procurement for secure, VoIP-ready headsets. Canadian provinces follow similar modernization paths, tightening cybersecurity standards that favor certified vendors. Europe lags because legacy PSTN links persist in Germany and France, whereas the United Kingdom and the Nordics are migrating aggressively to cloud platforms. Latin America and Africa add volume through new multilingual BPO centers in Brazil and South Africa, leveraging labor cost advantages by adopting mid-range wireless models that balance budget and certification needs. Collectively, these regions propel the ongoing diversification of the office and contact center headset market.
Regulatory Landscape
Compliance for office and contact center headsets is shaped by wireless radio equipment rules, accessibility requirements, and enterprise security expectations across major markets. In the United States, the Federal Communications Commission (FCC) moved the market toward 100% hearing aid compatibility for wireless handsets in January 2026, updating certification filing procedures and adopting an annual filing cadence (FCC Form 855). This reinforces accessibility-by-design for devices operating in voice communication environments.
In Europe, the Radio Equipment Directive (2014/53/EU) extends beyond traditional safety and RF compliance into cybersecurity-centric essential requirements. The European Commission supports implementation through harmonized standards, including the EN 18031 series referenced through an implementing decision in early 2025. For headset OEMs and enterprise buyers, these changes raise the importance of secure firmware, data protection features, and documented conformity pathways for Teams- and Zoom-certified wireless models deployed at scale.
Value Chain Analysis
The value chain starts with electronic inputs (Bluetooth/DECT SoCs, microphones, batteries, PCBs, and passive components), then moves through acoustic and industrial design, firmware and voice-processing software, regulatory testing, and high-volume manufacturing via ODM and contract manufacturing partners concentrated in Asia. End users typically purchase through broadline distribution (for example, Ingram Micro and TD Synnex in established procurement channels), UC platform storefronts and certification ecosystems (including Microsoft Teams Device Certification and Zoom programs), and direct enterprise sales tied to fleet management software.
Value creation is shifting toward platform-certified bundles and lifecycle services, where vendors differentiate through centralized device management, security and firmware governance, and analytics hooks into IT service workflows. On the supply side, component allocation pressure, including tighter availability and longer lead times for advanced SoCs, onboard memory, and passive components, has pushed some product strategies toward cloud-assisted features and closer alignment of new product introduction cycles with manufacturing partners. Manufacturing footprints continue consolidating in hubs such as Vietnam and India to diversify risk and support enterprise delivery timelines while meeting multi-market compliance needs, including FCC and CE-related requirements.
Competitive Landscape
The major vendors, including Logitech, GN Store Nord (Jabra), HP (Poly), EPOS, and Sennheiser, captured a significant share of the 2024 revenue. Logitech and Jabra leverage preferred-vendor status inside Microsoft Teams and Zoom procurement portals, reinforcing ecosystem lock-in. Each offers management dashboards that integrate with ServiceNow to flag battery cycles and firmware versions, enabling predictive maintenance and just-in-time replacements.
Chinese OEMs erode pricing power by delivering Teams-certified headsets for USD 49-79. Yealink alone shipped more than 140 million cumulative units and generated CNY 4.2 billion (USD 580 million) in 2024, supported by ISO 9001 factories and distribution through Ingram Micro and TD Synnex.[3] Western incumbents respond by consolidating their assembly in Vietnam and India, while embedding AI analytics and on-device security to justify their premium positioning.
Emerging challengers include Sony and Samsung, which repurpose consumer earbud supply chains to offer multipoint pairing and busylights around 20-30% below established brands. Certification costs between USD 50,000 and USD 150,000 per model, along with six-to-twelve-month validation cycles, restrict smaller suppliers, effectively channeling market share toward capital-rich players and helping stabilize the office and contact center headset market.
Office And Contact Center Headset Industry Leaders
-
GN Store Nord A/S
-
HP Inc. (Poly Inc.)
-
Logitech International S.A.
-
EPOS Group A/S
-
Yealink Network Technology Co., Ltd.
- *Disclaimer: Major Players sorted in no particular order
Office And Contact Center Headset Market Companies Covered in this Report
- GN Store Nord A/S
- HP Inc. (Poly Inc.)
- Logitech International S.A.
- EPOS Group A/S
- Yealink Network Technology Co., Ltd.
- Shure Incorporated
- VXI Corporation
- Bose Corporation
- Audio-Technica Corporation
- Sony Corporation
- Panasonic Holdings Corporation
- Sennheiser electronic GmbH and Co. KG
- Cisco Systems, Inc.
- Samsung Electronics Co., Ltd.
- LG Electronics Inc.
- Axtel Headsets Sp. z o.o.
- Alcatel-Lucent Enterprise International
- ClearOne Inc.
Read Analysis of Office And Contact Center Headset Companies
Market Opportunities and Future Outlook
Enterprise headset demand is increasingly tied to AI-enabled communications workflows rather than basic voice connectivity, creating space for models that improve transcription accuracy, suppress background noise, and support voice-command interactions while remaining manageable at fleet scale. Recent product moves reflect this shift: Jabra announced its Evolve3 series in January 2026, with a boomless microphone approach, centralized IT management via Jabra Plus, and repairability-oriented design choices such as replaceable batteries. EPOS introduced the IMPACT 1000 series in June 2026, positioning it around high word-accuracy for transcription and voice-assistant use cases.
Additional opportunity centers on DECT and frontline deployments where coverage, density, and reliability needs differ from office Bluetooth use, and where workflow-oriented integrations can raise attachment rates per user. Mitel expanded this direction with the H60 DECT headset announcement in July 2026, including integration with Mitel Workflow Studio for speech-to-text and text-to-speech interactions. This tightens headsets' alignment with communications applications and contact center processes. At the same time, European cybersecurity requirements under the Radio Equipment Directive push vendors to treat headset firmware and data protection as procurement gatekeepers, supporting differentiation for suppliers that combine certification, secure management, and AI-ready audio pipelines.
Recent Industry Developments in Office And Contact Center Headset Market
- June 2026: HP announced HP Poly Focus 6 Series Bluetooth headsets at InfoComm 2026, highlighting features such as Acoustic Fence 2.0 and spatial audio with planned availability beginning in July 2026. The release strengthens HPs unified collaboration portfolio and reinforces headset differentiation around managed, AI-assisted audio experiences for hybrid work and contact center users.
- November 2025: Logitech introduced the Zone Wireless 2 ES and Zone Wired 2 headsets for noisy office environments, using AI-powered noise-canceling microphones and hybrid ANC that adjusts to background conditions. The refresh targets higher-value enterprise refresh cycles where UC certification and consistent call quality drive standardization.
- October 2024: Microsoft Teams surpassed 320 million monthly active users, expanding the installed base of unified communications endpoints used across offices and distributed workforces. This scale-up increased the importance of Teams device certification and IT-manageable headset fleets as enterprises prioritize consistent audio performance and simplified support.
Office And Contact Center Headset Market Report Scope and Research Methodology
Market Definition and Coverage
We size the global office and contact center headset market as revenues generated from headsets used for enterprise communications, including wired and wireless models, across office users and agent-led contact center environments.
Scope exclusions: Consumer gaming headsets and general-purpose personal audio headphones are not counted unless they are positioned and sold for office or contact center use.
Segments Covered in This Report
- By Type
- Office Headsets
- Contact Center Headsets
- By Connectivity
- Wired
- Wireless
- By Form Factor
- Over-The-Head
- On-Ear
- In-Ear/Convertible
- By End-User Industry
- BFSI
- Government and Public Sector
- Healthcare
- IT and Telecom
- Others
- By Price Range
- Sub-USD 100
- USD 101-USD 250
- Above USD 250
- By Geography
- North America
- United States
- Canada
- Mexico
- South America
- Brazil
- Argentina
- Rest of South America
- Europe
- Germany
- United Kingdom
- France
- Italy
- Spain
- Rest of Europe
- Asia-Pacific
- China
- India
- Japan
- South Korea
- ASEAN
- Rest of Asia-Pacific
- Middle East and Africa
- Middle East
- Saudi Arabia
- United Arab Emirates
- Rest of Middle East
- Africa
- South Africa
- Nigeria
- Rest of Africa
- Middle East
- North America
Data Sources, Market Sizing, and Validation
Desk Research
Desk research built the market map and helped us pin down demand signals that can be checked across regions. We used public sources such as the International Telecommunication Union for connectivity indicators, the International Labour Organization for employment and occupational structure, and OECD datasets that cover digital adoption and productivity patterns.
To keep the revenue model grounded, we also reviewed sources such as UN Comtrade for trade flows linked to headset categories, US Census and Eurostat releases for business activity context, and peer-reviewed journals that discuss workplace acoustics and device adoption. We then matched these inputs with company filings, investor decks, product catalogs, and trusted press coverage to track launch timing and price movement, using paid subscriptions when needed for company financials, patents, and import or export shipment-level records. The sources listed here are illustrative, and additional references were used for data collection, cross-checking, and clarifying assumptions.
Primary Interviews and Surveys
Primary interviews and surveys were used to translate the desk findings into sizing inputs, particularly where public datasets do not show enterprise headset replacement cycles or channel pricing. We spoke with headset suppliers, enterprise IT and procurement stakeholders, contact center operations leaders, and distributors across APAC, EMEA, and the Americas, then compared the responses back to the model so inconsistent assumptions could be corrected.
Distribution of primary research fieldwork respondents
| Company type | Respondent position | Region |
|---|---|---|
| Top tier: 30% | CXOs: 13% | APAC: 48% |
| Mid tier: 49% | Functional/Unit leaders: 37% | EMEA: 29% |
| Smaller Players: 21% | Managers: 50% | Americas: 23% |
Market-Sizing & Forecasting
The market was first constructed using a top-down approach where enterprise headset demand is rebuilt from the installed base of office and contact center users, expected refresh cycles, and region-level adoption of wired versus wireless connectivity. Once the demand pool was formed, revenue was derived using average selling price bands aligned with typical enterprise purchasing behavior, and the results were checked for reasonableness against trade patterns and announced product portfolios.
To corroborate the totals, we also ran selective bottom-up approximations, such as rolling up a sample of supplier revenues, using channel checks for price and mix, and applying volume assumptions for key end-user industries. Key inputs included contact center seat counts and agent churn expectations, enterprise headcount trends, wireless penetration, price range mix shifts across sub-USD 100 and premium tiers, and the split of office versus contact center use. Forecasts were built using scenario analysis anchored on hiring trends, hybrid work persistence, and expected ASP progression, then adjusted after expert feedback when regional adoption timing looked faster or slower than the base case. Where a bottom-up proxy had gaps, the missing pieces were filled using conservative mix assumptions, then rechecked against the demand pool logic.
Data Validation & Update Cycle
Outputs were validated through multiple checks so the final numbers do not depend on a single dataset or one set of interviews. Model results were compared with independent signals such as trade direction, headset price band movement, and regional enterprise adoption indicators, followed by variance checks to identify outliers that needed a second look.
Before sign-off, assumptions and calculations go through step-by-step analyst review, and respondents are re-contacted when a large mismatch appears in pricing, mix, or growth expectations. Reports are refreshed annually, with interim updates when material events occur, and a final pre-delivery review is completed so clients receive the latest updated view.
Mordor Intelligence's Global Office and Contact Center Headset Market Size Measured Against Other Published Estimates
Published market sizes for office and contact center headsets often do not match because the included device set and the usage setting can shift from one study to the next. Differences also show up when one publisher sizes only call center demand, while another includes broader enterprise unified communications peripherals.
The key gap drivers usually come down to whether the estimate includes business headsets used outside formal contact centers, how wired versus wireless mix is priced over time, and whether forecasts assume a fast shift into premium tiers. Some sources also anchor the market to shipment-led categories or a narrow headset definition, which can understate office use, while others extend scope into adjacent UC hardware, which can inflate totals.
Benchmark comparison
| Source | Market Size | Gaps in Research Methodology |
|---|---|---|
| Mordor Intelligence | USD 3.03 B (2026) | |
| Global Consultancy A | USD 4.42 B (2024) | Uses a broader UC and business headsets definition that extends beyond office and contact center use, and the base year reflects a different pricing and adoption point. |
| Trade Journal B | USD 1.62 B (2025) | Focuses narrowly on call center headsets, which omits a large share of office headset demand and applies shipment-led assumptions that compress revenue totals. |
The spread across the table is mainly explained by what gets counted as a business headset versus a contact center device, and by the year used for pricing and mix. Keeping office and contact center usage explicit, and tying ASP bands to enterprise procurement behavior, helps make the total traceable, which is the modeling choice applied by Mordor Intelligence.
Key Questions Answered in the Report
What is the current value of the office and contact center headset market?
The market stands at USD 3.03 billion in 2026 and is set to climb to USD 4.72 billion by 2031.
Which region is expected to grow the fastest through 2031?
Asia-Pacific will grow at a 10.35% CAGR, led by India and the Philippines with their large BPO workforces.
Why are premium headsets gaining share despite higher prices?
Enterprises quantify productivity gains from adaptive noise cancellation and voice AI, making payback periods shorter than one year.
How significant are wireless models in overall demand?
Wireless devices already hold 63.55% revenue share and will expand rapidly as Bluetooth LE and DECT technologies mature.
Which end-user sector shows the highest growth potential?
Healthcare leads with a 11.08% CAGR because telemedicine has become a sustained care channel.
What factors most threaten market growth?
Cannibalization by consumer earbuds and shrinking multi-device attach rates as desk phones disappear exert downward pressure on overall demand.