
Oil And Gas NDT Market Size and Share
Market Overview
| Study Period | 2020 - 2031 |
|---|---|
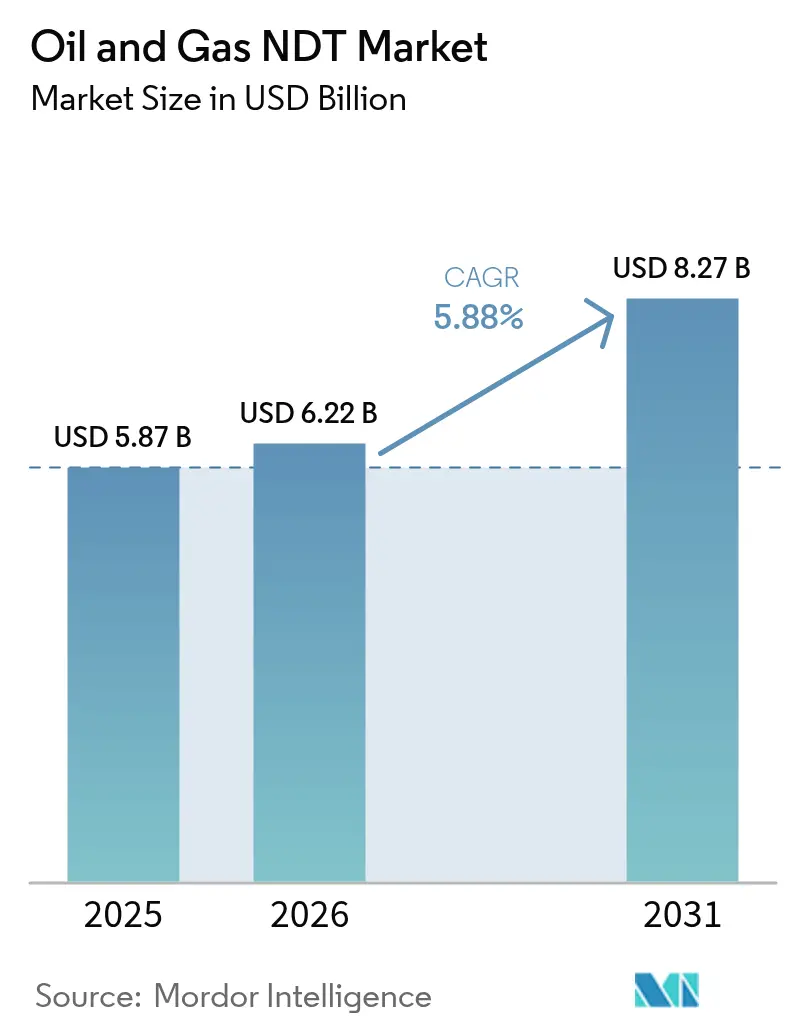
| Market Size (2026) | USD 6.22 Billion |
| Market Size (2031) | USD 8.27 Billion |
| Growth Rate (2026 - 2031) | 5.88% CAGR |
| Fastest Growing Market | Middle East |
| Largest Market | North America |
| Market Concentration | Medium |
Major Players *Disclaimer: Major Players sorted in no particular order Image © Mordor Intelligence. Reuse requires attribution under CC BY 4.0. | |
Oil And Gas NDT Market Analysis by Mordor Intelligence
The Oil and Gas NDT market size is expected to grow from USD 5.87 billion in 2025 to USD 6.22 billion in 2026 and is forecast to reach USD 8.27 billion by 2031 at 5.88% CAGR over 2026-2031. This expansion mirrors the sector’s role in safeguarding upstream, midstream, and downstream assets while regulators tighten integrity rules and operators modernize aging pipelines. Digital inspection platforms, increased subsea activity, and stricter environmental mandates are driving capital toward advanced ultrasonic, radiographic, and computed tomography systems. Consolidation among major service providers is reshaping competitive boundaries, and data-centric value propositions now decide contract awards. In parallel, predictive maintenance programs built on AI analytics are unlocking new recurring revenue opportunities, particularly in cases where inspection intervals are shortened.
Key Report Takeaways
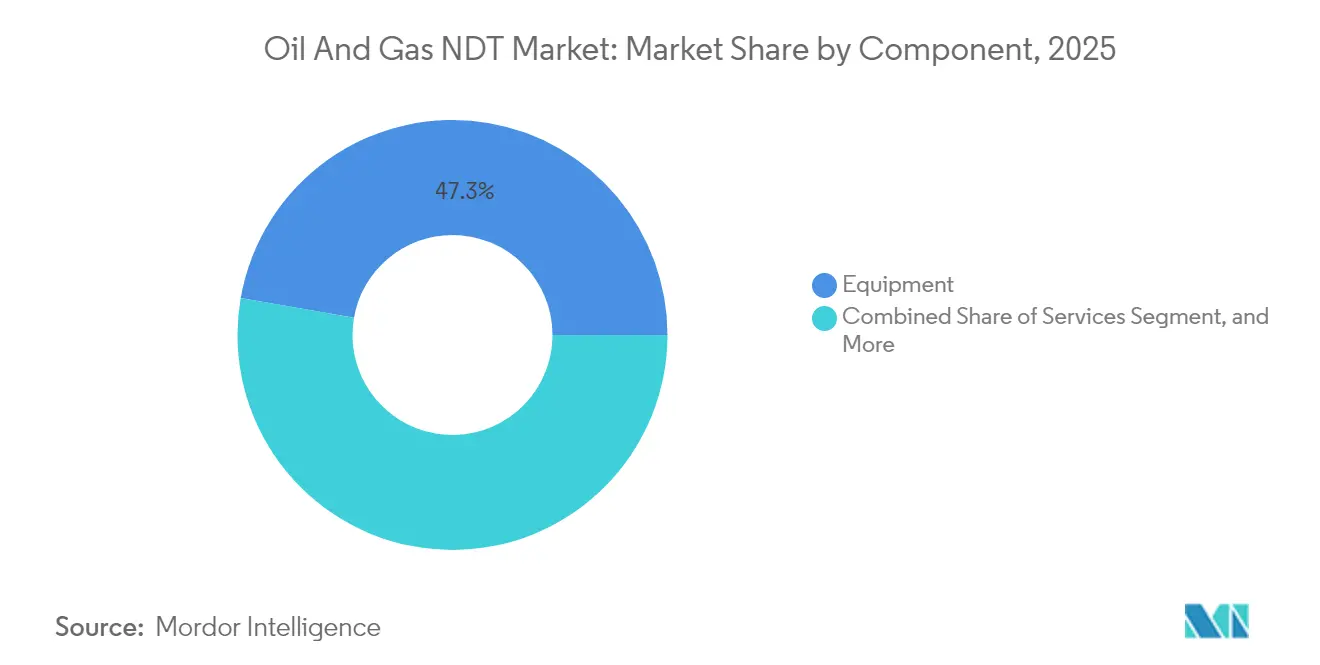
- By component, equipment held 47.25% of the Oil and Gas NDT market share in 2025, whereas services are projected to register a 6.62% CAGR through 2031.
- By testing method, ultrasonic testing is expected to lead the Oil and Gas NDT market with a 33.20% revenue share in 2025, while computed tomography is forecasted to advance at a 7.52% CAGR through 2031.
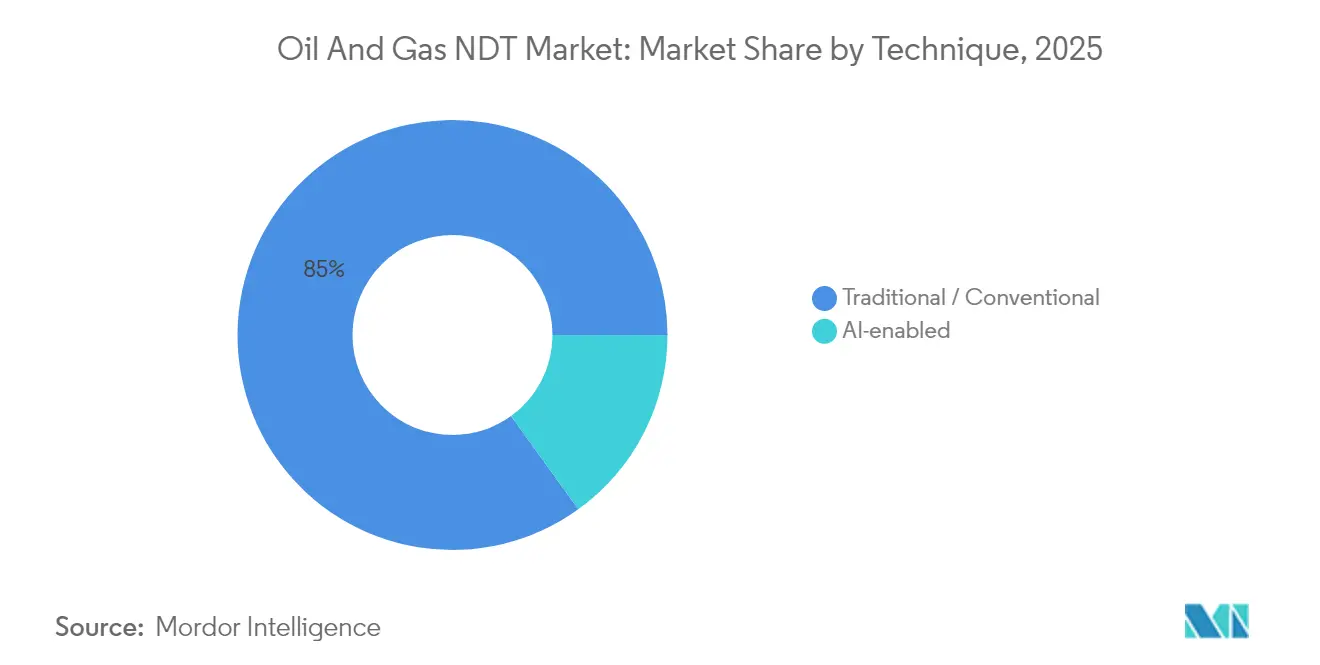
- By technique, traditional modalities accounted for an 84.95% share of the Oil and Gas NDT market size in 2025; AI-enabled approaches are expected to expand at a 6.32% CAGR to 2031.
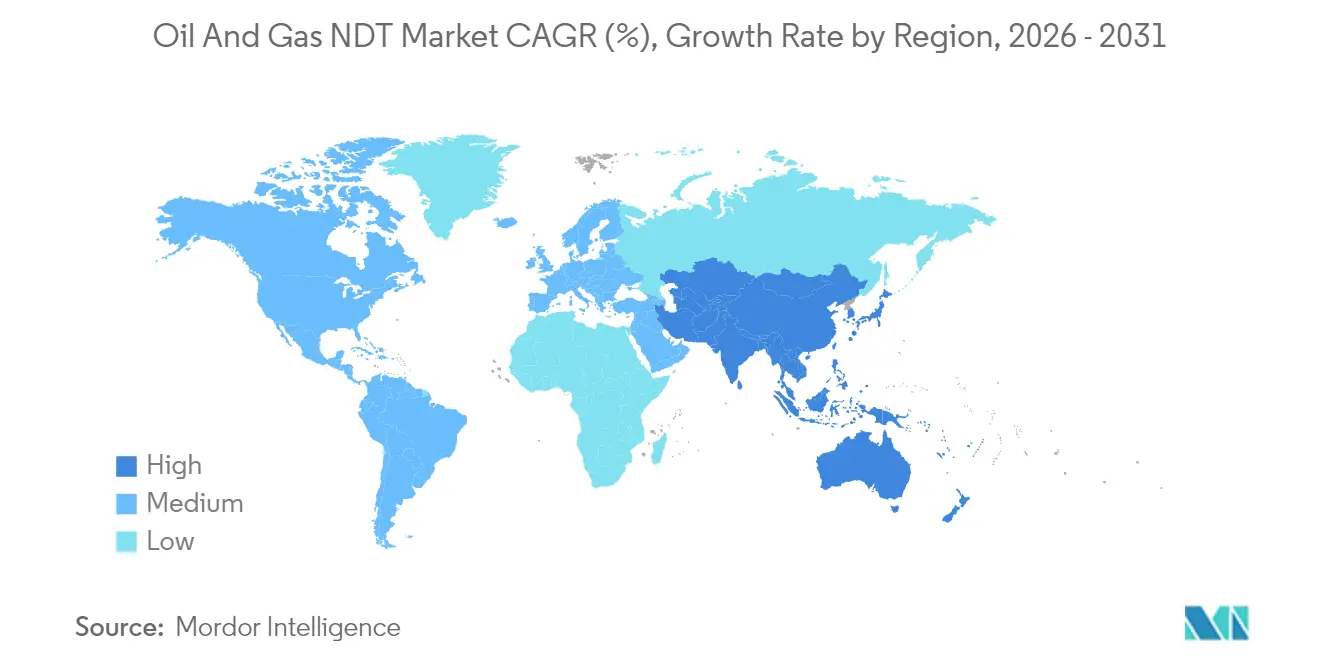
- By geography, North America commanded 38.35% of the Oil and Gas NDT market size in 2025, while the Middle East is set to post the quickest regional CAGR at 6.78% during 2026-2031.
Note: Market size and forecast figures in this report are generated using Mordor Intelligence’s proprietary estimation framework, updated with the latest available data and insights as of 2026.
Global Oil And Gas NDT Market Trends and Insights
Drivers Impact Analysis*
| Driver | (~) % Impact on CAGR Forecast | Geographic Relevance | Impact Timeline |
|---|---|---|---|
| Digitization of upstream asset integrity management | +1.2% | Global, with early adoption in North America and Europe | Medium term (2-4 years) |
| Increasing deepwater and ultra-deepwater exploration projects | +0.8% | Global offshore regions, particularly Gulf of Mexico, North Sea, Brazil | Long term (≥ 4 years) |
| Aging pipeline infrastructure in mature fields | +1.5% | North America core, spill-over to Europe and mature Asia-Pacific fields | Short term (≤ 2 years) |
| Mandated periodic inspection intervals tightened by regulators | +1.1% | North America and EU, expanding to Middle East and Asia-Pacific | Medium term (2-4 years) |
| Adoption of phased array ultrasonic and advanced computed tomography | +0.9% | Global, with higher penetration in North America and Europe | Medium term (2-4 years) |
| Integration of drones and robotics for hazardous area inspection | +0.7% | Global, with early adoption in Middle East, North America offshore | Short term (≤ 2 years) |
| Source: Mordor Intelligence | |||
Digitization of Upstream Asset Integrity Management Accelerates NDT Transformation
Artificial-intelligence engines embedded in ultrasonic and visual inspection workflows now cut interpretation cycle times by as much as 90%.[1]Baker Hughes, “How to Use AI for Assisted Defect Recognition in Visual Testing,” bakerhughes.com Operators adopting cloud-connected analytics gain real-time defect classification and automated report generation that eases regulatory compliance. Early deployments, including AI-driven weld classification achieving 94% accuracy, demonstrate consistent outcomes that tackle skilled-labor shortages. The same algorithms underpin predictive maintenance routines that shift inspections from calendar-based schedules to risk-based triggers, elevating asset uptime and reducing total inspection spend. Equipment vendors are increasingly bundling edge computing modules with phased-array probes, transforming hardware into data nodes that feed digital twins. As data lakes grow, service contracts increasingly specify performance-based fees rather than hourly rates, rewarding vendors that deliver measurable reliability improvements.
Deepwater Exploration Projects Drive Advanced NDT Requirements
The installation of floating production systems at depths exceeding 3,000 m stimulates demand for subsea-rated phased-array scanners capable of detecting ±0.5 mm wall loss. ROV-deployed instruments eliminate diver exposure while trimming vessel time by up to 70%.[2]Deep Trekker, “Discover How ROVs Can Help with Offshore Energy Inspections,” deeptrekker.com New sensor packages combine eddy-current arrays with acoustic emission modules to survey fatigue hotspots in catenary risers that are subjected to extreme dynamic loads. Novel magnetic-memory diagnostics, paired with deep-learning models, have achieved 95.4% validation accuracy in classifying pitting, groove loss, and wear on riser interiors.[3]Xiangyuan Liu and Jianchun Fan, “Research on Nondestructive Testing Technology for Drilling Risers Based on Magnetic Memory and Deep Learning,” Sustainability, doi.org Given higher barrel costs, operators accept premium day rates for inspection vessels that deliver full digital data sets during a single mobilization. These high-value projects secure multi-year service agreements, ensuring predictable cash flows for suppliers of deepwater NDT solutions.
Aging Pipeline Infrastructure Creates Sustained Inspection Demand
Pipelines laid before 1970 account for 67% of U.S. natural-gas transmission mileage, underscoring the need for regular integrity assessments. PHMSA issued USD 196 million in modernization grants that finance replacements of high-risk cast-iron networks. Advisory bulletins now compel operators to locate “hard spots” in vintage steel, driving demand for high-resolution ultrasonic crawlers and metallurgical verification testing. Service providers that fuse historical data with modern imaging re-rating programs secure recurring engagements as clients revisit older assessments in light of newer models that account for flaw growth.
Regulatory Compliance Tightens Inspection Requirements
PHMSA’s 2025 leak-detection rule requires a 90% probability of detection for 10 kg/h methane leaks on transmission lines, effectively mandating more frequent surveys and stricter repair windows. Pipeline Safety Management Systems, covering nearly 85% of U.S. mileage, embed continuous-improvement loops that institutionalize NDT data analytics. In 2025, the agency formally accepted unmanned aerial systems and satellite lidar for right-of-way patrols, broadening the solution set for integrity managers. This evolving rulebook favors vendors certified under the latest consensus standards and able to provide audit-ready digital records.
Restraints Impact Analysis*
| Restraint | (~) % Impact on CAGR Forecast | Geographic Relevance | Impact Timeline |
|---|---|---|---|
| Volatile crude oil prices curbing CAPEX cycles | -0.9% | Global, with higher sensitivity in North America shale regions | Short term (≤ 2 years) |
| Limited skilled workforce for advanced NDT methods | -0.7% | Global, particularly acute in emerging markets and specialized techniques | Medium term (2-4 years) |
| Data security concerns with cloud-based NDT analytics | -0.4% | Global, with heightened sensitivity in regulated industries and government contracts | Medium term (2-4 years) |
| High initial cost of advanced equipment | -0.6% | Global, with higher impact on smaller operators and emerging markets | Short term (≤ 2 years) |
| Source: Mordor Intelligence | |||
Oil Price Volatility Constrains Service Demand
A double-digit slide in Brent prices to USD 66.65/bbl early 2025 prompted forecasts of a 20% dip in U.S. onshore activity if crude falls below USD 60. A decline of USD 5 historically reduces shale spending by about 5%, resulting in fewer welds, risers, and flowlines that require inspection. Although international work shows lower sensitivity, domestic service companies face rig-count retrenchments that compress utilization and squeeze day rates. Simultaneously, an M&A wave valued at USD 200 billion has concentrated purchasing power among fewer super-majors, enabling them to negotiate sharper pricing and longer payment terms. While high-spec deepwater projects remain insulated, short-cycle land activity displays amplified elasticity to price swings.
Workforce Limitations Challenge Technology Adoption
Advanced modalities such as phased-array ultrasonics and computed tomography require inspectors who hold multi-level ASNT certifications and possess data analytics fluency. An aging workforce and limited training pipelines keep vacancy rates elevated, prompting equipment makers to embed AI engines that automate image interpretation and documentation.[4]Baker Hughes, “Leading the Shift: Q&A on the Future of Imaging,” bakerhughes.com Certification bodies have expanded hybrid courses, yet offshore roles still demand extra survival and rope-access credentials, lengthening onboarding cycles. Higher wage premiums can inflate project budgets, while staffing shortages in emerging markets can delay the adoption of cutting-edge systems.
*Our forecasts treat driver/restraint impacts as directional, not additive. The impact forecasts reflect baseline growth, mix effects, and variable interactions.
Segment Analysis
By Component: Services Propel Outsourcing Momentum
Services captured growing budget allocations as operators pivoted from owning equipment to procuring turnkey inspection outcomes. The Oil and Gas NDT market size tied to services is on track for a 6.62% CAGR, driven by the adoption of AI analytics, robotics, and integrity data hosting, which favors specialized vendors over in-house crews. Global service chains bundle multidisciplinary teams with cloud dashboards that reduce internal administrative costs and provide instant regulatory reports.
Equipment retains a substantial 47.25% revenue share, underpinned by capital spending on phased-array arrays, high-speed radiography, and compact CT scanners. Vendors differentiate hardware through open APIs that stream inspection data directly into enterprise asset-management platforms, extending lifecycle revenues via predictive-maintenance software and calibration contracts.


By Testing Method: Computed Tomography Advances High-Resolution Imaging
Ultrasonic testing remains the workhorse, holding 33.20% of the Oil and Gas NDT market share in 2025, thanks to its single-side access and deep penetration capabilities. Time-of-flight diffraction and phased-array configurations now mount on drones for elevated pipe racks and ROVs for subsea spools. Computed tomography, although nascent, is the fastest-growing method, with a projected 7.52% CAGR.
Recent studies confirmed CT’s ability to pinpoint delamination and fiber breakage in 1,500 psi fiberglass lines that conventional ultrasound can miss. Portable CT scanners, paired with fast-scan modes, shorten acquisition times, thereby improving field practicality. Radiography continues to serve heavy-wall welds, while magnetic-particle and dye-penetrant techniques tackle ferromagnetic forgings and surface-breaking flaws, respectively.
By Technique: AI-Enabled Workflows Gain Traction
Traditional techniques still account for 84.95% of 2025 revenues, reflecting a decades-long acceptance by regulators and asset owners. However, AI-enabled inspection pipelines are forecasted to have a 6.32% CAGR as machine-learning algorithms automate weld classifications, corrosion mapping, and anomaly clustering.
Early deployments show end-to-end reporting cycle trims of 50-90%, freeing inspectors to focus on verification rather than slogging through raw data. Cloud architectures enable large-scale model training on diverse defect libraries, continually improving detection fidelity without requiring hardware swaps. Consequently, vendors position AI modules as subscription add-ons, reshaping revenue mixes toward higher-margin software streams.
Geography Analysis
North America accounted for 38.35% of global 2025 spending, driven by a 2.6-million-mile pipeline grid and stringent PHMSA mandates that mandate tighter inspection frequencies. Recent rules on leak detection and hard-spot evaluation are expected to guarantee rising bid volumes, while public-funded replacement projects are expected to enlarge the addressable footage. Major service providers deepen scale through acquisitions that integrate labs, field crews, and digital platforms, enabling one-stop solutions across shale basins and Gulf of Mexico deepwater fields.
The Middle East is recording the fastest trajectory, with a 6.78% CAGR, as national oil companies upgrade their integrity programs in alignment with Vision 2030 diversification targets. Extended partnerships with Aramco and ADNOC prioritize the use of robotic crawlers and inline-inspection tools for previously unpiggable lines, while local content policies drive the establishment of new training centers to certify indigenous technicians. High-temperature desert settings encourage remote and autonomous inspections, accelerating the adoption of drones and crawler robots equipped with panoramic cameras and phased-array probes.
Europe posts steady gains tied to the rejuvenation of mature assets and stringent environmental objectives. Operators refurbish North Sea infrastructure with advanced corrosion-mapping and weld-overlay technologies. Simultaneously, EU methane regulations drive demand for high-sensitivity leak detection, blending conventional ultrasound with satellite data feeds. In the Asia-Pacific region, Australia and Japan focus on extending the life of end-of-life gas assets, whereas India and Southeast Asia build new midstream capacity, opening up dual opportunities for construction-phase radiography and operations-phase ultrasonic mapping. Across Latin America and Africa, demand for inspections tracks offshore campaigns in Brazil and Mozambique, although funding cycles remain more sensitive to price volatility and political shifts.

Regulatory Landscape
Pipeline and offshore safety compliance continues to hinge on incorporating consensus NDT and materials standards, with the United States offering clear recent signals through Federal Register actions. In April 2026, PHMSA issued direct final rules updating incorporation by reference to newer editions of standards used in pipeline integrity programs, including NACE SP0502 (2025) for external corrosion direct assessment, ASME B31.4 (2022) for liquid pipeline transportation systems, and ASTM A333/A333M (2024) for low-temperature steel pipe that includes nondestructive electric test requirements.
Regulatory acceptance of modern inspection and qualification approaches is also moving forward. In April 2026, PHMSA proposed removing a restriction that had limited welders qualified by nondestructive testing from performing certain compressor-station welding, indicating broader confidence in NDT-based qualification pathways. For offshore assets, the US Bureau of Safety and Environmental Enforcement (BSEE) published a final rule in June 2026 (effective August 10, 2026) incorporating updated production measurement and safety standards for Outer Continental Shelf operations, reinforcing the need for audit-ready inspection records tied to recognized industry standards such as ASME BPVC Section V (2025 edition) for nondestructive examination.
Value Chain Analysis
The oil and gas NDT value chain begins with upstream inputs (ultrasonic probes, X-ray sources and detectors, sensors, couplants, films and digital consumables, and software components), followed by OEMs that design and manufacture inspection equipment (ultrasonic, radiographic, and imaging systems) and robotics or remote platforms. Integrators and service providers then deliver field inspection, data interpretation, reporting, and certification. Large TIC and specialist NDT companies increasingly bundle equipment capability with digital platforms that manage inspection data across the asset lifecycle, aligning outputs to owner-operator integrity management and regulatory audit needs.
Downstream, end users include upstream operators, pipeline operators, terminals, refineries, and LNG facilities, which procure NDT during construction (weld QA/QC) and operations (corrosion monitoring and fitness-for-service support). The main constraints center on qualified labor availability for advanced methods and the time cost of manual data interpretation. These gaps are being addressed through standardized digital data capture and the use of drones and robotic crawlers for hazardous or hard-to-access assets, shifting spend toward integrated service contracts and recurring analytics and reporting workflows.
Competitive Landscape
The Oil and Gas NDT market exhibits moderate concentration, with the top five groups capturing roughly 50-60% of global revenues. SGS’s USD 1.325 billion purchase of Applied Technical Services expanded its North American footprint and integrated metallurgy labs with field inspection teams. Baker Hughes’ planned USD 13.6 billion acquisition of Chart Industries strengthens its equipment breadth, from cryogenic tanks to rotary compressors, and integrates proprietary InspectionWorks software into a larger installed base. These moves illustrate a race to bundle hardware, services, and analytics inside single contracts.
Technology remains the key differentiator. Waygate Technologies embeds AI in visual testing, enabling automated crack detection and report generation within minutes on handheld devices. NDT Global utilizes ultrasonic constellations to capture high-resolution corrosion metrics in pipelines up to 56 inches in diameter, while innovators such as INGU supply palm-sized smart balls for low-pressure distribution networks. Vendors capable of integrating inspection data into enterprise resource planning stacks gain stickiness and unlock upsell paths in data analytics and compliance dashboards.
Regional challengers employ localization strategies. Middle-East service firms co-invest with OEMs to establish repair hubs and training academies, thereby ensuring asset owner confidence and shortening turnaround times. Similar localization mandates in Brazil and India stimulate joint ventures that transfer phased-array fabrication know-how. As consolidation proceeds, smaller specialists position themselves as niche experts for high-temperature reactors or subsea flexible risers, banking on deep domain knowledge that larger conglomerates may overlook.
Oil And Gas NDT Industry Leaders
Baker Hughes Company
Mistras Group Inc.
SGS SA
Intertek Group plc
Applus Services SA
- *Disclaimer: Major Players sorted in no particular order


Market Opportunities and Future Outlook
A key whitespace area remains inspection of unpiggable and subsea pipelines, where conventional inline inspection is limited by geometry, flow conditions, or operational constraints. In April 2026, TSC Subsea and NDT Global described an offshore inspection campaign using tethered internal robotic crawlers with Acoustic Resonance Technology (ART Scan) to capture full-circumferential wall thickness data without cleaning or asset modification, outlining a pathway for life-extension work that couples robotics with high-resolution NDT data products.
Another opportunity is shifting from periodic testing to condition-based monitoring, supported by higher-frequency data streams and automated interpretation. A June 2026 trade-technical article described robotic phased-array ultrasonic testing with full matrix capture and adaptive total focusing method imaging for offshore girth weld inspection, supporting wider deployment of advanced UT imaging in constrained environments. Competency standardization also supports scalable service delivery, with ASNTs Oil and Gas Industry Sector Qualification (ISQ) program work in 2026 to develop exams for guided wave tube testing and structural weld UT aligning workforce qualification with newer techniques, which supports outsourcing by operators that need consistent, auditable performance across regions and contractors.
Recent Industry Developments
- May 2026: Baker Hughes extended and expanded its integrated well construction contract with Petrobras covering work across Brazils Santos Basin. The multi-service scope reinforces long-duration contracting models that embed advanced downhole systems and digital workflows, tightening the link between drilling execution and inspection-grade data across the asset lifecycle.
- April 2026: Baker Hughes entered into a definitive agreement to sell its Waygate Technologies NDT business to Hexagon for about USD 1.45 billion in an all-cash transaction. The deal transfers a major portfolio spanning remote visual inspection, ultrasound, radiography, and imaging into a metrology and industrial data platform owner, reshaping competitive positioning for connected NDT hardware and software ecosystems.
- December 2025: Mistras Group was awarded an NDT services contract by Bechtel for Woodsides USD 17.5 billion Louisiana LNG terminal project in Sulphur, Louisiana. The scope includes RT, UT, MT, PT, PMI, and leak testing, underscoring how megaproject construction awards concentrate demand into multi-method, compliance-driven service packages.


Research Methodology Framework and Report Scope
Market Definition and Coverage
For this study, we size the revenue earned from non-destructive testing carried out across oil and gas assets to detect flaws, corrosion, and integrity risks without damaging the asset. The coverage spans field and shop inspection activity used in upstream, midstream, and downstream operations.
Scope exclusions: We exclude destructive testing and lab-only metallurgical analysis when it is not part of the NDT service or equipment-driven inspection workflow.
Segmentation Overview
- By Component
- Equipment
- Software
- Services
- Consumables
- By Testing Method
- Ultrasonic Testing
- Radiographic Testing
- Magnetic Particle Testing
- Liquid Penetrant Testing
- Visual Inspection Testing
- Eddy-Current Testing
- Acoustic Emission Testing
- Thermography / Infrared Testing
- Computed Tomography Testing
- By Technique
- Traditional / Conventional
- AI-enabled
- By Geography
- North America
- United States
- Canada
- Mexico
- South America
- Brazil
- Argentina
- Rest of South America
- Europe
- Germany
- United Kingdom
- France
- Italy
- Spain
- Rest of Europe
- Asia Pacific
- China
- Japan
- India
- South Korea
- South-East Asia
- Rest of Asia Pacific
- Middle East
- Saudi Arabia
- United Arab Emirates
- Turkey
- Rest of Middle East
- Africa
- South Africa
- Nigeria
- Rest of Africa
- North America
Data Sources, Market Sizing, and Validation
Desk Research
Desk work started with mapping where NDT demand is created in oil and gas, which is mainly pipelines, pressure vessels, storage tanks, refineries, LNG facilities, and offshore structures. To anchor that demand to real activity, we referenced public statistics and disclosures such as IEA energy investment indicators, EIA oil and gas data series, OSHA and similar safety guidance, PHMSA pipeline incident and mileage statistics in the US, and API codes and recommended practices that influence inspection frequency.
Then, we used company annual reports and investor presentations to understand how inspection spending changes with maintenance cycles, turnaround schedules, and integrity programs. We also relied on a paid subscription for company financials and news to cross-check business exposure and contract wins, and we used a patent database to track where digital and AI-enabled inspection features are being developed. The sources listed here are illustrative only, and we used additional public references for data collection, cross-checking, and clarification.
Primary Interviews and Surveys
Primary work was used to confirm what the desk sources cannot show clearly, such as how frequently different assets are inspected, how pricing moves with certification and QA requirements, and where automation is replacing manual procedures. We spoke with a mix of service providers, equipment suppliers, and asset operators across the Americas, EMEA, and APAC so the assumptions reflect a realistic blend of mature and higher-growth oil and gas regions.
Distribution of primary research fieldwork respondents
| Company type | Respondent position | Region |
|---|---|---|
| Top tier: 36% | CXOs: 16% | APAC: 42% |
| Mid tier: 47% | Functional/Unit leaders: 24% | EMEA: 31% |
| Smaller Players: 17% | Managers: 60% | Americas: 27% |
Market-Sizing & Forecasting
Sizing starts with a top-down build where pipeline mileage, refinery and LNG capacity, offshore project activity, and integrity program intensity are used to reconstruct the likely inspection demand pool by region and asset type, before translating activity into revenue using method mix and average service pricing. We then corroborate totals with selective bottom-up checks, including sampled provider revenue exposure to oil and gas, channel feedback on equipment placements, and sanity checks on service hours multiplied by typical day rates, which helps correct for gaps where reporting is limited.
Inputs used in the model include announced and observed turnaround cycles, regulatory inspection intervals tied to pipeline safety and pressure equipment standards, the split between conventional and AI-enabled techniques, utilization levels for advanced methods like ultrasonic and radiographic inspection, and regional labor and certification cost differences that move service pricing. Forecasts were built using scenario analysis, where oil and gas capex, maintenance intensity, and inspection digitization adoption are varied in a controlled way, and then aligned to what interviewees described as feasible in the next five years.
Data Validation & Update Cycle
We validate outputs through multiple passes, starting with cross-checks against independent signals like oil and gas maintenance spending direction, pipeline additions and rehabilitation activity, and major project commissioning timelines. Outliers are flagged when growth or pricing moves too far from what asset cycles typically allow, and the assumptions are then re-tested with follow-up calls when needed.
Before sign-off, another analyst reviews the math, the logic behind key drivers, and the consistency of regional splits, and then checks that definitions are applied the same way across the time series. Reports are refreshed annually, with interim updates when material events change inspection activity or pricing, and a final freshness check is completed right before delivery.
Mordor Intelligence's Oil and Gas Global Non Destructive Testing Market Sizing Compared With Other Published Estimates
Published market numbers for oil and gas NDT often differ because the boundary of what counts as NDT revenue is not treated the same way, and because firms lean on different demand signals when hard spending data is not directly visible. Differences also show up when the same year is not used as the reference point, or when currency timing and inflation assumptions are applied unevenly.
Pipeline mileage statistics, refinery and LNG capacity signals, and turnaround cadence checks act as evidence gates that keep Mordor Intelligence aligned to a repeatable inspection demand pool, rather than letting adjacent TIC services or broader industrial NDT spill into the total.
Benchmark comparison
| Source | Market Size | Gaps in Research Methodology |
|---|---|---|
| Mordor Intelligence | USD 6.22 B (2026) | |
| Trade Publisher A | USD 6.22 B (2025) | Uses a different reference year and appears to mix equipment and service scope without clearly separating ongoing oil and gas inspection work from one-time project spikes, which can shift the total even if the headline looks close. |
| Industry Portal B | USD 4.80 B (2025) | Likely applies a narrower service-only lens and a more aggressive filtering of digital software and advanced inspection workflows, which can undercount revenue where AI-enabled analysis is priced as part of the inspection package. |
The table shows that the spread is mainly explained by scope boundaries and by which year is treated as the anchor for pricing and activity levels. By keeping the demand drivers tied to observable asset integrity signals and then checking the result against provider exposure and practical pricing, the estimate stays transparent and can be reproduced with the same inputs.


Key Questions Answered in the Report
How large is the oil and gas NDT market in 2026?
Global spending reaches USD 6.22 billion in 2026 and is forecast to rise to USD 8.27 billion by 2031.
Which testing method currently leads spend in oil and gas inspections?
Ultrasonic testing holds the top position with 33.20% of 2025 revenue.
Why are AI-enabled inspection techniques gaining traction?
They automate defect classification, cut interpretation cycle times by up to 90%, and support predictive maintenance, easing skilled-labor shortages.
What region is projected to grow fastest for oil and gas NDT through 2031?
The Middle East is expected to post the quickest expansion at a 6.78% CAGR during 2026-2031.
How do new PHMSA rules influence inspection demand?
The 2025 leak-detection rule mandates a 90% probability of detecting 10 kg/h methane leaks and tighter repair windows, driving more frequent and sophisticated surveys.
What is the main benefit of ROV-deployed phased-array systems for deepwater assets?
They deliver ±0.5 mm wall-loss detection accuracy, eliminate diver exposure, and reduce vessel costs by as much as 70%.
Page last updated on:






