| Study Period | 2017 - 2030 |
| Base Year For Estimation | 2024 |
| Forecast Data Period | 2025 - 2030 |
| Market Size (2025) | USD 23.37 Billion |
| Market Size (2030) | USD 40.39 Billion |
| CAGR (2025 - 2030) | 11.57 % |
| Market Concentration | Low |
Major Players*Disclaimer: Major Players sorted in no particular order |

Non-Dairy Milk Market Analysis
The Non-Dairy Milk Market size is estimated at 23.37 billion USD in 2025, and is expected to reach 40.39 billion USD by 2030, growing at a CAGR of 11.57% during the forecast period (2025-2030).
The non-dairy milk industry is experiencing a significant transformation driven by evolving consumer preferences and lifestyle changes. Global per capita consumption of plant milk reached 1.28 kg in 2022, reflecting the growing acceptance of dairy alternatives across different consumer segments. This shift is particularly evident in the retail sector, where off-trade channels demonstrated robust growth of 6.84% in 2022, primarily attributed to enhanced consumer satisfaction and convenience in purchasing. The industry is witnessing a notable trend toward premium and specialized products, with retailers focusing on diverse product offerings and improved visibility to meet sophisticated consumer demands.
Product innovation and flavor diversification have become crucial differentiators in the non-dairy milk market, with manufacturers continuously introducing new variants to capture consumer interest. Retailers are expanding their product portfolios to include various options such as unsweetened, chocolate, and vanilla flavors, while maintaining competitive pricing strategies. For instance, oat milk was priced at an average of USD 2.55 in 2022, making it accessible to a broader consumer base. The industry is also witnessing significant partnerships, exemplified by Starbucks Argentina's collaboration with NotCo in 2023, highlighting the growing importance of strategic alliances in market expansion.
Health consciousness and dietary preferences are reshaping consumption patterns, particularly in developed markets. In Australia, the correlation between health conditions and plant milk consumption is evident, with 30% of the population diagnosed with irritable bowel syndrome (IBS) in 2022, driving demand for alternatives like oat milk due to its digestive benefits. The industry is responding by focusing on fortification and nutritional enhancement of products, ensuring they meet diverse dietary requirements while maintaining taste and texture preferences.
The distribution landscape is evolving with the modernization of retail channels and the integration of digital technologies. Specialty stores are gaining prominence by offering enhanced product visibility and detailed information about ingredients and sourcing. The market is witnessing a shift toward an omnichannel presence, with retailers investing in both physical and digital infrastructure to provide seamless shopping experiences. This evolution is supported by innovative packaging solutions, clear labeling practices, and improved shelf-life management, enabling retailers to better serve health-conscious consumers while maintaining product quality and freshness. The dairy-free market is adapting to these milk trends, ensuring that the plant-based milk trends align with consumer expectations.
Global Non-Dairy Milk Market Trends
The increasing prevalence of milk allergies, the availability of a wide variety of options, and changing consumer preferences for healthy and sustainable food choices are driving the consumption of plant-based milk
- Plant-based milk is the highest-consumed category among all dairy alternatives globally. Soy milk, almond milk, and oat milk are highly popular and collectively had more than 50% share in the overall plant milk consumption in 2022 due to the increasing prevalence of milk allergies, thus driving the demand for plant-based milk globally. Soy milk is a rich source of vitamins, proteins, and potassium and has a lower calorie content than cow's milk. Due to its high nutrient content, it is considered an ideal substitute for dairy products.
- The popularity of plant milk skyrocketed over the past decade. About 54% of consumers prefer plant-based milk in Europe. However, such drinks have been consumed for centuries in various cultures. For example, tiger nut milk, known as horchata de chufa, is a popular national drink in Spain. Plant milk has become a household staple and is no longer consumed exclusively by vegans and vegetarians. In fact, 43% of European consumers now purchase dairy and dairy alternatives.
- Nearly half of the US population (47%) consumes plant-based milk regularly, which increases to 56% in the Millennial and Generation X age groups. Factors such as growing lactose intolerance, changing preference toward healthy food, and sustainable ingredient sourcing influence consumer choice. In the United States, about 40% of Generation Z, 38% of Millennials, 34% of Generation X, and 21% of Baby Boomers consume plant-based milk due to sustainably sourced ingredients.

Understand The Key Trends Shaping This Market
Download PDF
OTHER KEY INDUSTRY TRENDS COVERED IN THE REPORT
- Increasing consumer preference for vegan food and manufacturers' focus on new product innovations are driving the production of plant-based milk
Segment Analysis: Product Type
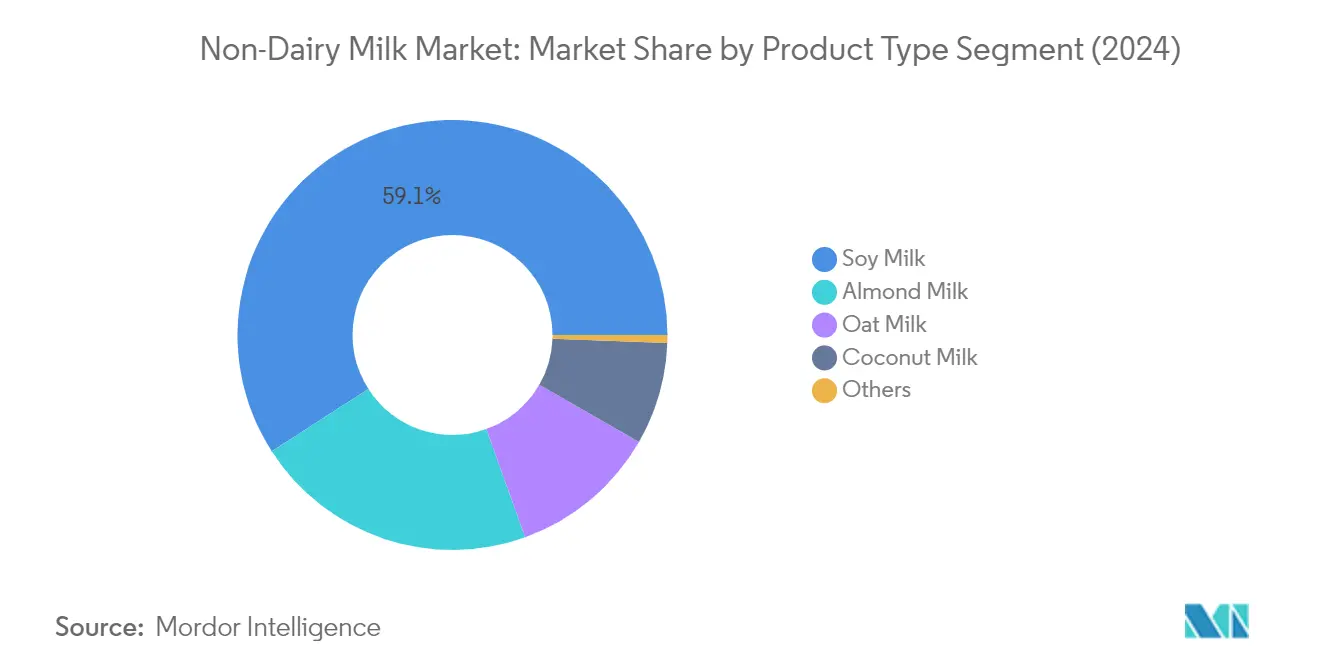
Soy Milk Segment in Non-Dairy Milk Market
Soy milk continues to dominate the global non-dairy milk market, holding approximately 59% market share in 2024. The segment's dominance is primarily attributed to its high protein content, nutritional benefits, and established consumer acceptance worldwide. In the Asia-Pacific region, particularly China, soy milk remains deeply embedded in cultural dietary habits, contributing significantly to its market leadership. The effectiveness of soy milk in reducing bad cholesterol while increasing good cholesterol has made it a preferred choice among health-conscious consumers. Additionally, the segment benefits from well-developed supply chains and competitive pricing compared to other plant-based alternatives, making it more accessible to a broader consumer base.
Hemp Milk Segment in Non-Dairy Milk Market
The hemp milk segment is emerging as the fastest-growing category in the non-dairy milk market, projected to grow at approximately 16% during 2024-2029. This remarkable growth is driven by increasing consumer awareness of hemp milk's nutritional benefits, particularly its rich content of omega-3 fatty acids, proteins, and essential minerals. The segment's expansion is further supported by favorable regulations promoting hemp cultivation for industrial use, especially in key markets like the United States and European countries. The rising demand among fitness enthusiasts and the introduction of innovative flavored variants are expected to maintain this growth momentum, with manufacturers increasingly focusing on product development and marketing strategies to capitalize on this trend.
Remaining Segments in Non-Dairy Milk Market
The non-dairy milk market features several other significant segments, including almond milk, oat milk, coconut milk, cashew milk, and hazelnut milk, each catering to specific consumer preferences and needs. Almond milk has established itself as a popular choice due to its low-calorie content and smooth texture, particularly in Western markets. Oat milk has gained substantial traction in the coffee industry due to its barista-friendly properties and sustainability credentials. Coconut milk continues to be favored in Asian cuisines and as a creamy alternative in beverages, while cashew milk and hazelnut milk varieties offer unique flavor profiles and nutritional benefits, contributing to the market's diversity and meeting various consumer preferences and dietary requirements.
Segment Analysis: Distribution Channel
Off-trade Segment in Non-Dairy Milk Market
The off-trade distribution channel dominates the global non-dairy milk market, accounting for approximately 85% of the total market volume in 2024. This significant market share is primarily driven by the widespread network of supermarkets, hypermarkets, and convenience stores offering a broad selection of plant-based milk products. The segment's dominance is further strengthened by the increasing consumer preference for purchasing plant-based milk through retail channels that offer various price points, promotional discounts, and a wider variety of brands and flavors. Additionally, the growth of e-commerce platforms and specialized health food stores has expanded the accessibility of plant-based milk products to consumers. The off-trade channel's robust performance is also supported by the strategic expansion of retail chains and their focus on dedicating significant shelf space to plant-based beverages, with some retailers allocating up to 30% of their beverage section to these products.
On-trade Segment in Non-Dairy Milk Market
The on-trade distribution channel is projected to experience steady growth in the non-dairy milk market from 2024 to 2029. This growth is primarily driven by the increasing adoption of plant-based milk alternatives in coffee shops, restaurants, and other foodservice establishments. The segment's expansion is supported by the rising café culture and the growing consumer demand for plant-based options in beverages. Major coffee chains and foodservice outlets are continuously expanding their plant-based milk offerings, including options like oat milk, almond milk, and soy milk, to cater to evolving consumer preferences. The segment is also benefiting from the increasing number of specialized vegan cafés and restaurants that exclusively focus on plant-based offerings, contributing to the broader acceptance and availability of non-dairy milk alternatives in the foodservice sector.
Non-Dairy Milk Market Geography Segment Analysis
Non-Dairy Milk Market in Africa
The African non-dairy milk market is experiencing significant growth driven by increasing consumer awareness about health benefits and rising lactose intolerance across the region. Countries like Egypt, Nigeria, and South Africa are witnessing a surge in demand for plant-based milk alternatives, particularly due to the growing adoption of vegan and vegetarian lifestyles. The market is characterized by strong distribution networks through both modern retail channels and traditional stores, with supermarkets and hypermarkets playing a crucial role in product accessibility.
Non-Dairy Milk Market in South Africa
South Africa stands as the largest market for non-dairy milk in the African region, with approximately 33% market share expected in 2024. The country's market is driven by the increasing popularity of veganism and the rising number of consumers signing up for plant-based diets. Strong brand penetration from companies like Alpro, NutriSoy, Vitasoy, and Woolworths has contributed to market growth. The country's retail landscape has evolved to accommodate this growing demand, with dedicated vegan spaces and kiosks equipped with several global and private labels.
Non-Dairy Milk Market in Egypt
Egypt represents the fastest-growing market for non-dairy milk in Africa, with a projected growth rate of around 14% from 2024 to 2029. The market's rapid expansion is primarily attributed to increasing health consciousness and the rising prevalence of lactose intolerance among consumers. The country has seen significant development in its distribution channels, particularly in convenience stores and supermarkets, which promote impulse purchases through strategic product positioning. The market is particularly strong in almond milk consumption, with consumers increasingly preferring dairy alternative market options that are lactose-free and offer various health benefits.
Non-Dairy Milk Market in Asia-Pacific
The Asia-Pacific region dominates the global non-dairy milk market, characterized by diverse consumer preferences and strong market penetration across various countries. China, Japan, and South Korea exhibit significant consumption patterns compared to other Asian nations, collectively driving regional growth. The market is supported by increasing awareness about plant-based nutrition and strong agricultural production bases for raw materials used in plant-based milk alternatives.
Non-Dairy Milk Market in China
China leads the Asia-Pacific non-dairy milk market, commanding approximately 28% of regional market share in 2024. The country's dominance is attributed to its large consumer base and well-established distribution networks. Chinese consumers are increasingly adopting plant-based alternatives due to rising health consciousness and environmental concerns, with soy milk being particularly popular among various demographic groups.
Non-Dairy Milk Market in Australia
Australia emerges as the fastest-growing market in the Asia-Pacific region, with an expected growth rate of around 20% from 2024 to 2029. The country's rapid market expansion is driven by increasing consumer preference for plant-based products, with over 40% of Australian households regularly purchasing plant-based milk. The market growth is further supported by strong retail partnerships and innovative product launches catering to health-conscious consumers.
Non-Dairy Milk Market in Europe
The European non-dairy milk market demonstrates robust growth, driven by increasing consumer awareness and environmental consciousness. Countries across the region are witnessing a significant shift towards dairy alternative market options, with Germany, the United Kingdom, and Spain leading the transformation. The market is characterized by strong innovation in product development and increasing retail penetration of plant-based alternatives.
Non-Dairy Milk Market in Germany
Germany stands as the largest market for non-dairy milk in Europe, expected to hold approximately 25% of the regional market share in 2024. The country's market leadership is supported by high consumer familiarity with plant-based alternatives, particularly oat milk, which has become increasingly popular among German consumers. The market is characterized by strong retail presence and innovative product launches from both global and local brands.
Non-Dairy Milk Market in United Kingdom
The United Kingdom represents the fastest-growing market in Europe, with a projected growth rate of around 18% from 2024 to 2029. The market's rapid expansion is driven by increasing environmental and health concerns among consumers, with non-dairy milk becoming a popular choice in coffee shops and retail outlets. The country has seen significant development in its dairy-free market offerings, with major coffee chains and retailers expanding their dairy-alternative options.
Non-Dairy Milk Market in Middle East
The Middle Eastern non-dairy milk market is experiencing significant growth, driven by changing consumer preferences and increasing health consciousness across the region. Countries including UAE, Saudi Arabia, Qatar, Kuwait, Bahrain, and Oman are witnessing rising demand for plant-based alternatives. The United Arab Emirates leads the regional market, while Qatar shows the fastest growth potential. The market is characterized by strong distribution networks through modern retail channels and increasing product innovation to meet local consumer preferences.
Non-Dairy Milk Market in North America
The North American non-dairy milk industry demonstrates strong growth potential, driven by increasing consumer awareness and expanding product availability. The United States leads the regional market, while Mexico shows the fastest growth trajectory. The market is characterized by robust distribution networks, innovative product launches, and strong retail presence. Consumer preference for healthier alternatives and environmental consciousness continues to drive market expansion across the region.
Non-Dairy Milk Market in South America
The South American non-dairy milk industry shows promising growth potential, with increasing consumer awareness about plant-based alternatives and health benefits driving market expansion. Argentina leads the regional market, while Brazil demonstrates significant growth potential. The market is characterized by expanding distribution networks and increasing product innovation to meet local consumer preferences. The region's growing vegan population and rising health consciousness continue to drive market development.
Get Analysis on Important Geographic Markets
Download PDF
Non-Dairy Milk Industry Overview
Top Companies in Non-Dairy Milk Market
The non-dairy milk market features prominent players like Danone SA, Hebei Yangyuan Zhihui Beverage, Oatly Group AB, Coconut Palm Group, and Vitasoy International Holdings leading the industry. Companies are heavily focused on product innovation through the introduction of new flavors, fortified variants, and specialized formulations like barista editions to cater to diverse consumer preferences. Operational agility is demonstrated through investments in R&D facilities, sustainable production practices, and the adoption of advanced processing technologies. Strategic moves include partnerships with coffee chains, foodservice establishments, and retail distributors to enhance product accessibility and visibility. Geographic expansion is pursued through the establishment of new production facilities, particularly in high-growth markets, while strengthening distribution networks in existing territories through both online and offline channels.
Market Dominated by Global and Regional Leaders
The non-dairy milk market exhibits a mix of global conglomerates and specialized non-dairy milk companies. Global players like Danone SA and Nestlé leverage their extensive distribution networks, brand recognition, and research capabilities to maintain market leadership, while regional specialists such as Oatly and Califia Farms compete through product innovation and focused market strategies. The market structure varies by region, with Asia-Pacific showing a stronger presence of local players who understand regional taste preferences and consumption patterns, while North America and Europe are dominated by multinational corporations with diverse product portfolios.
The industry is experiencing ongoing consolidation through strategic acquisitions and partnerships, particularly as larger food and beverage companies seek to expand their dairy alternative market portfolios. Market entry barriers are moderate to high, considering the requirements for production facilities, distribution networks, and compliance with food safety regulations. Companies are increasingly focusing on vertical integration to control quality and costs, while also pursuing strategic alliances with ingredient suppliers and technology providers to enhance their competitive position.
Innovation and Sustainability Drive Future Success
For incumbent companies to maintain and increase their market share, focus on product innovation, sustainability initiatives, and digital transformation is crucial. Leading players are investing in research and development to improve taste profiles, nutritional content, and functionality of plant-based milk products. Supply chain optimization, sustainable sourcing practices, and eco-friendly packaging solutions are becoming increasingly important for market success. Companies are also strengthening their direct-to-consumer channels and expanding their presence in emerging markets through localized product offerings and marketing strategies.
New entrants and challenger brands can gain ground by focusing on niche market segments, innovative ingredients, and unique value propositions. Success factors include developing strong relationships with retail partners, investing in brand building, and leveraging digital marketing channels to connect with health-conscious consumers. The regulatory landscape, particularly regarding labeling requirements and nutritional claims, continues to evolve and companies must maintain compliance while adapting their strategies. Market players must also address concerns about raw material sourcing, price competitiveness with dairy milk, and changing consumer preferences to ensure long-term success in the market.
Non-Dairy Milk Market Leaders
-
Coconut Palm Group Co. Ltd
-
Danone SA
-
Hebei Yangyuan Zhihui Beverage Co. Ltd
-
Oatly Group AB
-
Vitasoy International Holdings Ltd
- *Disclaimer: Major Players sorted in no particular order

Need More Details on Market Players and Competiters?
Download PDF
Non-Dairy Milk Market News
- September 2022: Vitasoy launched a plant-based milk range Plant+, which includes oat and almond milk varieties with zero cholesterol, low sugar, and high calcium.
- September 2022: Vitasoy launched the Vitasoy Plant+ range of plant milk in the Singaporean market. These plant-based milk products are available in almond, oat, and soy varieties and are high in calcium and low in sugar with zero cholesterol.
- August 2022: Califia Farms expanded its portfolio by launching a dairy-free product, the Pumpkin Spice Oat Barista.
Free With This Report
We provide a comprehensive and exhaustive set of data pointers for global, regional, and country-level metrics that illustrate the fundamentals of the dairy alternatives industry. With the help of 45+ free charts, clients can access in-depth market analysis based on per capita consumption numbers and production data of raw materials for dairy alternatives, through granular level segmental information supported by a repository of market data, trends, and expert analysis. Data and analysis on dairy alternative products, categories of dairy alternative products, product types, etc., are available in the form of comprehensive reports as well as excel based data worksheets.


Non-Dairy Milk Market Report - Table of Contents
1. EXECUTIVE SUMMARY & KEY FINDINGS
2. REPORT OFFERS
3. INTRODUCTION
- 3.1 Study Assumptions & Market Definition
- 3.2 Scope of the Study
- 3.3 Research Methodology
4. KEY INDUSTRY TRENDS
- 4.1 Per Capita Consumption
-
4.2 Raw Material/commodity Production
- 4.2.1 Dairy Alternative - Raw Material Production
-
4.3 Regulatory Framework
- 4.3.1 Australia
- 4.3.2 Canada
- 4.3.3 China
- 4.3.4 France
- 4.3.5 Germany
- 4.3.6 India
- 4.3.7 Italy
- 4.3.8 Japan
- 4.3.9 Mexico
- 4.3.10 South Korea
- 4.3.11 United Kingdom
- 4.3.12 United States
- 4.4 Value Chain & Distribution Channel Analysis
5. MARKET SEGMENTATION (includes market size in Value in USD and Volume, Forecasts up to 2030 and analysis of growth prospects)
-
5.1 Product Type
- 5.1.1 Almond Milk
- 5.1.2 Cashew Milk
- 5.1.3 Coconut Milk
- 5.1.4 Hazelnut Milk
- 5.1.5 Hemp Milk
- 5.1.6 Oat Milk
- 5.1.7 Soy Milk
-
5.2 Distribution Channel
- 5.2.1 Off-Trade
- 5.2.1.1 Convenience Stores
- 5.2.1.2 Online Retail
- 5.2.1.3 Specialist Retailers
- 5.2.1.4 Supermarkets and Hypermarkets
- 5.2.1.5 Others (Warehouse clubs, gas stations, etc.)
- 5.2.2 On-Trade
-
5.3 Region
- 5.3.1 Africa
- 5.3.1.1 By Product Type
- 5.3.1.2 By Distribution Channel
- 5.3.1.3 Egypt
- 5.3.1.4 Nigeria
- 5.3.1.5 South Africa
- 5.3.1.6 Rest of Africa
- 5.3.2 Asia-Pacific
- 5.3.2.1 By Product Type
- 5.3.2.2 By Distribution Channel
- 5.3.2.3 Australia
- 5.3.2.4 China
- 5.3.2.5 India
- 5.3.2.6 Indonesia
- 5.3.2.7 Japan
- 5.3.2.8 Malaysia
- 5.3.2.9 New Zealand
- 5.3.2.10 Pakistan
- 5.3.2.11 South Korea
- 5.3.2.12 Rest of Asia Pacific
- 5.3.3 Europe
- 5.3.3.1 By Product Type
- 5.3.3.2 By Distribution Channel
- 5.3.3.3 Belgium
- 5.3.3.4 France
- 5.3.3.5 Germany
- 5.3.3.6 Italy
- 5.3.3.7 Netherlands
- 5.3.3.8 Russia
- 5.3.3.9 Spain
- 5.3.3.10 Turkey
- 5.3.3.11 United Kingdom
- 5.3.3.12 Rest of Europe
- 5.3.4 Middle East
- 5.3.4.1 By Product Type
- 5.3.4.2 By Distribution Channel
- 5.3.4.3 Bahrain
- 5.3.4.4 Kuwait
- 5.3.4.5 Oman
- 5.3.4.6 Qatar
- 5.3.4.7 Saudi Arabia
- 5.3.4.8 United Arab Emirates
- 5.3.4.9 Rest of Middle East
- 5.3.5 North America
- 5.3.5.1 By Product Type
- 5.3.5.2 By Distribution Channel
- 5.3.5.3 Canada
- 5.3.5.4 Mexico
- 5.3.5.5 United States
- 5.3.5.6 Rest of North America
- 5.3.6 South America
- 5.3.6.1 By Product Type
- 5.3.6.2 By Distribution Channel
- 5.3.6.3 Argentina
- 5.3.6.4 Brazil
- 5.3.6.5 Rest of South America
6. COMPETITIVE LANDSCAPE
- 6.1 Key Strategic Moves
- 6.2 Market Share Analysis
- 6.3 Company Landscape
-
6.4 Company Profiles (includes Global Level Overview, Market Level Overview, Core Business Segments, Financials, Headcount, Key Information, Market Rank, Market Share, Products and Services, and Analysis of Recent Developments).
- 6.4.1 Blue Diamond Growers
- 6.4.2 Califia Farms LLC
- 6.4.3 Coconut Palm Group Co. Ltd
- 6.4.4 Danone SA
- 6.4.5 Hebei Yangyuan Zhihui Beverage Co. Ltd
- 6.4.6 Nestlé SA
- 6.4.7 Oatly Group AB
- 6.4.8 Sanitarium Health and Wellbeing Company
- 6.4.9 Saputo Inc.
- 6.4.10 The Alnatura Produktions- und Handels GmbH
- 6.4.11 The Hain Celestial Group Inc.
- 6.4.12 Vitasoy International Holdings Ltd
7. KEY STRATEGIC QUESTIONS FOR DAIRY AND DAIRY ALTERNATIVE CEOS
8. APPENDIX
-
8.1 Global Overview
- 8.1.1 Overview
- 8.1.2 Porter’s Five Forces Framework
- 8.1.3 Global Value Chain Analysis
- 8.1.4 Market Dynamics (DROs)
- 8.2 Sources & References
- 8.3 List of Tables & Figures
- 8.4 Primary Insights
- 8.5 Data Pack
- 8.6 Glossary of Terms
You Can Purchase Parts Of This Report. Check Out Prices For Specific Sections
Get Price Break-up Now
List of Tables & Figures
- Figure 1:
- PER CAPITA CONSUMPTION OF NON-DAIRY MILK, KG, GLOBAL, 2017 - 2029
- Figure 2:
- PRODUCTION VOLUME OF GLOBAL NON-DAIRY MILK MARKET - RAW MATERIAL, METRIC TONNES, GLOBAL, 2017 - 2021
- Figure 3:
- VOLUME OF NON-DAIRY MILK, METRIC TONNES, BY GLOBAL, 2017 - 2029
- Figure 4:
- VALUE OF NON-DAIRY MILK, USD MN, BY GLOBAL, 2017 - 2029
- Figure 5:
- VOLUME OF NON-DAIRY MILK MARKET BY PRODUCT TYPE, METRIC TONNES, GLOBAL, 2017 - 2029
- Figure 6:
- VALUE OF NON-DAIRY MILK MARKET BY PRODUCT TYPE, USD MN, GLOBAL, 2017 - 2029
- Figure 7:
- VOLUME SHARE OF NON-DAIRY MILK MARKET BY PRODUCT TYPE, %, GLOBAL, 2017 VS 2023 VS 2029
- Figure 8:
- VALUE SHARE OF NON-DAIRY MILK MARKET BY PRODUCT TYPE, %, GLOBAL, 2017 VS 2023 VS 2029
- Figure 9:
- VOLUME OF ALMOND MILK MARKET, METRIC TONNES, GLOBAL, 2017 - 2029
- Figure 10:
- VALUE OF ALMOND MILK MARKET, USD MN, GLOBAL, 2017 - 2029
- Figure 11:
- VALUE SHARE OF ALMOND MILK MARKET, BY DISTRIBUTION CHANNEL, %, GLOBAL, 2022 VS 2029
- Figure 12:
- VOLUME OF CASHEW MILK MARKET, METRIC TONNES, GLOBAL, 2017 - 2029
- Figure 13:
- VALUE OF CASHEW MILK MARKET, USD MN, GLOBAL, 2017 - 2029
- Figure 14:
- VALUE SHARE OF CASHEW MILK MARKET, BY DISTRIBUTION CHANNEL, %, GLOBAL, 2022 VS 2029
- Figure 15:
- VOLUME OF COCONUT MILK MARKET, METRIC TONNES, GLOBAL, 2017 - 2029
- Figure 16:
- VALUE OF COCONUT MILK MARKET, USD MN, GLOBAL, 2017 - 2029
- Figure 17:
- VALUE SHARE OF COCONUT MILK MARKET, BY DISTRIBUTION CHANNEL, %, GLOBAL, 2022 VS 2029
- Figure 18:
- VOLUME OF HAZELNUT MILK MARKET, METRIC TONNES, GLOBAL, 2017 - 2029
- Figure 19:
- VALUE OF HAZELNUT MILK MARKET, USD MN, GLOBAL, 2017 - 2029
- Figure 20:
- VALUE SHARE OF HAZELNUT MILK MARKET, BY DISTRIBUTION CHANNEL, %, GLOBAL, 2022 VS 2029
- Figure 21:
- VOLUME OF HEMP MILK MARKET, METRIC TONNES, GLOBAL, 2017 - 2029
- Figure 22:
- VALUE OF HEMP MILK MARKET, USD MN, GLOBAL, 2017 - 2029
- Figure 23:
- VALUE SHARE OF HEMP MILK MARKET, BY DISTRIBUTION CHANNEL, %, GLOBAL, 2022 VS 2029
- Figure 24:
- VOLUME OF OAT MILK MARKET, METRIC TONNES, GLOBAL, 2017 - 2029
- Figure 25:
- VALUE OF OAT MILK MARKET, USD MN, GLOBAL, 2017 - 2029
- Figure 26:
- VALUE SHARE OF OAT MILK MARKET, BY DISTRIBUTION CHANNEL, %, GLOBAL, 2022 VS 2029
- Figure 27:
- VOLUME OF SOY MILK MARKET, METRIC TONNES, GLOBAL, 2017 - 2029
- Figure 28:
- VALUE OF SOY MILK MARKET, USD MN, GLOBAL, 2017 - 2029
- Figure 29:
- VALUE SHARE OF SOY MILK MARKET, BY DISTRIBUTION CHANNEL, %, GLOBAL, 2022 VS 2029
- Figure 30:
- VOLUME OF NON-DAIRY MILK MARKET BY DISTRIBUTION CHANNEL, METRIC TONNES, GLOBAL, 2017 - 2029
- Figure 31:
- VALUE OF NON-DAIRY MILK MARKET BY DISTRIBUTION CHANNEL, USD MN, GLOBAL, 2017 - 2029
- Figure 32:
- VOLUME SHARE OF NON-DAIRY MILK MARKET, BY DISTRIBUTION CHANNEL , %, GLOBAL, 2017 VS 2023 VS 2029
- Figure 33:
- VALUE SHARE OF NON-DAIRY MILK MARKET, BY DISTRIBUTION CHANNEL , %, GLOBAL, 2017 VS 2023 VS 2029
- Figure 34:
- VOLUME OF NON-DAIRY MILK MARKET BY SUB DISTRIBUTION CHANNELS, METRIC TONNES, GLOBAL, 2017 - 2029
- Figure 35:
- VALUE OF NON-DAIRY MILK MARKET BY SUB DISTRIBUTION CHANNELS, USD MN, GLOBAL, 2017 - 2029
- Figure 36:
- VOLUME SHARE OF NON-DAIRY MILK MARKET, BY SUB DISTRIBUTION CHANNELS , %, GLOBAL, 2017 VS 2023 VS 2029
- Figure 37:
- VALUE SHARE OF NON-DAIRY MILK MARKET, BY SUB DISTRIBUTION CHANNELS , %, GLOBAL, 2017 VS 2023 VS 2029
- Figure 38:
- VOLUME OF NON-DAIRY MILK MARKET SOLD VIA CONVENIENCE STORES, METRIC TONNES, GLOBAL, 2017 - 2029
- Figure 39:
- VALUE OF NON-DAIRY MILK MARKET SOLD VIA CONVENIENCE STORES, USD MN, GLOBAL, 2017 - 2029
- Figure 40:
- VALUE SHARE OF NON-DAIRY MILK MARKET, SOLD VIA CONVENIENCE STORES, BY CATEGORY , %, GLOBAL, 2022 VS 2029
- Figure 41:
- VOLUME OF NON-DAIRY MILK MARKET SOLD VIA ONLINE RETAIL, METRIC TONNES, GLOBAL, 2017 - 2029
- Figure 42:
- VALUE OF NON-DAIRY MILK MARKET SOLD VIA ONLINE RETAIL, USD MN, GLOBAL, 2017 - 2029
- Figure 43:
- VALUE SHARE OF NON-DAIRY MILK MARKET, SOLD VIA ONLINE RETAIL, BY CATEGORY , %, GLOBAL, 2022 VS 2029
- Figure 44:
- VOLUME OF NON-DAIRY MILK MARKET SOLD VIA SPECIALIST RETAILERS, METRIC TONNES, GLOBAL, 2017 - 2029
- Figure 45:
- VALUE OF NON-DAIRY MILK MARKET SOLD VIA SPECIALIST RETAILERS, USD MN, GLOBAL, 2017 - 2029
- Figure 46:
- VALUE SHARE OF NON-DAIRY MILK MARKET, SOLD VIA SPECIALIST RETAILERS, BY CATEGORY , %, GLOBAL, 2022 VS 2029
- Figure 47:
- VOLUME OF NON-DAIRY MILK MARKET SOLD VIA SUPERMARKETS AND HYPERMARKETS, METRIC TONNES, GLOBAL, 2017 - 2029
- Figure 48:
- VALUE OF NON-DAIRY MILK MARKET SOLD VIA SUPERMARKETS AND HYPERMARKETS, USD MN, GLOBAL, 2017 - 2029
- Figure 49:
- VALUE SHARE OF NON-DAIRY MILK MARKET, SOLD VIA SUPERMARKETS AND HYPERMARKETS, BY CATEGORY , %, GLOBAL, 2022 VS 2029
- Figure 50:
- VOLUME OF NON-DAIRY MILK MARKET SOLD VIA OTHERS (WAREHOUSE CLUBS, GAS STATIONS, ETC.), METRIC TONNES, GLOBAL, 2017 - 2029
- Figure 51:
- VALUE OF NON-DAIRY MILK MARKET SOLD VIA OTHERS (WAREHOUSE CLUBS, GAS STATIONS, ETC.), USD MN, GLOBAL, 2017 - 2029
- Figure 52:
- VALUE SHARE OF NON-DAIRY MILK MARKET, SOLD VIA OTHERS (WAREHOUSE CLUBS, GAS STATIONS, ETC.), BY CATEGORY , %, GLOBAL, 2022 VS 2029
- Figure 53:
- VOLUME OF NON-DAIRY MILK MARKET SOLD VIA ON-TRADE, METRIC TONNES, GLOBAL, 2017 - 2029
- Figure 54:
- VALUE OF NON-DAIRY MILK MARKET SOLD VIA ON-TRADE, USD MN, GLOBAL, 2017 - 2029
- Figure 55:
- VALUE SHARE OF NON-DAIRY MILK MARKET, SOLD VIA ON-TRADE, BY CATEGORY , %, GLOBAL, 2022 VS 2029
- Figure 56:
- VOLUME OF NON-DAIRY MILK MARKET BY REGION, METRIC TONNES, GLOBAL, 2017 - 2029
- Figure 57:
- VALUE OF NON-DAIRY MILK MARKET BY REGION, USD MN, GLOBAL, 2017 - 2029
- Figure 58:
- VOLUME SHARE OF NON-DAIRY MILK MARKET, BY REGION , %, GLOBAL, 2017 VS 2023 VS 2029
- Figure 59:
- VALUE SHARE OF NON-DAIRY MILK MARKET, BY REGION , %, GLOBAL, 2017 VS 2023 VS 2029
- Figure 60:
- VOLUME OF NON-DAIRY MILK MARKET BY PRODUCT TYPE, METRIC TONNES, GLOBAL, 2017 - 2029
- Figure 61:
- VALUE OF NON-DAIRY MILK MARKET BY PRODUCT TYPE, USD MN, GLOBAL, 2017 - 2029
- Figure 62:
- VOLUME SHARE OF NON-DAIRY MILK MARKET BY PRODUCT TYPE, %, GLOBAL, 2017 VS 2023 VS 2029
- Figure 63:
- VALUE SHARE OF NON-DAIRY MILK MARKET BY PRODUCT TYPE, %, GLOBAL, 2017 VS 2023 VS 2029
- Figure 64:
- VOLUME OF NON-DAIRY MILK MARKET BY DISTRIBUTION CHANNEL, METRIC TONNES, AFRICA, 2017 - 2029
- Figure 65:
- VALUE OF NON-DAIRY MILK MARKET BY DISTRIBUTION CHANNEL, USD MN, AFRICA, 2017 - 2029
- Figure 66:
- VOLUME SHARE OF NON-DAIRY MILK MARKET, BY DISTRIBUTION CHANNEL , %, AFRICA, 2017 VS 2023 VS 2029
- Figure 67:
- VALUE SHARE OF NON-DAIRY MILK MARKET, BY DISTRIBUTION CHANNEL , %, AFRICA, 2017 VS 2023 VS 2029
- Figure 68:
- VOLUME OF NON-DAIRY MILK MARKET BY COUNTRY, METRIC TONNES, AFRICA, 2017 - 2029
- Figure 69:
- VALUE OF NON-DAIRY MILK MARKET BY COUNTRY, USD MN, AFRICA, 2017 - 2029
- Figure 70:
- VOLUME SHARE OF NON-DAIRY MILK MARKET, BY COUNTRY , %, AFRICA, 2017 VS 2023 VS 2029
- Figure 71:
- VALUE SHARE OF NON-DAIRY MILK MARKET, BY COUNTRY , %, AFRICA, 2017 VS 2023 VS 2029
- Figure 72:
- VOLUME OF NON-DAIRY MILK MARKET, METRIC TONNES, EGYPT, 2017 - 2029
- Figure 73:
- VALUE OF NON-DAIRY MILK MARKET, USD MN, EGYPT, 2017 - 2029
- Figure 74:
- VALUE SHARE OF NON-DAIRY MILK MARKET, BY CATEGORY , %, EGYPT, 2022 VS 2029
- Figure 75:
- VOLUME OF NON-DAIRY MILK MARKET, METRIC TONNES, NIGERIA, 2017 - 2029
- Figure 76:
- VALUE OF NON-DAIRY MILK MARKET, USD MN, NIGERIA, 2017 - 2029
- Figure 77:
- VALUE SHARE OF NON-DAIRY MILK MARKET, BY CATEGORY , %, NIGERIA, 2022 VS 2029
- Figure 78:
- VOLUME OF NON-DAIRY MILK MARKET, METRIC TONNES, SOUTH AFRICA, 2017 - 2029
- Figure 79:
- VALUE OF NON-DAIRY MILK MARKET, USD MN, SOUTH AFRICA, 2017 - 2029
- Figure 80:
- VALUE SHARE OF NON-DAIRY MILK MARKET, BY CATEGORY , %, SOUTH AFRICA, 2022 VS 2029
- Figure 81:
- VOLUME OF NON-DAIRY MILK MARKET, METRIC TONNES, REST OF AFRICA, 2017 - 2029
- Figure 82:
- VALUE OF NON-DAIRY MILK MARKET, USD MN, REST OF AFRICA, 2017 - 2029
- Figure 83:
- VALUE SHARE OF NON-DAIRY MILK MARKET, BY CATEGORY , %, REST OF AFRICA, 2022 VS 2029
- Figure 84:
- VOLUME OF NON-DAIRY MILK MARKET BY PRODUCT TYPE, METRIC TONNES, GLOBAL, 2017 - 2029
- Figure 85:
- VALUE OF NON-DAIRY MILK MARKET BY PRODUCT TYPE, USD MN, GLOBAL, 2017 - 2029
- Figure 86:
- VOLUME SHARE OF NON-DAIRY MILK MARKET BY PRODUCT TYPE, %, GLOBAL, 2017 VS 2023 VS 2029
- Figure 87:
- VALUE SHARE OF NON-DAIRY MILK MARKET BY PRODUCT TYPE, %, GLOBAL, 2017 VS 2023 VS 2029
- Figure 88:
- VOLUME OF NON-DAIRY MILK MARKET BY DISTRIBUTION CHANNEL, METRIC TONNES, ASIA-PACIFIC, 2017 - 2029
- Figure 89:
- VALUE OF NON-DAIRY MILK MARKET BY DISTRIBUTION CHANNEL, USD MN, ASIA-PACIFIC, 2017 - 2029
- Figure 90:
- VOLUME SHARE OF NON-DAIRY MILK MARKET, BY DISTRIBUTION CHANNEL , %, ASIA-PACIFIC, 2017 VS 2023 VS 2029
- Figure 91:
- VALUE SHARE OF NON-DAIRY MILK MARKET, BY DISTRIBUTION CHANNEL , %, ASIA-PACIFIC, 2017 VS 2023 VS 2029
- Figure 92:
- VOLUME OF NON-DAIRY MILK MARKET BY COUNTRY, METRIC TONNES, ASIA-PACIFIC, 2017 - 2029
- Figure 93:
- VALUE OF NON-DAIRY MILK MARKET BY COUNTRY, USD MN, ASIA-PACIFIC, 2017 - 2029
- Figure 94:
- VOLUME SHARE OF NON-DAIRY MILK MARKET, BY COUNTRY , %, ASIA-PACIFIC, 2017 VS 2023 VS 2029
- Figure 95:
- VALUE SHARE OF NON-DAIRY MILK MARKET, BY COUNTRY , %, ASIA-PACIFIC, 2017 VS 2023 VS 2029
- Figure 96:
- VOLUME OF NON-DAIRY MILK MARKET, METRIC TONNES, AUSTRALIA, 2017 - 2029
- Figure 97:
- VALUE OF NON-DAIRY MILK MARKET, USD MN, AUSTRALIA, 2017 - 2029
- Figure 98:
- VALUE SHARE OF NON-DAIRY MILK MARKET, BY CATEGORY , %, AUSTRALIA, 2022 VS 2029
- Figure 99:
- VOLUME OF NON-DAIRY MILK MARKET, METRIC TONNES, CHINA, 2017 - 2029
- Figure 100:
- VALUE OF NON-DAIRY MILK MARKET, USD MN, CHINA, 2017 - 2029
- Figure 101:
- VALUE SHARE OF NON-DAIRY MILK MARKET, BY CATEGORY , %, CHINA, 2022 VS 2029
- Figure 102:
- VOLUME OF NON-DAIRY MILK MARKET, METRIC TONNES, INDIA, 2017 - 2029
- Figure 103:
- VALUE OF NON-DAIRY MILK MARKET, USD MN, INDIA, 2017 - 2029
- Figure 104:
- VALUE SHARE OF NON-DAIRY MILK MARKET, BY CATEGORY , %, INDIA, 2022 VS 2029
- Figure 105:
- VOLUME OF NON-DAIRY MILK MARKET, METRIC TONNES, INDONESIA, 2017 - 2029
- Figure 106:
- VALUE OF NON-DAIRY MILK MARKET, USD MN, INDONESIA, 2017 - 2029
- Figure 107:
- VALUE SHARE OF NON-DAIRY MILK MARKET, BY CATEGORY , %, INDONESIA, 2022 VS 2029
- Figure 108:
- VOLUME OF NON-DAIRY MILK MARKET, METRIC TONNES, JAPAN, 2017 - 2029
- Figure 109:
- VALUE OF NON-DAIRY MILK MARKET, USD MN, JAPAN, 2017 - 2029
- Figure 110:
- VALUE SHARE OF NON-DAIRY MILK MARKET, BY CATEGORY , %, JAPAN, 2022 VS 2029
- Figure 111:
- VOLUME OF NON-DAIRY MILK MARKET, METRIC TONNES, MALAYSIA, 2017 - 2029
- Figure 112:
- VALUE OF NON-DAIRY MILK MARKET, USD MN, MALAYSIA, 2017 - 2029
- Figure 113:
- VALUE SHARE OF NON-DAIRY MILK MARKET, BY CATEGORY , %, MALAYSIA, 2022 VS 2029
- Figure 114:
- VOLUME OF NON-DAIRY MILK MARKET, METRIC TONNES, NEW ZEALAND, 2017 - 2029
- Figure 115:
- VALUE OF NON-DAIRY MILK MARKET, USD MN, NEW ZEALAND, 2017 - 2029
- Figure 116:
- VALUE SHARE OF NON-DAIRY MILK MARKET, BY CATEGORY , %, NEW ZEALAND, 2022 VS 2029
- Figure 117:
- VOLUME OF NON-DAIRY MILK MARKET, METRIC TONNES, PAKISTAN, 2017 - 2029
- Figure 118:
- VALUE OF NON-DAIRY MILK MARKET, USD MN, PAKISTAN, 2017 - 2029
- Figure 119:
- VALUE SHARE OF NON-DAIRY MILK MARKET, BY CATEGORY , %, PAKISTAN, 2022 VS 2029
- Figure 120:
- VOLUME OF NON-DAIRY MILK MARKET, METRIC TONNES, SOUTH KOREA, 2017 - 2029
- Figure 121:
- VALUE OF NON-DAIRY MILK MARKET, USD MN, SOUTH KOREA, 2017 - 2029
- Figure 122:
- VALUE SHARE OF NON-DAIRY MILK MARKET, BY CATEGORY , %, SOUTH KOREA, 2022 VS 2029
- Figure 123:
- VOLUME OF NON-DAIRY MILK MARKET, METRIC TONNES, REST OF ASIA PACIFIC, 2017 - 2029
- Figure 124:
- VALUE OF NON-DAIRY MILK MARKET, USD MN, REST OF ASIA PACIFIC, 2017 - 2029
- Figure 125:
- VALUE SHARE OF NON-DAIRY MILK MARKET, BY CATEGORY , %, REST OF ASIA PACIFIC, 2022 VS 2029
- Figure 126:
- VOLUME OF NON-DAIRY MILK MARKET BY PRODUCT TYPE, METRIC TONNES, GLOBAL, 2017 - 2029
- Figure 127:
- VALUE OF NON-DAIRY MILK MARKET BY PRODUCT TYPE, USD MN, GLOBAL, 2017 - 2029
- Figure 128:
- VOLUME SHARE OF NON-DAIRY MILK MARKET BY PRODUCT TYPE, %, GLOBAL, 2017 VS 2023 VS 2029
- Figure 129:
- VALUE SHARE OF NON-DAIRY MILK MARKET BY PRODUCT TYPE, %, GLOBAL, 2017 VS 2023 VS 2029
- Figure 130:
- VOLUME OF NON-DAIRY MILK MARKET BY DISTRIBUTION CHANNEL, METRIC TONNES, EUROPE, 2017 - 2029
- Figure 131:
- VALUE OF NON-DAIRY MILK MARKET BY DISTRIBUTION CHANNEL, USD MN, EUROPE, 2017 - 2029
- Figure 132:
- VOLUME SHARE OF NON-DAIRY MILK MARKET, BY DISTRIBUTION CHANNEL , %, EUROPE, 2017 VS 2023 VS 2029
- Figure 133:
- VALUE SHARE OF NON-DAIRY MILK MARKET, BY DISTRIBUTION CHANNEL , %, EUROPE, 2017 VS 2023 VS 2029
- Figure 134:
- VOLUME OF NON-DAIRY MILK MARKET BY COUNTRY, METRIC TONNES, EUROPE, 2017 - 2029
- Figure 135:
- VALUE OF NON-DAIRY MILK MARKET BY COUNTRY, USD MN, EUROPE, 2017 - 2029
- Figure 136:
- VOLUME SHARE OF NON-DAIRY MILK MARKET, BY COUNTRY , %, EUROPE, 2017 VS 2023 VS 2029
- Figure 137:
- VALUE SHARE OF NON-DAIRY MILK MARKET, BY COUNTRY , %, EUROPE, 2017 VS 2023 VS 2029
- Figure 138:
- VOLUME OF NON-DAIRY MILK MARKET, METRIC TONNES, BELGIUM, 2017 - 2029
- Figure 139:
- VALUE OF NON-DAIRY MILK MARKET, USD MN, BELGIUM, 2017 - 2029
- Figure 140:
- VALUE SHARE OF NON-DAIRY MILK MARKET, BY CATEGORY , %, BELGIUM, 2022 VS 2029
- Figure 141:
- VOLUME OF NON-DAIRY MILK MARKET, METRIC TONNES, FRANCE, 2017 - 2029
- Figure 142:
- VALUE OF NON-DAIRY MILK MARKET, USD MN, FRANCE, 2017 - 2029
- Figure 143:
- VALUE SHARE OF NON-DAIRY MILK MARKET, BY CATEGORY , %, FRANCE, 2022 VS 2029
- Figure 144:
- VOLUME OF NON-DAIRY MILK MARKET, METRIC TONNES, GERMANY, 2017 - 2029
- Figure 145:
- VALUE OF NON-DAIRY MILK MARKET, USD MN, GERMANY, 2017 - 2029
- Figure 146:
- VALUE SHARE OF NON-DAIRY MILK MARKET, BY CATEGORY , %, GERMANY, 2022 VS 2029
- Figure 147:
- VOLUME OF NON-DAIRY MILK MARKET, METRIC TONNES, ITALY, 2017 - 2029
- Figure 148:
- VALUE OF NON-DAIRY MILK MARKET, USD MN, ITALY, 2017 - 2029
- Figure 149:
- VALUE SHARE OF NON-DAIRY MILK MARKET, BY CATEGORY , %, ITALY, 2022 VS 2029
- Figure 150:
- VOLUME OF NON-DAIRY MILK MARKET, METRIC TONNES, NETHERLANDS, 2017 - 2029
- Figure 151:
- VALUE OF NON-DAIRY MILK MARKET, USD MN, NETHERLANDS, 2017 - 2029
- Figure 152:
- VALUE SHARE OF NON-DAIRY MILK MARKET, BY CATEGORY , %, NETHERLANDS, 2022 VS 2029
- Figure 153:
- VOLUME OF NON-DAIRY MILK MARKET, METRIC TONNES, RUSSIA, 2017 - 2029
- Figure 154:
- VALUE OF NON-DAIRY MILK MARKET, USD MN, RUSSIA, 2017 - 2029
- Figure 155:
- VALUE SHARE OF NON-DAIRY MILK MARKET, BY CATEGORY , %, RUSSIA, 2022 VS 2029
- Figure 156:
- VOLUME OF NON-DAIRY MILK MARKET, METRIC TONNES, SPAIN, 2017 - 2029
- Figure 157:
- VALUE OF NON-DAIRY MILK MARKET, USD MN, SPAIN, 2017 - 2029
- Figure 158:
- VALUE SHARE OF NON-DAIRY MILK MARKET, BY CATEGORY , %, SPAIN, 2022 VS 2029
- Figure 159:
- VOLUME OF NON-DAIRY MILK MARKET, METRIC TONNES, TURKEY, 2017 - 2029
- Figure 160:
- VALUE OF NON-DAIRY MILK MARKET, USD MN, TURKEY, 2017 - 2029
- Figure 161:
- VALUE SHARE OF NON-DAIRY MILK MARKET, BY CATEGORY , %, TURKEY, 2022 VS 2029
- Figure 162:
- VOLUME OF NON-DAIRY MILK MARKET, METRIC TONNES, UNITED KINGDOM, 2017 - 2029
- Figure 163:
- VALUE OF NON-DAIRY MILK MARKET, USD MN, UNITED KINGDOM, 2017 - 2029
- Figure 164:
- VALUE SHARE OF NON-DAIRY MILK MARKET, BY CATEGORY , %, UNITED KINGDOM, 2022 VS 2029
- Figure 165:
- VOLUME OF NON-DAIRY MILK MARKET, METRIC TONNES, REST OF EUROPE, 2017 - 2029
- Figure 166:
- VALUE OF NON-DAIRY MILK MARKET, USD MN, REST OF EUROPE, 2017 - 2029
- Figure 167:
- VALUE SHARE OF NON-DAIRY MILK MARKET, BY CATEGORY , %, REST OF EUROPE, 2022 VS 2029
- Figure 168:
- VOLUME OF NON-DAIRY MILK MARKET BY PRODUCT TYPE, METRIC TONNES, GLOBAL, 2017 - 2029
- Figure 169:
- VALUE OF NON-DAIRY MILK MARKET BY PRODUCT TYPE, USD MN, GLOBAL, 2017 - 2029
- Figure 170:
- VOLUME SHARE OF NON-DAIRY MILK MARKET BY PRODUCT TYPE, %, GLOBAL, 2017 VS 2023 VS 2029
- Figure 171:
- VALUE SHARE OF NON-DAIRY MILK MARKET BY PRODUCT TYPE, %, GLOBAL, 2017 VS 2023 VS 2029
- Figure 172:
- VOLUME OF NON-DAIRY MILK MARKET BY DISTRIBUTION CHANNEL, METRIC TONNES, MIDDLE EAST, 2017 - 2029
- Figure 173:
- VALUE OF NON-DAIRY MILK MARKET BY DISTRIBUTION CHANNEL, USD MN, MIDDLE EAST, 2017 - 2029
- Figure 174:
- VOLUME SHARE OF NON-DAIRY MILK MARKET, BY DISTRIBUTION CHANNEL , %, MIDDLE EAST, 2017 VS 2023 VS 2029
- Figure 175:
- VALUE SHARE OF NON-DAIRY MILK MARKET, BY DISTRIBUTION CHANNEL , %, MIDDLE EAST, 2017 VS 2023 VS 2029
- Figure 176:
- VOLUME OF NON-DAIRY MILK MARKET BY COUNTRY, METRIC TONNES, MIDDLE EAST, 2017 - 2029
- Figure 177:
- VALUE OF NON-DAIRY MILK MARKET BY COUNTRY, USD MN, MIDDLE EAST, 2017 - 2029
- Figure 178:
- VOLUME SHARE OF NON-DAIRY MILK MARKET, BY COUNTRY , %, MIDDLE EAST, 2017 VS 2023 VS 2029
- Figure 179:
- VALUE SHARE OF NON-DAIRY MILK MARKET, BY COUNTRY , %, MIDDLE EAST, 2017 VS 2023 VS 2029
- Figure 180:
- VOLUME OF NON-DAIRY MILK MARKET, METRIC TONNES, BAHRAIN, 2017 - 2029
- Figure 181:
- VALUE OF NON-DAIRY MILK MARKET, USD MN, BAHRAIN, 2017 - 2029
- Figure 182:
- VALUE SHARE OF NON-DAIRY MILK MARKET, BY CATEGORY , %, BAHRAIN, 2022 VS 2029
- Figure 183:
- VOLUME OF NON-DAIRY MILK MARKET, METRIC TONNES, KUWAIT, 2017 - 2029
- Figure 184:
- VALUE OF NON-DAIRY MILK MARKET, USD MN, KUWAIT, 2017 - 2029
- Figure 185:
- VALUE SHARE OF NON-DAIRY MILK MARKET, BY CATEGORY , %, KUWAIT, 2022 VS 2029
- Figure 186:
- VOLUME OF NON-DAIRY MILK MARKET, METRIC TONNES, OMAN, 2017 - 2029
- Figure 187:
- VALUE OF NON-DAIRY MILK MARKET, USD MN, OMAN, 2017 - 2029
- Figure 188:
- VALUE SHARE OF NON-DAIRY MILK MARKET, BY CATEGORY , %, OMAN, 2022 VS 2029
- Figure 189:
- VOLUME OF NON-DAIRY MILK MARKET, METRIC TONNES, QATAR, 2017 - 2029
- Figure 190:
- VALUE OF NON-DAIRY MILK MARKET, USD MN, QATAR, 2017 - 2029
- Figure 191:
- VALUE SHARE OF NON-DAIRY MILK MARKET, BY CATEGORY , %, QATAR, 2022 VS 2029
- Figure 192:
- VOLUME OF NON-DAIRY MILK MARKET, METRIC TONNES, SAUDI ARABIA, 2017 - 2029
- Figure 193:
- VALUE OF NON-DAIRY MILK MARKET, USD MN, SAUDI ARABIA, 2017 - 2029
- Figure 194:
- VALUE SHARE OF NON-DAIRY MILK MARKET, BY CATEGORY , %, SAUDI ARABIA, 2022 VS 2029
- Figure 195:
- VOLUME OF NON-DAIRY MILK MARKET, METRIC TONNES, UNITED ARAB EMIRATES, 2017 - 2029
- Figure 196:
- VALUE OF NON-DAIRY MILK MARKET, USD MN, UNITED ARAB EMIRATES, 2017 - 2029
- Figure 197:
- VALUE SHARE OF NON-DAIRY MILK MARKET, BY CATEGORY , %, UNITED ARAB EMIRATES, 2022 VS 2029
- Figure 198:
- VOLUME OF NON-DAIRY MILK MARKET, METRIC TONNES, REST OF MIDDLE EAST, 2017 - 2029
- Figure 199:
- VALUE OF NON-DAIRY MILK MARKET, USD MN, REST OF MIDDLE EAST, 2017 - 2029
- Figure 200:
- VALUE SHARE OF NON-DAIRY MILK MARKET, BY CATEGORY , %, REST OF MIDDLE EAST, 2022 VS 2029
- Figure 201:
- VOLUME OF NON-DAIRY MILK MARKET BY PRODUCT TYPE, METRIC TONNES, GLOBAL, 2017 - 2029
- Figure 202:
- VALUE OF NON-DAIRY MILK MARKET BY PRODUCT TYPE, USD MN, GLOBAL, 2017 - 2029
- Figure 203:
- VOLUME SHARE OF NON-DAIRY MILK MARKET BY PRODUCT TYPE, %, GLOBAL, 2017 VS 2023 VS 2029
- Figure 204:
- VALUE SHARE OF NON-DAIRY MILK MARKET BY PRODUCT TYPE, %, GLOBAL, 2017 VS 2023 VS 2029
- Figure 205:
- VOLUME OF NON-DAIRY MILK MARKET BY DISTRIBUTION CHANNEL, METRIC TONNES, NORTH AMERICA, 2017 - 2029
- Figure 206:
- VALUE OF NON-DAIRY MILK MARKET BY DISTRIBUTION CHANNEL, USD MN, NORTH AMERICA, 2017 - 2029
- Figure 207:
- VOLUME SHARE OF NON-DAIRY MILK MARKET, BY DISTRIBUTION CHANNEL , %, NORTH AMERICA, 2017 VS 2023 VS 2029
- Figure 208:
- VALUE SHARE OF NON-DAIRY MILK MARKET, BY DISTRIBUTION CHANNEL , %, NORTH AMERICA, 2017 VS 2023 VS 2029
- Figure 209:
- VOLUME OF NON-DAIRY MILK MARKET BY COUNTRY, METRIC TONNES, NORTH AMERICA, 2017 - 2029
- Figure 210:
- VALUE OF NON-DAIRY MILK MARKET BY COUNTRY, USD MN, NORTH AMERICA, 2017 - 2029
- Figure 211:
- VOLUME SHARE OF NON-DAIRY MILK MARKET, BY COUNTRY , %, NORTH AMERICA, 2017 VS 2023 VS 2029
- Figure 212:
- VALUE SHARE OF NON-DAIRY MILK MARKET, BY COUNTRY , %, NORTH AMERICA, 2017 VS 2023 VS 2029
- Figure 213:
- VOLUME OF NON-DAIRY MILK MARKET, METRIC TONNES, CANADA, 2017 - 2029
- Figure 214:
- VALUE OF NON-DAIRY MILK MARKET, USD MN, CANADA, 2017 - 2029
- Figure 215:
- VALUE SHARE OF NON-DAIRY MILK MARKET, BY CATEGORY , %, CANADA, 2022 VS 2029
- Figure 216:
- VOLUME OF NON-DAIRY MILK MARKET, METRIC TONNES, MEXICO, 2017 - 2029
- Figure 217:
- VALUE OF NON-DAIRY MILK MARKET, USD MN, MEXICO, 2017 - 2029
- Figure 218:
- VALUE SHARE OF NON-DAIRY MILK MARKET, BY CATEGORY , %, MEXICO, 2022 VS 2029
- Figure 219:
- VOLUME OF NON-DAIRY MILK MARKET, METRIC TONNES, UNITED STATES, 2017 - 2029
- Figure 220:
- VALUE OF NON-DAIRY MILK MARKET, USD MN, UNITED STATES, 2017 - 2029
- Figure 221:
- VALUE SHARE OF NON-DAIRY MILK MARKET, BY CATEGORY , %, UNITED STATES, 2022 VS 2029
- Figure 222:
- VOLUME OF NON-DAIRY MILK MARKET, METRIC TONNES, REST OF NORTH AMERICA, 2017 - 2029
- Figure 223:
- VALUE OF NON-DAIRY MILK MARKET, USD MN, REST OF NORTH AMERICA, 2017 - 2029
- Figure 224:
- VALUE SHARE OF NON-DAIRY MILK MARKET, BY CATEGORY , %, REST OF NORTH AMERICA, 2022 VS 2029
- Figure 225:
- VOLUME OF NON-DAIRY MILK MARKET BY PRODUCT TYPE, METRIC TONNES, GLOBAL, 2017 - 2029
- Figure 226:
- VALUE OF NON-DAIRY MILK MARKET BY PRODUCT TYPE, USD MN, GLOBAL, 2017 - 2029
- Figure 227:
- VOLUME SHARE OF NON-DAIRY MILK MARKET BY PRODUCT TYPE, %, GLOBAL, 2017 VS 2023 VS 2029
- Figure 228:
- VALUE SHARE OF NON-DAIRY MILK MARKET BY PRODUCT TYPE, %, GLOBAL, 2017 VS 2023 VS 2029
- Figure 229:
- VOLUME OF NON-DAIRY MILK MARKET BY DISTRIBUTION CHANNEL, METRIC TONNES, SOUTH AMERICA, 2017 - 2029
- Figure 230:
- VALUE OF NON-DAIRY MILK MARKET BY DISTRIBUTION CHANNEL, USD MN, SOUTH AMERICA, 2017 - 2029
- Figure 231:
- VOLUME SHARE OF NON-DAIRY MILK MARKET, BY DISTRIBUTION CHANNEL , %, SOUTH AMERICA, 2017 VS 2023 VS 2029
- Figure 232:
- VALUE SHARE OF NON-DAIRY MILK MARKET, BY DISTRIBUTION CHANNEL , %, SOUTH AMERICA, 2017 VS 2023 VS 2029
- Figure 233:
- VOLUME OF NON-DAIRY MILK MARKET BY COUNTRY, METRIC TONNES, SOUTH AMERICA, 2017 - 2029
- Figure 234:
- VALUE OF NON-DAIRY MILK MARKET BY COUNTRY, USD MN, SOUTH AMERICA, 2017 - 2029
- Figure 235:
- VOLUME SHARE OF NON-DAIRY MILK MARKET, BY COUNTRY , %, SOUTH AMERICA, 2017 VS 2023 VS 2029
- Figure 236:
- VALUE SHARE OF NON-DAIRY MILK MARKET, BY COUNTRY , %, SOUTH AMERICA, 2017 VS 2023 VS 2029
- Figure 237:
- VOLUME OF NON-DAIRY MILK MARKET, METRIC TONNES, ARGENTINA, 2017 - 2029
- Figure 238:
- VALUE OF NON-DAIRY MILK MARKET, USD MN, ARGENTINA, 2017 - 2029
- Figure 239:
- VALUE SHARE OF NON-DAIRY MILK MARKET, BY CATEGORY , %, ARGENTINA, 2022 VS 2029
- Figure 240:
- VOLUME OF NON-DAIRY MILK MARKET, METRIC TONNES, BRAZIL, 2017 - 2029
- Figure 241:
- VALUE OF NON-DAIRY MILK MARKET, USD MN, BRAZIL, 2017 - 2029
- Figure 242:
- VALUE SHARE OF NON-DAIRY MILK MARKET, BY CATEGORY , %, BRAZIL, 2022 VS 2029
- Figure 243:
- VOLUME OF NON-DAIRY MILK MARKET, METRIC TONNES, REST OF SOUTH AMERICA, 2017 - 2029
- Figure 244:
- VALUE OF NON-DAIRY MILK MARKET, USD MN, REST OF SOUTH AMERICA, 2017 - 2029
- Figure 245:
- VALUE SHARE OF NON-DAIRY MILK MARKET, BY CATEGORY , %, REST OF SOUTH AMERICA, 2022 VS 2029
- Figure 246:
- MOST ACTIVE COMPANIES BY NUMBER OF STRATEGIC MOVES, COUNT, GLOBAL, 2017 - 2029
- Figure 247:
- MOST ADOPTED STRATEGIES, COUNT, GLOBAL, 2017 - 2029
- Figure 248:
- VALUE SHARE OF MAJOR PLAYERS, %, GLOBAL
Non-Dairy Milk Industry Segmentation
Almond Milk, Cashew Milk, Coconut Milk, Hazelnut Milk, Hemp Milk, Oat Milk, Soy Milk are covered as segments by Product Type. Off-Trade, On-Trade are covered as segments by Distribution Channel. Africa, Asia-Pacific, Europe, Middle East, North America, South America are covered as segments by Region.| Product Type | Almond Milk | ||
| Cashew Milk | |||
| Coconut Milk | |||
| Hazelnut Milk | |||
| Hemp Milk | |||
| Oat Milk | |||
| Soy Milk | |||
| Distribution Channel | Off-Trade | Convenience Stores | |
| Online Retail | |||
| Specialist Retailers | |||
| Supermarkets and Hypermarkets | |||
| Others (Warehouse clubs, gas stations, etc.) | |||
| On-Trade | |||
| Region | Africa | By Product Type | |
| By Distribution Channel | |||
| Egypt | |||
| Nigeria | |||
| South Africa | |||
| Rest of Africa | |||
| Asia-Pacific | By Product Type | ||
| By Distribution Channel | |||
| Australia | |||
| China | |||
| India | |||
| Indonesia | |||
| Japan | |||
| Malaysia | |||
| New Zealand | |||
| Pakistan | |||
| South Korea | |||
| Rest of Asia Pacific | |||
| Europe | By Product Type | ||
| By Distribution Channel | |||
| Belgium | |||
| France | |||
| Germany | |||
| Italy | |||
| Netherlands | |||
| Russia | |||
| Spain | |||
| Turkey | |||
| United Kingdom | |||
| Rest of Europe | |||
| Middle East | By Product Type | ||
| By Distribution Channel | |||
| Bahrain | |||
| Kuwait | |||
| Oman | |||
| Qatar | |||
| Saudi Arabia | |||
| United Arab Emirates | |||
| Rest of Middle East | |||
| North America | By Product Type | ||
| By Distribution Channel | |||
| Canada | |||
| Mexico | |||
| United States | |||
| Rest of North America | |||
| South America | By Product Type | ||
| By Distribution Channel | |||
| Argentina | |||
| Brazil | |||
| Rest of South America | |||
Need A Different Region or Segment?
Customize Now
Market Definition
- Dairy Alternatives - Dairy alternatives are foods that are made from plant-based milk/oils instead of their usual animal products, such as cheese, butter, milk, ice cream, yogurt, etc. Plant-based or non-dairy milk alternative is the fast-growing segment in the newer food product development category of functional and specialty beverage across the globe.
- Non-Dairy Butter - Non dairy butter is a vegan butter alternative that is made from a mixture of plant oils. With an increase in alternative diets like vegetarianism, veganism, and gluten intolerance, plant butter is a healthy non-dairy substitute for normal butter.
- Non-Dairy Ice Cream - Plant based ice cream is a growing category. Non-dairy ice cream is a type of dessert made without any animal ingredients. This is typically considered a substitute for regular ice cream for those who cannot or do not eat animal or animal-derived products, including eggs, milk, cream, or honey.
- Plant-Based Milk - Plant based milks are milk substitutes that are made from nuts (e.g., hazelnuts, hemp seeds), seeds (e.g., sesame, walnuts, coconuts, cashews, almonds, rice, oats, etc.) or legumes (e.g., soy). Plant-based milk such as soy milk and almond milk have been popular in East Asia and the Middle East for centuries.
| Keyword | Definition |
|---|---|
| Cultured Butter | Cultured butter is prepared by having the raw butter go through chemical processing and has been added with certain emulsifiers and foreign ingredients. |
| Uncultured Butter | This type of butter is one which has not been processed in any way |
| Natural Cheese | The type of cheese in its most natural form. It is made from natural and simple products and ingredients, including fresh and natural salts, natural colors, enzymes, and high-quality milk. |
| Processed Cheese | Processed cheese undergoes the same processes as natural cheese; however, it requires more steps and many different forms of ingredients. Making processed cheese involves melting natural cheese, emulsifying it, and adding preservatives and other artificial ingredients or colorings. |
| Single Cream | Single cream contains around 18% fat. It’s a single layer of cream that appears over boiled milk. |
| Double Cream | Double cream contains 48% fat, more than double the amount of fat of single cream. It’s heavier and thicker than single cream |
| Whipping Cream | This has a much higher fat percentage than single cream (36%). Used to top cakes, pies, and puddings and as a thickener for sauces, soups, and fillings. |
| Frozen Desserts | Desserts that are meant to be eaten in frozen condition. E.g., sherbets, sorbets, frozen yogurts |
| UHT Milk (Ultra-high temperature milk) | Milk heated at a very high temperature. Ultra-high-temperature processing (UHT) of milk involves heating for 1–8 sec at 135–154°C. which kills the spore-forming pathogenic microorganism, resulting in a product with a shelf-life of several months. |
| Non-dairy butter/Plant-based butter | Butter made from plant-derived oil such as coconut, palm, etc. |
| Non-dairy Yogurt | Yogurt made from typically made from nuts, like almonds, cashews, coconuts, and even other foods like soybeans, plantains, oats, and peas |
| On-trade | It refers to restaurants, QSRs, and bars. |
| Off-trade | It refers to supermarkets, hypermarkets, on-line channels, etc. |
| Neufchatel cheese | One of the oldest kinds of cheese in France. It is a soft, slightly crumbly, mold-ripened, bloomy-rind cheese made in the Neufchâtel-en-Bray region of Normandy. |
| Flexitarian | It refers to a consumer preferring a semi-vegetarian diet, that is centered on plant foods with limited or occasional inclusion of meat. |
| Lactose Intolerance | Lactose intolerance is a reaction in digestive system to lactose, the sugar in milk. It causes uncomfortable symptoms in response to the consumption of dairy products. |
| Cream Cheese | Cream cheese is a soft and creamy fresh cheese with a tangy taste made from milk and cream. |
| Sorbets | Sorbet is a frozen dessert made using ice combined with fruit juice, fruit purée, or other ingredients, such as wine, liqueur, or honey. |
| Sherbet | Sherbet is a sweetened frozen dessert made with fruit and some sort of dairy product such as milk or cream. |
| Shelf stable | Foods that can be safely stored at room temperature, or "on the shelf," for at least one year and do not have to be cooked or refrigerated to eat safely. |
| DSD | Direct Store Delivery is the process in supply chain management wherein the product is delivered from manufacturing plant directly to the retailer. |
| OU Kosher | Orthodox Union Kosher is a kosher certification agency based in New York City. |
| Gelato | Gelato is a frozen creamy dessert made with milk, heavy cream and sugar. |
| Grass-fed Cows | Grass-fed cows are allowed to graze in pastures, where they eat a variety of grasses and clover. |
Need More Details on Market Definition?
Ask a Question
Research Methodology
Mordor Intelligence follows a four-step methodology in all our reports.
- Step-1: Identify Key Variables: In order to build a robust forecasting methodology, the variables and factors identified in Step 1 are tested against available historical market numbers. Through an iterative process, the variables required for market forecast are set, and the model is built on the basis of these variables.
- Step-2: Build a Market Model: Market-size estimations for the forecast years are in nominal terms. Inflation is not a part of the pricing, and the average selling price (ASP) is kept constant throughout the forecast period for each country.
- Step-3: Validate and Finalize: In this important step, all market numbers, variables, and analyst calls are validated through an extensive network of primary research experts from the market studied. The respondents are selected across levels and functions to generate a holistic picture of the market studied.
- Step-4: Research Outputs: Syndicated Reports, Custom Consulting Assignments, Databases & Subscription Platforms

Get More Details On Research Methodology
Download PDF


