
Market Overview
| Study Period | 2020 - 2031 |
|---|---|
| Market Size (2026) | USD 15.82 Billion |
| Market Size (2031) | USD 20.02 Billion |
| Growth Rate (2026 - 2031) | 4.80 % |
| Fastest Growing Market | Asia Pacific |
| Largest Market | North America |
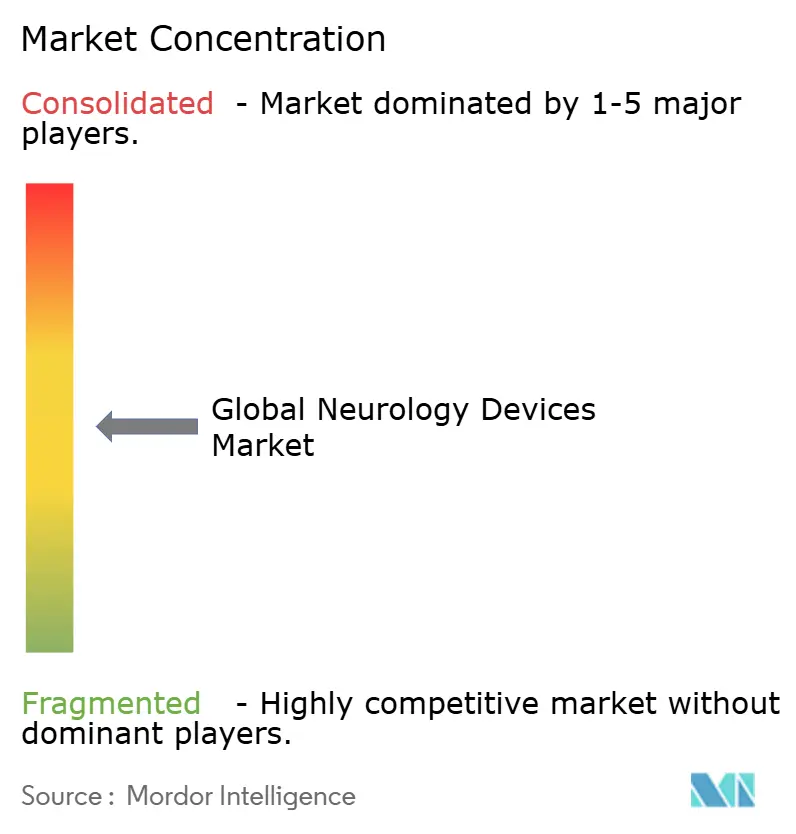
| Market Concentration | Medium |
Major Players *Disclaimer: Major Players sorted in no particular order Image © Mordor Intelligence. Reuse requires attribution under CC BY 4.0. | |
Neurology Devices Market Analysis by Mordor Intelligence
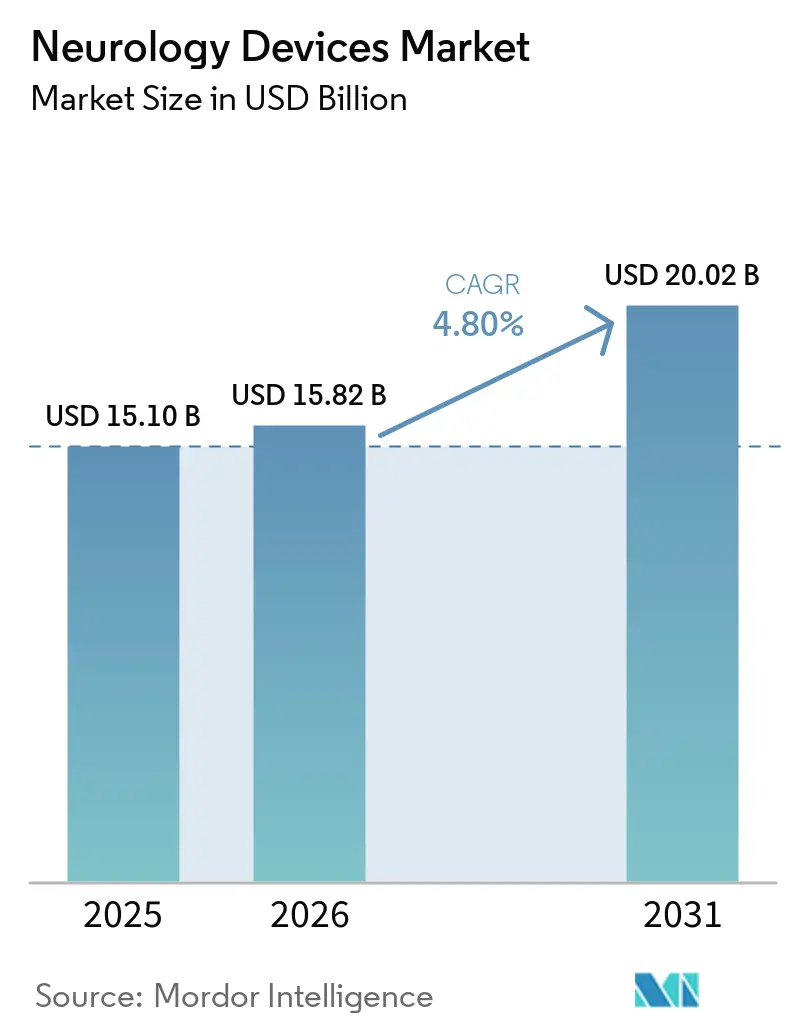
The Neurology Devices Market size is projected to expand from USD 15.10 billion in 2025 and USD 15.82 billion in 2026 to USD 20.02 billion by 2031, registering a CAGR of 4.80% between 2026 and 2031.
Growth reflects a shift from episodic, hospital-centric interventions to data-rich, predictive care models powered by artificial intelligence and closed-loop neuro-stimulation systems. Demand widens as stroke, Parkinson’s disease, epilepsy and chronic pain remain high-priority public-health issues, and as aging populations intensify the neurological disease burden. Capital inflows, accelerated FDA clearances for adaptive stimulators and breakthroughs in mechanical thrombectomy catheters add momentum, while reimbursement code updates for closed-loop devices reduce payer friction in key markets. Conversely, supply-chain risks around rare-earth magnets and bismuth alloys, together with surgeon shortages in low- and middle-income countries, temper the Neurology Devices market’s full potential.
Key Report Takeaways
- By device type, interventional neurology led with 38.45% Neurology Devices market share in 2025, whereas neuro-rehabilitation & wearables are expected to post the fastest 5.18% CAGR through 2031.
- By application, stroke management accounted for 43.88% of the Neurology Devices market size in 2025; epilepsy treatment is projected to expand at a 5.66% CAGR to 2031.
- By end user, hospitals held 60.49% Neurology Devices market share in 2025, while home-care settings are expected to register a 6.17% CAGR through 2031.
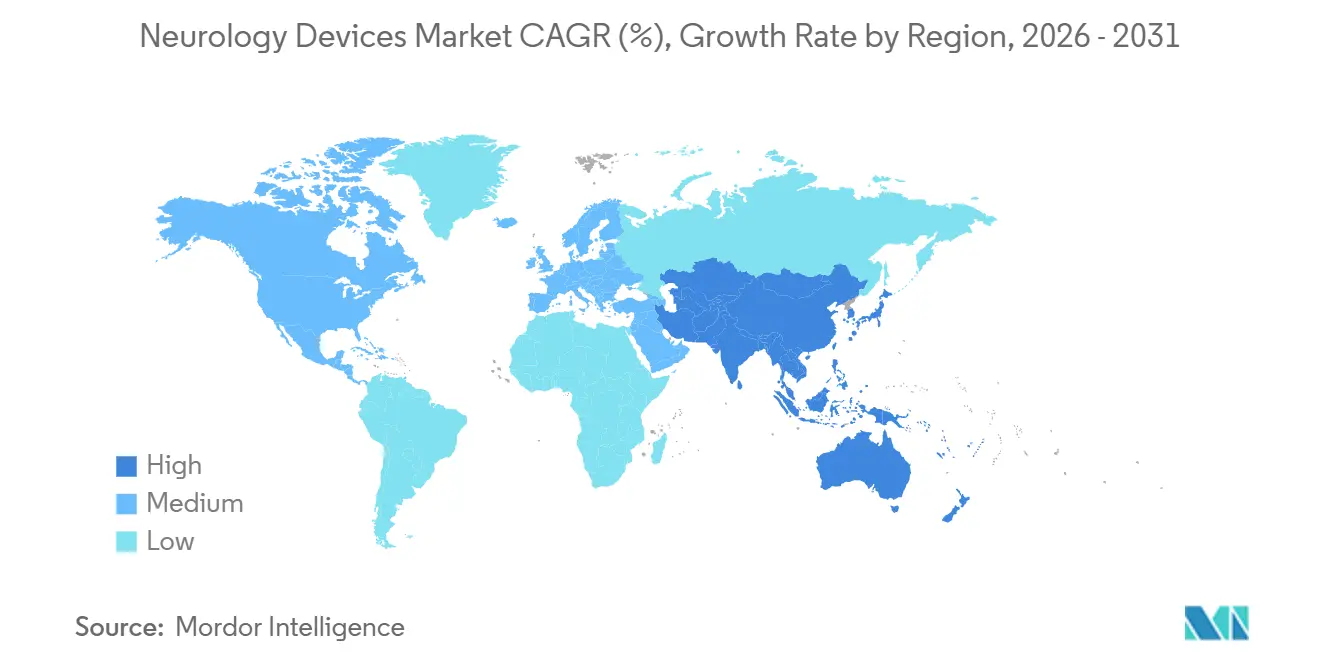
- By geography, North America commanded 40.27% revenue share in 2025; Asia-Pacific is set to climb at a 6.92% CAGR over the forecast horizon.
Note: Market size and forecast figures in this report are generated using Mordor Intelligence’s proprietary estimation framework, updated with the latest available data and insights as of 2026.
Market Trends and Insights
Drivers Impact Analysis of Neurology Devices Market*
| Driver | (~) % Impact on CAGR Forecast | Geographic Relevance | Impact Timeline |
|---|---|---|---|
| Rising prevalence of neuro-vascular & neuro-degenerative disorders | +1.2% | Global, highest in North America, Europe, Japan | Long term (≥ 4 years) |
| Technological advances in minimally invasive & image-guided devices | +0.9% | North America & EU leading; APAC adoption accelerating | Medium term (2–4 years) |
| Expanding healthcare spend & neuro-rehab reimbursement schemes | +0.7% | North America & EU core; selective APAC markets | Medium term (2–4 years) |
| AI-enabled closed-loop neuro-stimulation platforms | +0.8% | Global; early adoption in US, Germany, China | Short term (≤ 2 years) |
| Wearable EEG & at-home neuro-monitoring | +0.6% | Global; strong in telehealth-ready markets | Short term (≤ 2 years) |
| Remote-care pilots in neuromodulation | +0.4% | China, Japan; spill-over to emerging markets | Medium term (2–4 years) |
| Source: Mordor Intelligence | |||
Rising Prevalence of Neuro-vascular & Neuro-degenerative Disorders
Neurological conditions now affect 43% of the global population, expanding the addressable pool for therapeutic devices. . Stroke remains paramount: large-vessel occlusions represent up to 40% of ischemic cases and demand rapid thrombectomy solutions. Post-viral neurological sequelae following COVID-19 and other pathogens further elevate device utilization. Given these epidemiologic realities, the Neurology Devices market continues to prioritise high-efficacy interventions and scalable chronic-disease monitoring strategies.
Technological Advances in Minimally Invasive & Image-Guided Devices
Fourth-generation aspiration catheters, steerable micro-catheters and 300 mT/m gradient MRI scanners shorten procedure time and elevate diagnostic precision. Real-time algorithms embedded in thrombectomy devices improve first-pass success and reduce downstream costs. Interplay of robotics, augmented reality and AI prompts faster learning curves for neurosurgeons, helping address workforce deficits. By raising clinical thresholds, technology upgrades consolidate share for R&D-intensive firms and reinforce entry barriers, affecting long-tail suppliers in the Neurology Devices industry.
Expanding Healthcare Spend & Neuro-rehab Reimbursement Schemes
The United States earmarks 40% of global medical-device spend, with 2025 coding changes (CPT 0735T, 0736T) explicitly covering adaptive stimulators and pulsed RF ablation. Europe’s Diagnosis-Related Group refinements boost post-stroke rehabilitation reimbursement, while Japan’s National Health Insurance now funds home EEG kits. Yet payers cap coverage for emerging modalities such as taVNS, signalling the need for stronger health-economic dossiers. As a result, commercial traction hinges on demonstrable cost offsets, not only technical novelty, within the Neurology Devices market.
Wearable EEG & At-Home Neuro-monitoring Creating New Outpatient Revenue
Miniaturised earbud EEG sensors record data continuously over 24 hours to identify subclinical seizures, reducing inpatient telemetry days by 28% and freeing capacity for acute cases [1]. Commercial payers in the US reimburse remote EEG reviews at USD 125 per session, creating annuity-style revenue. In Europe and Australia, tele-neurology platforms integrate cloud analytics for early relapse warnings in multiple-sclerosis patients. Consequently, device makers diversify into software-as-a-service, blurring lines between hardware sales and digital-health subscriptions in the Neurology Devices market.
Restraints Impact Analysis of Neurology Devices Market*
| Restraint | (~) % Impact on CAGR Forecast | Geographic Relevance | Impact Timeline |
|---|---|---|---|
| High device & procedure cost burden | -0.8% | Global; acute in emerging markets | Long term (≥ 4 years) |
| Lengthy & complex regulatory approval cycles | -0.6% | Global; jurisdiction-dependent | Medium term (2–4 years) |
| Shortage of interventional neuro-surgeons | -0.5% | Africa, Southeast Asia | Long term (≥ 4 years) |
| Supply-chain risk for rare-earth materials | -0.3% | Global; China-centric sourcing | Short term (≤ 2 years) |
| Source: Mordor Intelligence | |||
High Device & Procedure Cost Burden
Spinal cord stimulation implants cost USD 35,000–70,000, while revisions add USD 15,000-25,000, limiting penetration among under-insured cohorts Journal of Pain Research. Explant rates hover near 10% owing mainly to efficacy loss, raising total-cost-of-ownership anxieties. In India, detachable coils for aneurysm repair attract import duties of 10%, compounding affordability hurdles MD+DI. Such cost vectors slow adoption despite clinical need.
Lengthy & Complex Regulatory Approval Cycles
Class-III neuro devices may spend 180-365 days in premarket review, extending cash-burn periods for innovators Greenlight Guru. Europe’s MDR elongates time-to-market further through mandatory clinical-benefit demonstration and post-market surveillance audits. Small firms without predicate devices face disproportionate delays, tilting competitive advantage toward established multinationals within the Neurology Devices industry.
*Our forecasts treat driver/restraint impacts as directional, not additive. The impact forecasts reflect baseline growth, mix effects, and variable interactions.
Neurology Devices Market Segment Analysis
By Device Type:
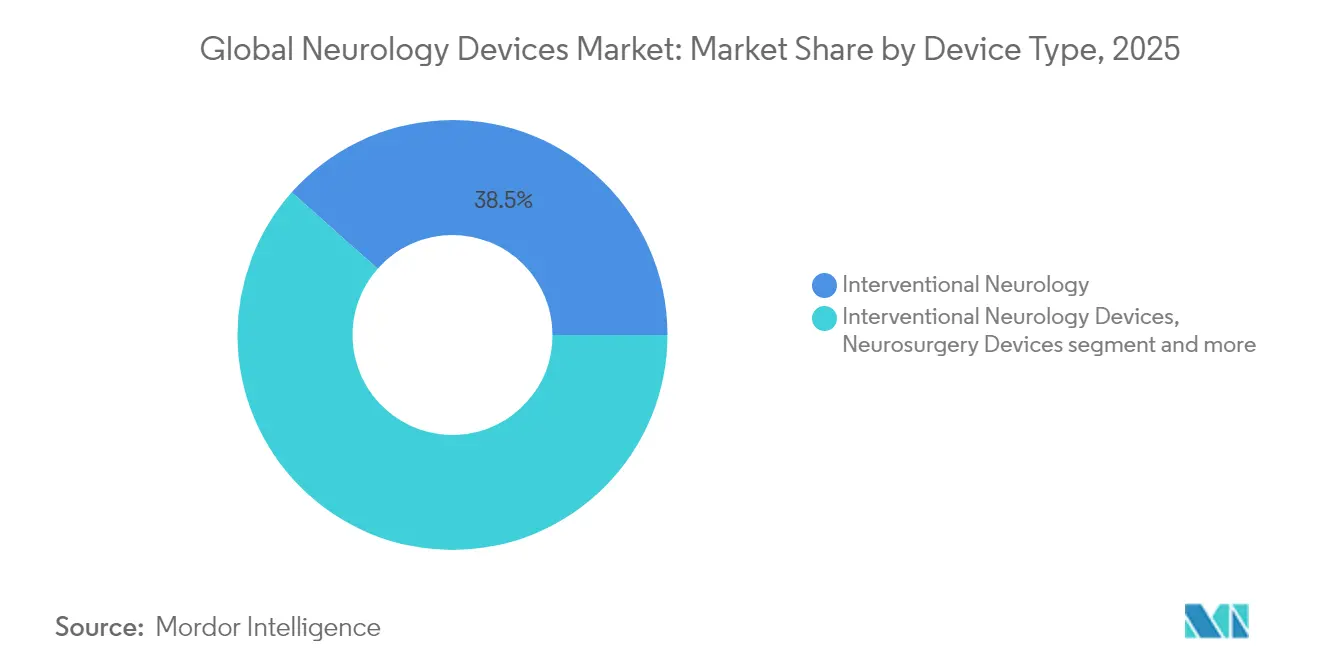
Interventional Neurology Dominates Despite Rehabilitation SurgeInterventional systems captured 38.45% Neurology Devices market share in 2025 as mechanical thrombectomy and flow-diverter implants became standard of care for acute ischemic stroke. Data from the EXCELLENT registry showed final reperfusion rates of 94.5% with the EMBOTRAP retriever, reinforcing physician confidence. Neurodiagnostic monitors, cerebrospinal-fluid shunts and neuro-stimulation implants collectively anchor hospital procurement budgets, while platform upgrades, such as steerable micro-catheters, keep capital-replacement cycles brisk.
Rehabilitation & wearable devices, posting a 5.18% CAGR, increasingly enable post-operative and chronic-disease monitoring at home. In-ear EEG wearables capture seizure precursors, reducing emergency admissions and widening recurring-service revenue. Competitive barriers here hinge on data-analytics IP rather than hardware, inviting tech entrants. Consequently, incumbent catheter and shunt suppliers diversify portfolios to hedge against slower growth in mature theatre-based products.

By Application:
Stroke Management Leadership Challenged by Epilepsy InnovationStroke care remained pivotal, accounting for 43.88% of the Neurology Devices market size in 2025 through widespread reimbursement of thrombectomy and aspiration catheters. Stanford’s milli-spinner device achieved >90% clot-removal success, illustrating ongoing advances that anchor this segment’s revenue. Yet procedure volumes hinge on rapid hospital arrival, prompting parallel investment in ambulance-based CT scanners.
Epilepsy therapies grow fastest at 5.66% CAGR, powered by adaptive deep-brain stimulators and responsive neuro-stimulation implants that tailor pulses to real-time cortical signals. Broader FDA approvals and home EEG diagnostics expand candidacy pools beyond refractory cases, threatening to narrow stroke’s dominance over the projection period.
By End User:
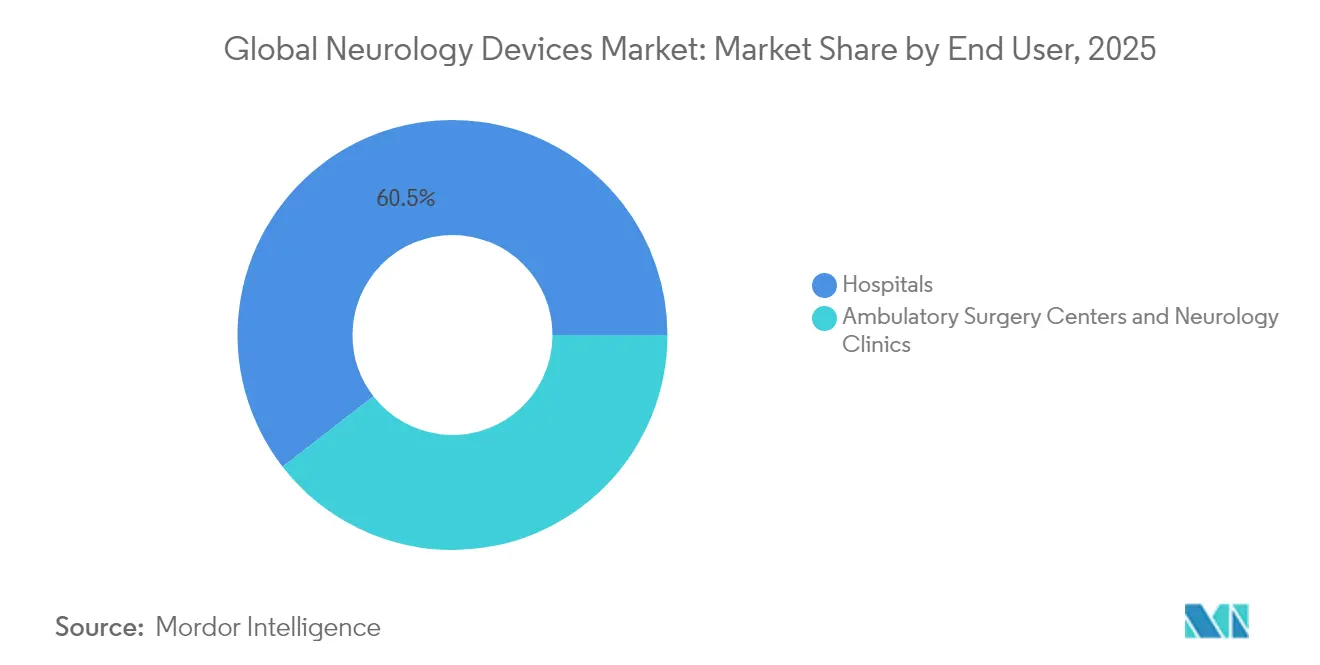
Hospital Dominance Erodes as Home-care Gains MomentumHospitals held 60.49% Neurology Devices market share in 2025, underpinned by operating-room infrastructure and intensive-care monitoring needs. Complex interventions, from aneurysm clipping to spinal cord stimulator implantation, still require inpatient settings and multi-disciplinary teams.
Home-care, rising at a 6.17% CAGR, leverages wearable EEG patches and portable rTMS helmets weighing 3 kg, enabling therapy during daily activities Nature Communications. Medicare’s remote-physiologic-monitoring codes reimburse EEG data reviews, improving commercial viability. As device usability improves, the Neurology Devices market progressively decouples volume growth from brick-and-mortar facilities.
Geography Analysis
North America Neurology Devices Market
North America led revenue with 40.27% share in 2025 on the back of robust payer coverage, highly skilled neurologists and R&D ecosystems. Canada’s single-payer model funds nationwide closed-loop SCS trials, while Mexico accelerates MRI procurement via public-private partnerships.
APAC Neurology Devices Market
Asia-Pacific posts the quickest 6.92% CAGR, propelled by China’s BCI roadmap and Japan’s remote-care pilots. Government grants subsidise domestic flow-diverter manufacturing, reducing import reliance and bolstering local champions. India logs double-digit growth in detachable-coil sales as its ageing cohort expands, although affordability gaps persist.
Europe Neurology Devices Market
Europe remains a steady contributor, emphasising clinical-value demonstration under Medical Device Regulation. Germany’s rising hydrocephalus incidence fuels shunt demand, whereas the United Kingdom pilots AI-triaged stroke pathways that may scale continent-wide. Meanwhile, Switzerland’s potential recognition of FDA approvals streamlines dual-market launches, benefiting US-centric manufacturers.
Regulatory Landscape
Neurology devices span Class II and Class III risk levels, and many neurostimulation and drug-device combination products require multi-center review plus post-market obligations. In the United States, the FDA Office of Combination Products determines primary jurisdiction using Primary Mode of Action (PMOA) under 21 CFR Part 3, coordinating reviews across CDRH, CDER, and CBER as applicable to neurotherapeutic combinations.
In Europe, EU Regulation 2017/745 (MDR) continues to shape approvals and lifecycle compliance, including Article 117 requirements for Notified Body input when a medicinal product incorporates a medical device as an integral part, with EMA coordination through its Combination Products Operational Group (COMBO). Compliance expectations also tighten through standard updates: ISO 20417:2026 (manufacturer-supplied information) published in March 2026 and ISO 10993-6:2026 (local effects after implantation) published in April 2026 affect labeling and implant biocompatibility evidence for neurological implants and related materials.
Value Chain Analysis
The neurology devices value chain begins with specialized inputs (implant-grade polymers and metals, rare-earth components for certain implanted systems, semiconductors, sensors, and sterile packaging), and then moves through design controls, verification/validation, and regulated manufacturing under ISO 13485-aligned quality systems. Sterilization and final release follow, and channel execution relies on clinical education and procedure support in hospitals as well as ambulatory settings. Neuro-rehabilitation and monitoring add further requirements as software-enabled services become part of remote review and longitudinal data management.
Compliance and supply continuity are major gating points. Combination-product governance adds process overhead because manufacturers must align PMOA-driven FDA review pathways with dual quality requirements (device quality systems plus drug cGMP for relevant combinations), and EU MDR workflows can require Notified Body capacity for device constituents. On the supply side, 2025 cost pressure from tariff exposure and long lead times for components such as semiconductors and packaging materials has increased interest in more resilient sourcing footprints, with manufacturers that have meaningful US-based production citing lower tariff sensitivity than peers reliant on imported components.
Competitive Landscape
The Neurology Devices market remains moderately fragmented as the key players hold around half of the total revenue. Medtronic leads neuro-stimulation and stroke intervention, reinforced by the FDA’s first adaptive DBS approval in 2025. Stryker’s USD 4.9 billion takeover of Inari Medical strengthens its vascular-device continuum, adding FlowTriever to its clot-removal suite[2]. Globus Medical’s USD 250 million Nevro purchase delivers pain-therapy scale and closed-loop IP MedTech Dive.
Strategic alliances increasingly blend imaging, AI and hardware. Philips partners with Nvidia to embed neural-network accelerators in BlueSeal MRI scanners, cutting scan time and improving triage accuracy MedTech Dive. GE HealthCare pushes head-only MRI systems with asymmetrical gradient coils for 50% higher neuro-resolution GE HealthCare. Venture funding remains buoyant: neurotech startups secured USD 2.3 billion across 129 deals in 2024, signalling investor appetite for white-space plays in adaptive stimulation and brain–computer interfaces Neurotechnology.
Smaller firms specialise: Imperative Care focuses on Zoom aspiration catheters, Synchron advances endovascular BCIs, and Cerenovus refines aspiration catheter geometry. To compete, incumbents extend service layers such as remote programming and predictive analytics, forging sticky ecosystems. Intellectual-property estates, regulatory muscle and health-economic validation together shape durable advantage in the evolving Neurology Devices industry.
Neurology Devices Industry Leaders
-
Boston Scientific Corporation
-
Stryker Corporation
-
B. Braun Melsungen AG
-
Medtronic PLC
-
Abbott Laboratories
- *Disclaimer: Major Players sorted in no particular order
Neurology Devices Market Companies Covered in this Report
- Abbott Laboratories
- B. Braun
- Boston Scientific
- Cochlear
- GE Healthcare
- Inari Medical
- Integra LifeSciences
- Johnson & Johnson (CERENOVUS)
- LivaNova
- Medtronic
- MicroPort
- Natus Medical
- Neuronetics
- Nevro
- Penumbra
- Koninklijke Philips
- Siemens Healthineers
- Stryker
- Terumo
- Zimmer Biomet
Market Opportunities and Future Outlook
Quality-system harmonization and traceability upgrades create near-term whitespace for suppliers that can reduce regulatory burden for neurology OEMs and combination-product developers. The FDA Quality Management System Regulation (QMSR), effective February 2026 and incorporating ISO 13485:2016 concepts, pushes manufacturers to modernize quality processes across design controls, suppliers, and post-market feedback loops, which is particularly relevant for closed-loop neurostimulation, wearable EEG, and other data-rich systems. Alongside this, the FDA issued draft guidance in June 2025 on Unique Device Identifier (UDI) expectations for combination products, raising the bar for labeling, GUDID readiness, and end-to-end traceability across device constituents.
Technology opportunities concentrate where device platforms intersect with targeted delivery and sensing. Work on stimuli-responsive nanoplatforms and other blood-brain barrier strategies supports a pipeline of neurological device-drug combinations that pair physical stimuli (magnetic, electrical, ultrasound, or light-driven modalities) with localized delivery concepts. This fits the report's emphasis on predictive care models and closed-loop therapies, and it increases the need for partnering across materials science, sensor and implant manufacturing, and regulated software infrastructure for longitudinal monitoring and therapy titration.
Recent Industry Developments in Neurology Devices Market
- March 2026: Medtronic received FDA 510(k) clearance for the Stealth AXiS surgical system for cranial and ENT procedures. The clearance strengthens Medtronic's cranial navigation and stereotaxy toolset, supporting procedure standardization and workflow integration in neurosurgical suites.
- February 2025: Medtronic earned US FDA approval for its BrainSense Adaptive deep brain stimulation system for people with Parkinson's disease. This regulatory milestone advances sensing-enabled, therapy-adjusting DBS and reinforces competitive differentiation in implantable neuromodulation.
- November 2024: GE HealthCare received FDA 510(k) clearance for the SIGNA MAGNUS head-only MRI system with high-gradient performance. The clearance broadens access to dedicated neuroimaging platforms that can improve diagnostic throughput and triage in neurology-heavy care pathways.
Neurology Devices Market Report Scope and Research Methodology
Market Definition and Coverage
For this study, the neurology devices market covers revenues from new, finished medical devices used to prevent, diagnose, monitor, or treat central and peripheral nervous system disorders in clinical care settings.
Scope exclusions: We exclude disposable consumables, imaging reagents, and software-only analytics that are not sold as part of a neurology device system.
Segments Covered in This Report
- By Device Type
- Neurostimulation Devices
- Interventional Neurology Devices
- Neurosurgery Devices
- Cerebrospinal Fluid Management Devices
- Neurodiagnostic & Monitoring Devices
- Neuro-rehabilitation & Wearables
- By Application
- Stroke Management
- Chronic Pain & Movement Disorders
- Epilepsy
- Neurodegenerative Diseases
- Traumatic Brain & Spinal Injuries
- Other Applications
- By End User
- Hospitals
- Ambulatory Surgery Centers
- Neurology and Specialty Clinics
- Homecare Settings
- Other End Users
- By Geography
- North America
- United States
- Canada
- Mexico
- Europe
- Germany
- United Kingdom
- France
- Italy
- Spain
- Rest of Europe
- Asia-Pacific
- China
- India
- Japan
- South Korea
- Australia
- Rest of Asia-Pacific
- South America
- Brazil
- Argentina
- Rest of South America
- Middle East and Africa
- GCC
- South Africa
- Rest of Middle East and Africa
- North America
Data Sources, Market Sizing, and Validation
Desk Research
Desk research was used to set the guardrails for the model and to anchor trends that can be cross-checked year over year. We mainly referenced public sources such as the World Health Organization, OECD health statistics, the US CDC, the US FDA device databases and safety communications, and the US NIH PubMed-indexed clinical literature for procedure and disease context.
To translate clinical signals into market logic, we also leaned on annual reports and investor presentations of listed medtech companies, hospital and payer publications on adoption, and reputable press coverage of product launches and recalls. In a few places, paid subscriptions were used for company financials and intelligence, patents, and shipment-level import or export checks, which helped validate directionally whether volumes and pricing were moving in line with the model. These desk research sources are illustrative, and many other public references were also used for data collection, validation, and clarification.
Primary Interviews and Surveys
Primary work focused on validating device scope boundaries, typical pricing progression, and adoption pace across key neurology care pathways. We spoke with a mix of manufacturers, distributors, clinicians, and procurement or biomedical engineering contacts, and inputs were balanced across APAC, EMEA, and the Americas so regional reimbursement and procedure realities were reflected.
Distribution of primary research fieldwork respondents
Distribution of primary research fieldwork respondents
| Company type | Respondent position | Region |
|---|---|---|
| Top tier: 32% | CXOs: 13% | APAC: 45% |
| Mid tier: 46% | Functional/Unit leaders: 35% | EMEA: 31% |
| Smaller Players: 22% | Managers: 52% | Americas: 24% |
Market-Sizing & Forecasting
Sizing was built using a top-down and bottom-up approach. We first used epidemiology and procedure indicators to reconstruct the demand pool, then validated results using selective supplier and channel approximations. In practice, we start from treated patient and procedure volumes by major neurology indications and interventions, apply device penetration rates and replacement cycles, and then translate this into value using typical ASP bands by device category.
Inputs that shaped the model included neurosurgical and interventional procedure volumes, implant and capital equipment replacement periods, installed base growth for stimulation systems, reimbursement or coverage direction in large countries, and the cadence of new product approvals that can change adoption. Where bottom-up checks were incomplete, gaps were handled by using region-level proxy ratios (such as procedures per neurologist or per hospital bed) and then adjusting after expert feedback.
For forecasting, scenario analysis was used so adoption and pricing could be flexed around practical drivers such as aging demographics, stroke burden, elective surgery recovery, and hospital capital spending cycles. Final growth paths were stress-tested against what interviewees expected for procedure expansion and procurement budgets, and then applied consistently across regions and device groups.
Data Validation & Update Cycle
Outputs were validated through triangulation across independent signals, and then checked for odd jumps that did not match known clinical or purchasing patterns. We also run variance checks across regions and device categories, and any outliers trigger a second review followed by re-contact with selected respondents when assumptions look stretched.
Before sign-off, the model and narrative go through multi-step analyst review so definitions, units, and currency handling stay consistent. Reports are refreshed annually, with interim updates when material events occur such as major recalls, policy changes, or large acquisition-driven portfolio shifts. Right before delivery, a final pass is completed so clients receive the latest updated view.
Mordor Intelligence's Global Neurology Devices Market Market Size Versus Other Published Estimates
Published market sizes for neurology devices can look far apart because each source draws the boundary differently and also picks different timing for the base year and currency conversion. Differences also show up when one model leans more on revenue reporting, while another leans on treated-patient logic and procedure volumes.
By tracking device category inclusions, checking treated-procedure signals, and refreshing currency timing, Mordor Intelligence keeps the estimate tied to new, finished neurology equipment revenues and avoids inflating totals with consumables or software-only analytics. In addition, some sources assume faster ASP expansion or higher penetration for implants in earlier years, which can lift the starting point even if the long-term trend is similar.
Benchmark comparison
| Source | Market Size | Gaps in Research Methodology |
|---|---|---|
| Mordor Intelligence | USD 15.82 B (2026) | |
| Global Consultancy A | USD 12.83 B (2024) | Uses an earlier base year and a different growth window, and its scope emphasis appears more concentrated on select therapeutic and interventional device categories, which can compress the total versus a broader neurology device basket. |
| Industry Publisher B | USD 15.69 B (2024) | Starts from a 2024 base and applies higher long-horizon growth assumptions, and the boundary around device versus adjacent consumables or monitoring add-ons is not always made explicit, which can shift the included revenue pool. |
Taken together, the spread is mainly explained by base-year choice and what is counted inside neurology devices versus adjacent items that sit around procedures. Our approach keeps the scope rules clear, ties the totals back to procedure and adoption variables, and makes the steps repeatable when the market is updated.
Key Questions Answered in the Report
How big is the Global Neurology Devices Market?
The Global Neurology Devices Market size is expected to reach USD 15.82 billion in 2026 and grow at a CAGR of 4.80% to reach USD 20.02 billion by 2031.
What is the current Global Neurology Devices Market size?
In 2026, the Global Neurology Devices Market size is expected to reach USD 15.82 billion.
Who are the key players in Global Neurology Devices Market?
Boston Scientific Corporation, Stryker Corporation, B. Braun Melsungen AG, Medtronic PLC and Abbott Laboratories are the major companies operating in the Global Neurology Devices Market.
Which is the fastest growing region in Global Neurology Devices Market?
Asia Pacific is estimated to grow at the highest CAGR over the forecast period (2026-2031).
Which region has the biggest share in Global Neurology Devices Market?
In 2025, the North America accounts for the largest market share in Global Neurology Devices Market.