
Natural Food Colorants Market Size and Share
Market Overview
| Study Period | 2021 - 2031 |
|---|---|
| Market Size (2026) | USD 2.15 Billion |
| Market Size (2031) | USD 3.25 Billion |
| Growth Rate (2026 - 2031) | 8.61 % |
| Fastest Growing Market | Asia Pacific |
| Largest Market | Europe |
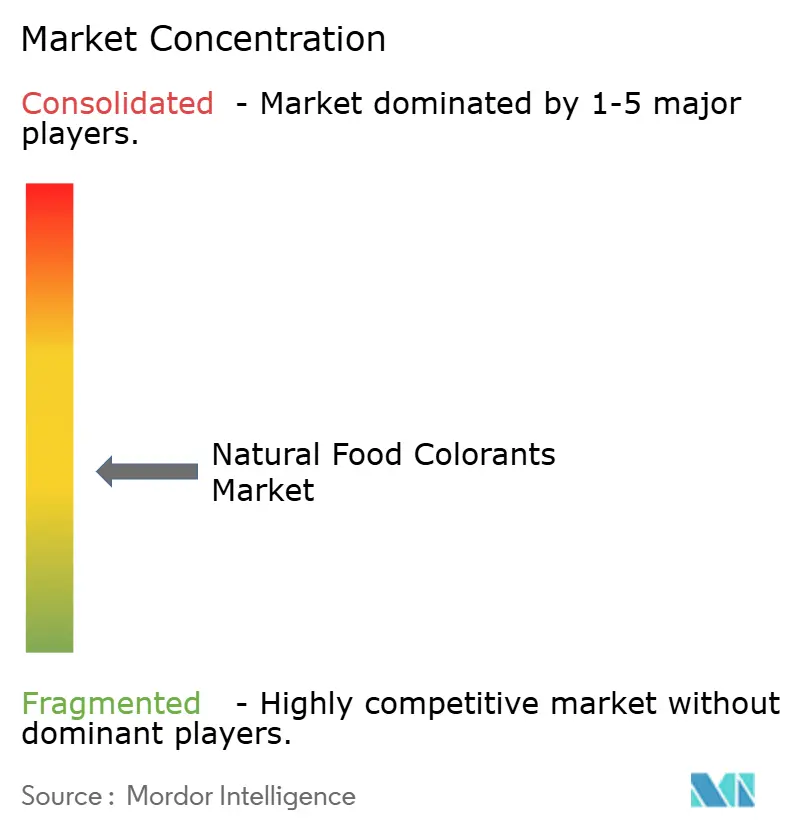
| Market Concentration | Medium |
Major Players *Disclaimer: Major Players sorted in no particular order Image © Mordor Intelligence. Reuse requires attribution under CC BY 4.0. | |
Natural Food Colorants Market Analysis by Mordor Intelligence
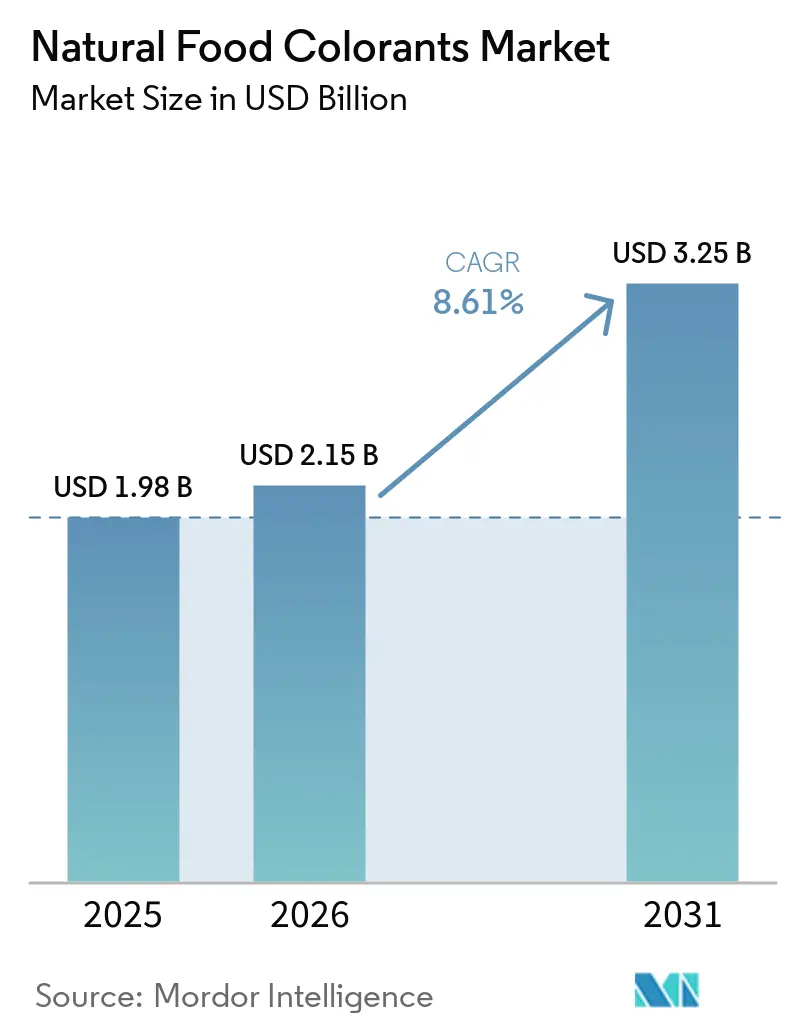
The Natural Food Colorants Market size was valued at USD 1.98 billion in 2025 and is estimated to grow from USD 2.15 billion in 2026 to reach USD 3.25 billion by 2031, at a CAGR of 8.61% during the forecast period (2026–2031). Momentum stems from a tight interplay of stricter regulations, consumer hostility toward synthetic azo dyes, and extraction and fermentation breakthroughs that protect margins even as raw-material volatility persists. Europe set the regulatory tone early, Asia-Pacific now posts the fastest uptake, and North America rides fresh U.S. Food and Drug Administration approvals that unlocked long-sought natural blue solutions. Market participants defend share through mergers, fermentation scale-ups, and technology that stabilizes pigments in heat- and pH-stressed foods. Retailer scorecards that penalize artificial colors, especially in beverages, have become near-mandatory gates to shelf space. Precision biology simultaneously compresses production cycles and eliminates weather-linked variability, elevating entry barriers for commodity extractors and widening the gap between innovation leaders and smaller regional processors.
Key Report Takeaways
- By product type, carotenoids led with 45.12% revenue share in 2025; anthocyanins are projected to expand at a 9.15% CAGR through 2031.
- By color, red pigments captured 31.28% share of the natural food colorants market size in 2025, while blue hues are moving ahead at a 10.02% CAGR to 2031.
- By form, powder formats dominated with 58.25% share in 2025; liquid concentrates are forecast to post a 9.58% CAGR through 2031.
- By application, beverages accounted for 38.25% of the natural food colorants market size in 2025, and dietary supplements are rising at a 10.58% CAGR over 2026-2031.
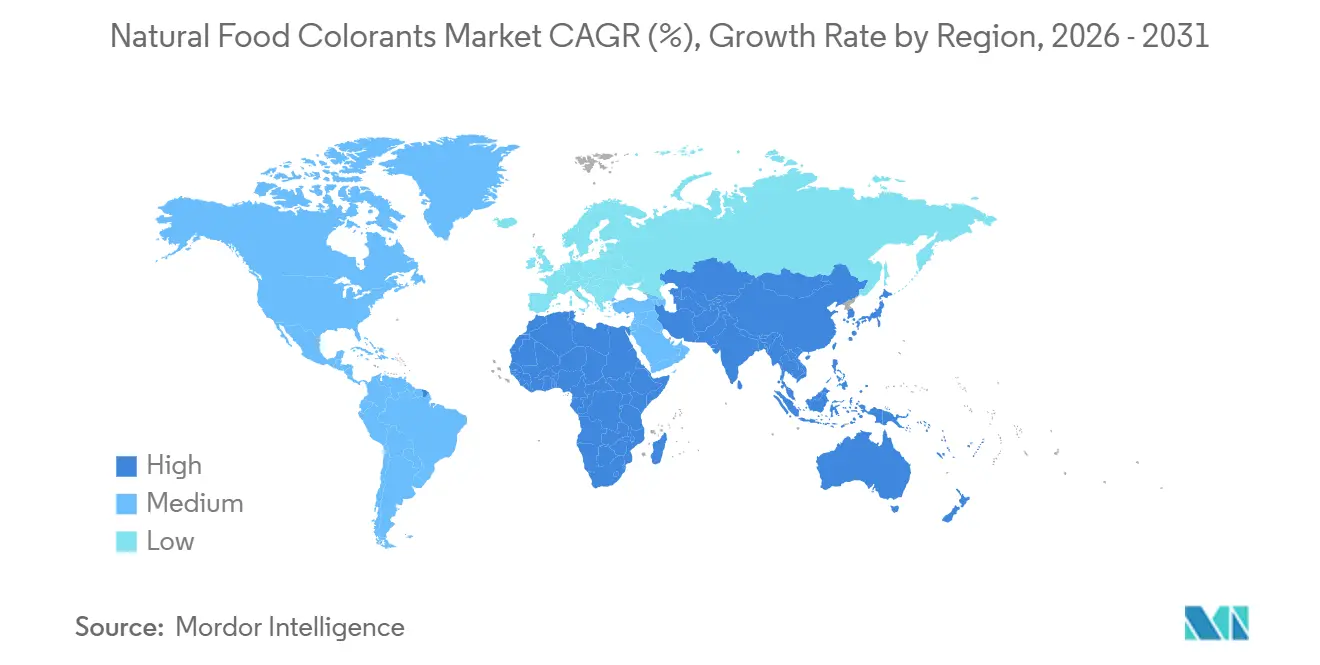
- By geography, Europe held 35.46% natural food colorants market share in 2025, whereas the Asia-Pacific is on track for a 9.78% CAGR during the outlook period.
Note: Market size and forecast figures in this report are generated using Mordor Intelligence’s proprietary estimation framework, updated with the latest available data and insights as of January 2026.
Market Trends and Insights
Drivers Impact Analysis of Natural Food Colorants Market*
| Drivers | (~) % Impact on CAGR Forecast | Geographic Relevance | Impact Timeline |
|---|---|---|---|
| Consumer Preference for Clean-Label and Natural Ingredients Over Synthetic Dyes | +2.1% | Global, with early gains in Western Europe, North America, and urban Asia-Pacific | Medium term (2-4 years) |
| Rising Demand in Beverages, Bakery, and Confectionery for Plant-Based Pigments | +1.8% | Global, strongest in North America and Europe for beverages; Asia-Pacific for bakery | Short term (≤ 2 years) |
| Health Benefits from Antioxidants in Carotenoids and Phycocyanin Sources | +1.3% | Global, with premium positioning in North America and Western Europe dietary supplements | Medium term (2-4 years) |
| Technological Advancements in Natural Color Extraction Driving the Market | +1.2% | Global, concentrated in research and development hubs in Netherlands, Denmark, United States | Long term (≥ 4 years) |
| Regulatory Approvals from Government Organizations | +1.0% | North America (FDA), Europe (EFSA), Asia-Pacific (FSSAI, CFDA) | Short term (≤ 2 years) |
| Microbial and Oil-Soluble Innovations for Scalable, Cost-Effective Production | +0.7% | Global, early commercial adoption in North America and Europe | Long term (≥ 4 years) |
| Source: Mordor Intelligence | |||
Consumer Preference for Clean-Label and Natural Ingredients Over Synthetic Dyes
A 2025 survey by the International Food Information Council reveals that 83% of global consumers consider ingredient transparency important when purchasing packaged foods[1]. Additionally, 86% of consumers can now differentiate between natural and synthetic colors. This growing awareness is largely attributed to advocacy campaigns that associated certain azo dyes, such as Tartrazine and Allura Red, with hyperactivity in children. In response, the European Union introduced a 2010 mandate requiring warning labels on products containing six specific synthetic colorants, driving voluntary reformulations and emphasizing the importance of European Commission Regulation 1333/2008. Major retailers have responded to this shift: In 2024, Tesco and Carrefour eliminated artificial color products from their private-label lines, while Walmart's "Great For You" label excluded synthetic dyes. This has created a two-tiered shelf system, where products with natural colors command a 20 to 30% price premium but maintain similar sales velocity. As production methods like microbial fermentation and supercritical CO₂ extraction reduce natural color costs by 15% annually, the willingness-to-pay gap is narrowing. This trend enables brands to adopt clean-label positioning without relying solely on premium pricing. On the regulatory side, companies must comply with the FDA's Color Additive Petitions and the EFSA's re-evaluation protocols. While these processes require detailed toxicological dossiers, achieving approval offers a significant competitive edge.
Rising Demand in Beverages, Bakery, and Confectionery for Plant-Based Pigments
In 2025, beverage applications represented 38.25% of the natural-color volume. This growth was primarily driven by leading carbonated soft-drink companies reformulating their products to meet retailer scorecards that penalize synthetic additives. PepsiCo, for example, removed artificial colors from Gatorade in 2024, replacing them with beta-carotene and fruit-and-vegetable concentrates. This reformulation extended across PepsiCo's global portfolio and was mirrored by Coca-Cola's reformulation of Fanta in European markets, as detailed in PepsiCo's 2024 Annual Report. The bakery and confectionery sectors face specific challenges. Anthocyanins derived from red cabbage and elderberry degrade in alkaline pH environments, such as cake batters. To address this, manufacturers encapsulate these colorants in maltodextrin matrices or co-formulate them with citric acid buffers, ensuring color stability during baking at temperatures exceeding 180 °C. Confectionery leader Mars transitioned M&M's to spirulina-derived blue and turmeric yellow in select markets. While this change resulted in a 10 percent cost increase, it aligned with clean-label mandates and eliminated the use of synthetic Brilliant Blue FCF. This shift also created export opportunities, as regulators in the Middle East and Southeast Asia increasingly adopt EU standards. According to the GCC Standardization Organization, products with natural colors face fewer import restrictions compared to those using synthetic dyes. Compliance with standards such as ISO 22000 food-safety certification and Halal/Kosher endorsements is essential, and natural plant-based pigments are better positioned to meet these requirements than insect-derived carmine.
Health Benefits from Antioxidants in Carotenoids and Phycocyanin Sources
Fortified beverages and gummies now provide 10 to 20 milligrams of lutein and zeaxanthin, xanthophyll carotenoids derived from marigold petals. These dosages are clinically associated with improving macular pigment optical density and protecting against blue light exposure for digital device users. Astaxanthin, sourced from Haematococcus pluvialis microalgae, exhibits singlet-oxygen quenching capabilities that are 550 times more potent than vitamin E. This makes astaxanthin a valuable ingredient in sports-nutrition bars, offering both coral-pink coloration and oxidative-stress reduction. Phycocyanin, obtained from Arthrospira platensis (commonly known as spirulina), demonstrates in vitro COX-2 inhibition. This supports joint-health claims in dietary supplements while also providing a turquoise hue to protein powders and functional shots. The combination of color and bioactivity allows brands to optimize their ingredient lists. For example, they can replace synthetic Blue 1 and a separate antioxidant with a single spirulina extract. This approach simplifies product labels and reduces formulation costs by 12 percent per SKU. Regulatory authorities play a significant role, with the FDA granting Generally Recognized as Safe (GRAS) status to specific carotenoid sources. Additionally, the EFSA establishes acceptable daily intake (ADI) guidelines, which natural extracts typically meet at functional dosages[2].
Technological Advancements in Natural Color Extraction Driving the Market
Pulsed electric field (PEF) technology uses short bursts of high voltage to rupture plant-cell membranes. This technique increases anthocyanin yields from blackcurrants by 40% compared to conventional solvent maceration and reduces processing time from 8 hours to just 45 minutes. Supercritical CO₂ extraction, conducted at 31°C and 74 bar, selectively extracts lipophilic carotenoids from paprika and annatto. This method prevents thermal degradation and hexane residues, ensuring compliance with organic certification standards and achieving a 25% price premium in European markets. Natural deep eutectic solvents (NADES), composed of choline chloride and organic acids, dissolve polyphenolic pigments at ambient temperature. This eliminates the need for energy-intensive heating and aligns with green-chemistry principles, appealing to procurement teams focused on sustainability. Microencapsulation using alginate or gum-arabic shells protects anthocyanins from pH and light exposure. This extends the shelf life of beverages in clear-PET bottles from 3 to 12 months, enabling ambient distribution in tropical regions with limited cold-chain infrastructure. Compliance requirements include adherence to EU Regulation 1333/2008 on food additives, which restricts processing aids, and ISO 9001 quality-management certification, a standard for Tier-1 suppliers.
Restraints Impact Analysis of Natural Food Colorants Market*
| Restraints | (~) % Impact on CAGR Forecast | Geographic Relevance | Impact Timeline |
|---|---|---|---|
| High Processing Cost and Low Yield of Natural Food Colorants | -1.4% | Global, most acute in price-sensitive markets in South Asia, Africa, and Latin America | Short term (≤ 2 years) |
| Supply chain variability from seasonal plant and algal sources | -0.9% | Global, concentrated in regions dependent on single-origin crops (Peru for annatto, India for turmeric) | Medium term (2-4 years) |
| Color instability in high-heat or acidic food applications | -0.6% | Global, particularly impacting bakery and acidic beverage segments | Medium term (2-4 years) |
| Stringent Regulatory Compliance Requirements | -0.4% | North America (FDA), Europe (EFSA), Asia-Pacific (FSSAI, CFDA) | Long term (≥ 4 years) |
| Source: Mordor Intelligence | |||
High Processing Cost and Low Yield of Natural Food Colorants
The global natural food colorants market faces significant economic challenges, despite advancements in technology. Processing costs and yield limitations create price premiums that restrict market penetration worldwide. Natural colorants command higher prices than synthetic alternatives, which presents formulation challenges, particularly in mass-market products with strict margin requirements across different regions. Multiple factors contribute to this cost differential, including raw material inconsistency, complex extraction processes, lower pigment concentrations in natural sources, and varying regional production capabilities. These economic constraints have prompted innovation in biotechnology solutions globally. Companies such as Phytolon are developing fermentation-based production methods to potentially reduce natural colorant costs. The Food and Drug Administration (FDA) has received color additive petitions from Phytolon for beetroot red and prickly pear yellow, signaling advancement in commercializing these innovative approaches. Although processing costs remain a significant market restraint worldwide, increasing regulatory pressure to eliminate synthetic dyes is creating market conditions where the price premium for natural alternatives becomes more acceptable. The high production costs continue to hamper market growth, particularly in price-sensitive developing markets where manufacturers struggle to maintain competitive pricing.
Supply Chain Variability from Seasonal Plant and Algal Sources
In Andhra Pradesh and Tamil Nadu, India's primary turmeric cultivation zones, curcumin content ranges from 2.5% to 6.5%, depending on monsoon rainfall and soil sulfur levels. This variability forces buyers to over-contract by 30% to ensure sufficient pigment supply, driving up inventory-carrying costs. Carmine, extracted from cochineal insects (Dactylopius coccus) raised on Peruvian Opuntia cacti, is affected by biennial pest cycles and climate-related cactus die-offs. These issues caused a 40% supply shortfall in 2024, with spot prices escalating from USD 80 to USD 135 per kilogram within eight weeks. Spirulina, grown in open raceways, is susceptible to contamination by Anabaena and Microcystis cyanobacteria, which produce hepatotoxic microcystins. A single contamination event can destroy an entire 10-hectare pond, delaying deliveries by 90 days. Annatto seed (Bixa orellana) harvests in Peru and Kenya occur annually, requiring processors to finance 12 months of working capital to maintain a consistent supply. This ties up USD 2 million to USD 5 million per facility and increases financing costs by 180 basis points compared to synthetic-dye distributors using just-in-time inventory. Compliance requirements, including traceability under EU Regulation 178/2002 and FSMA Preventive Controls, mandate supplier audits and lot-level documentation, adding USD 12,000 to USD 20,000 in annual administrative expenses.
*Our forecasts treat driver/restraint impacts as directional, not additive. The impact forecasts reflect baseline growth, mix effects, and variable interactions.
Natural Food Colorants Market Segment Analysis
By Product Type:
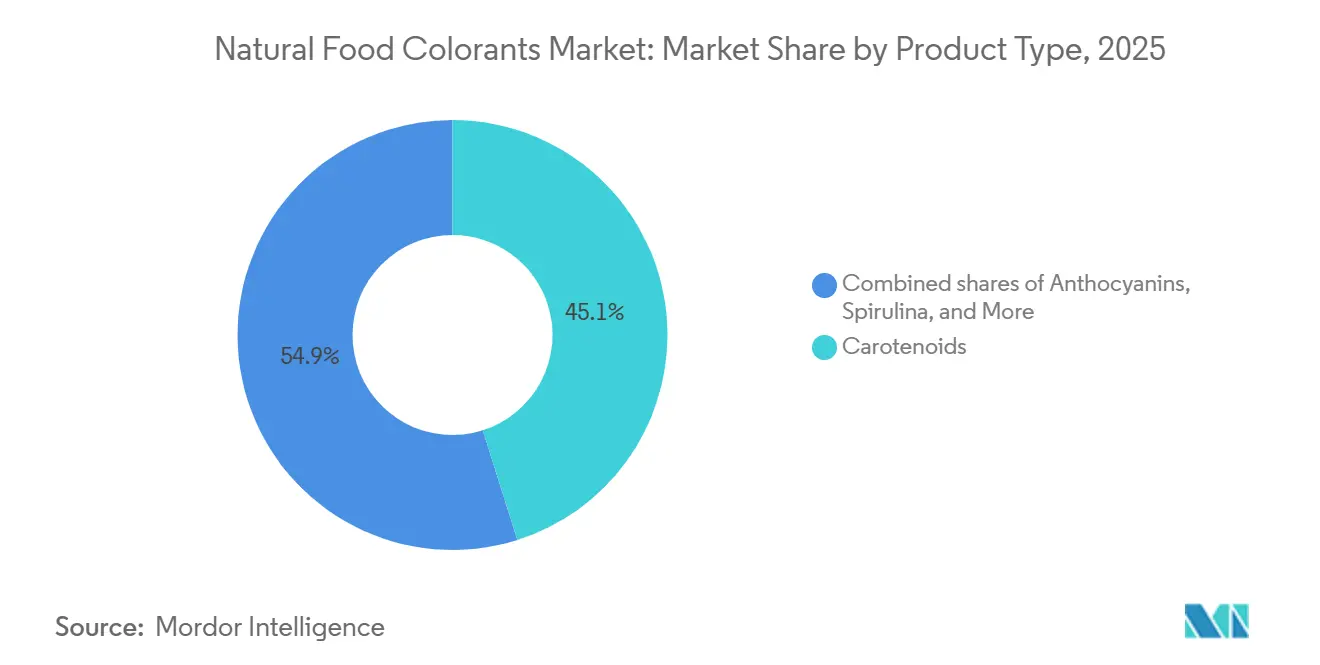
Spirulina Challenges Carotenoid DominanceIn 2025, carotenoids accounted for 45.12% of the revenue, emphasizing their significant role in dairy, bakery, and beverage sectors. As fermentation secures a growing 22% share of the market, the natural food colorants market for carotenoids is expected to grow steadily, reducing the cost gap with synthetic alternatives. Anthocyanins, driven by vegan candy lines that have effectively replaced carmine while maintaining signature reds and purples, are the fastest-growing product group, with a 9.15% CAGR.
Beta-carotene produced via precision fermentation has already reached cost parity with synthetic options, signaling a turning point that could impact other carotenoids. Despite challenges with pH and heat, curcumin continues to maintain its niche in curry sauces and dietary supplements. While carmine's use in food is declining, its demand in cosmetics provides partial support. However, as berry-derived reds gain momentum, carmine's share in the natural food colorants market is expected to decrease. Spirulina, the leader in the blue colorant segment, now faces competition from emerging players like butterfly pea and Galdieria. Nevertheless, spirulina's established sensory profile and scale advantages provide incumbents with an opportunity to optimize cost efficiencies.

By Color:
Red Dominance Continues, Blue Emerges as Eye-Catching StarIn 2025, red accounted for a 31.28% share of the market, a position the natural food colorants market is unlikely to lose soon due to red's extensive application in fruits, desserts, and sauces. However, the blue subsegment, growing at a 10.02% CAGR, is attracting considerable attention from beverage, ice-cream, and sports-nutrition brands aiming to create visually appealing content for social media. The FDA's 2025 approval of butterfly pea extract, along with EFSA's authorization of Galdieria blue, has expanded the options available to formulators, encouraging spirulina to improve its flavor-masking technologies.
Yellows (such as curcumin and beta-carotene) and oranges (including annatto and paprika) remain essential, while greens often rely on pigment combinations, which restricts their growth. Meanwhile, purple and pink shades are gaining traction in premium segments like yogurts and frozen desserts, aligning with the consumer interest in “unicorn” color palettes. Although red will maintain its dominance in absolute revenue, the blue segment is expected to surpass other colors in terms of relative growth.
By Form:
Powder Dominance Persists, Yet Liquid Concentrates Gain popularityIn 2025, powder formats accounted for 58.25% of the segment's revenue, valued for their shelf stability, precise dosing in bakery mixes, and compatibility with dry-blending equipment commonly used in snack and cereal production. Spray-drying and freeze-drying technologies encapsulate natural pigments within maltodextrin or gum-arabic matrices, providing a shelf life of 24 months under ambient conditions. This advancement not only extends product longevity but also reduces cold-chain logistics costs by 35% compared to liquid concentrates, as reported in the Journal of Food Engineering. Liquid concentrates, comprising aqueous and oil-based dispersions, are projected to grow at a 9.58% CAGR through 2031. This growth is driven by beverage co-packers increasingly adopting inline injection systems, which reduce batch-to-batch color variation to below 1 Delta E and eliminate dust exposure risks for production workers.
Additionally, liquid formats support micro-dosing in functional shots and ready-to-drink teas. In these cases, powders would require high-shear mixing for dissolution, increasing processing time by 8 to 12 minutes per batch. Emulsion technologies stabilize lipophilic carotenoids in aqueous beverages by achieving droplet sizes below 200 nanometers, preventing creaming and enhancing color intensity threefold. This innovation enables formulators to reduce dosage rates by 64%, significantly lowering raw-material costs. However, powder formats face limitations in acidic beverage applications, where anthocyanin powders exhibit 20% lower color intensity than liquid concentrates due to incomplete rehydration and particle agglomeration. Regulatory compliance remains critical, with the FDA's good manufacturing practices for color additives mandating particle-size specifications and microbial limits. Similarly, the EU's Regulation 1333/2008 imposes restrictions on processing aids in liquid formulations.
By Application:
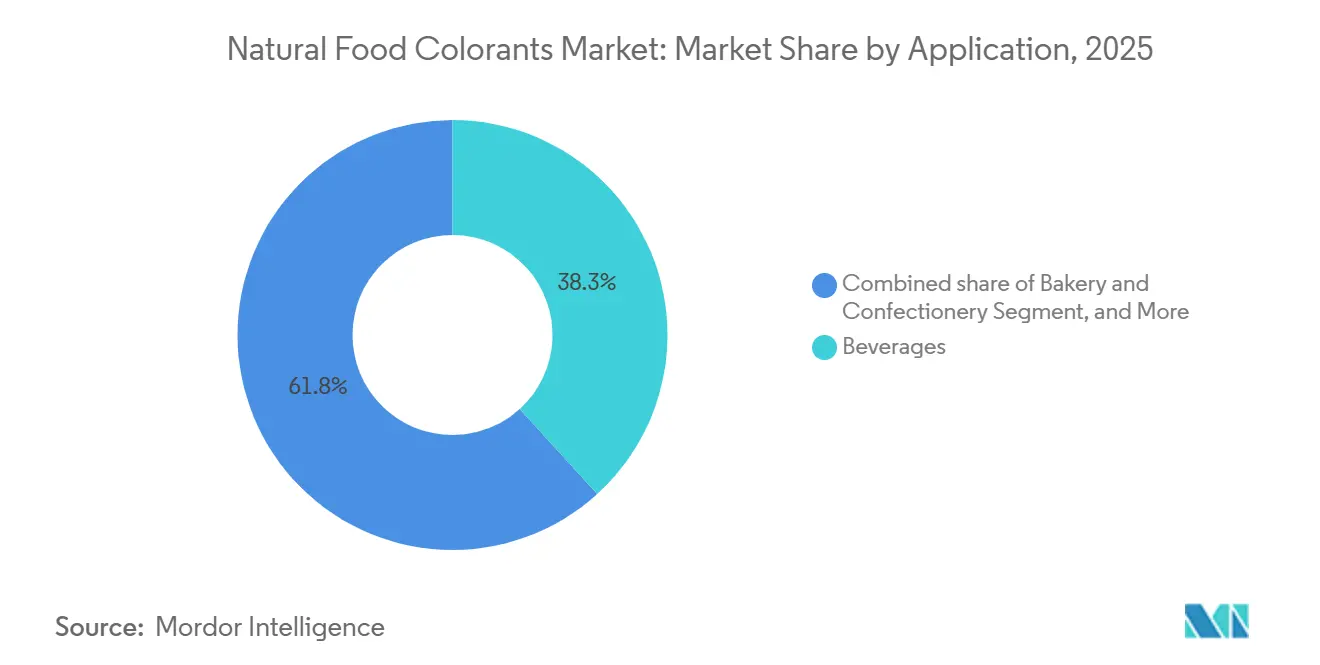
Nutraceuticals Drive Future GrowthIn 2025, beverages represented 38.25% of application revenue, driven by carbonated soft drinks, sports drinks, and ready-to-drink teas reformulated to meet retailer clean-label scorecards penalizing synthetic additives. Non-alcoholic beverages dominated with 82% of the beverage-application volume, while alcoholic segments, such as craft beer, flavored malt beverages, and ready-to-drink cocktails, embraced natural colors to align with premiumization and health-conscious trends. Dietary supplements experienced the fastest application growth, with a 10.58% CAGR projected through 2031. This growth is supported by products like lutein and zeaxanthin softgels for eye health, astaxanthin capsules for sports recovery, and spirulina tablets marketed for immune support. The dietary supplement segment benefits from the dual functionality of natural colors, which enhance visual appeal and deliver bioactive compounds that support label claims. This functionality enables brands to simplify ingredient lists and streamline regulatory filings. Bakery and confectionery applications face formulation challenges. For example, anthocyanins degrade in alkaline pH cake batters, requiring encapsulation or co-formulation with acidulants, while curcumin loses 60% of its intensity during retort sterilization.
Dairy products, including yogurt, ice cream, and cheese, utilize annatto, beta-carotene, and carmine. Oil-soluble formats are preferred in high-fat matrices to prevent halo effects. Snacks and cereals use turmeric, paprika, and beetroot powders to create trendy "rainbow" varieties targeting young consumers. However, to prevent color migration between adjacent pieces, barrier coatings are applied, adding an extra cost of USD 0.02 per unit. Regulatory bodies significantly influence the market, with the FDA issuing GRAS notices for specific applications and the EFSA imposing use-level restrictions, such as capping curcumin at a daily intake of 0.1 milligrams per kilogram of body weight.
Geography Analysis
Europe Natural Food Colorants Market
In 2025, Europe accounted for 35.46% of global revenue, driven by strict clean-label regulations and the early elimination of synthetic azo dyes. The European Commission's 2010 directive, which required warning labels on six synthetic colorants, prompted voluntary reformulations. By 2024, major retailers such as Tesco and Carrefour had removed artificial-color products from their private-label lines, adhering to European Commission Regulation 1333/2008. In January 2025, EFSA approved Galdieria sulphuraria-derived phycocyanin, enabling the production of blue plant-based yogurts and ice creams. These products, which previously relied on spirulina with seaweed off-notes, triggered reformulation projects across 22 European dairy brands within six months, as noted in the EFSA Journal 2025. Spain and the Netherlands, home to GNT Group's Exberry facility in Mierlo and Roha Dyechem's Catalonia plant, serve as key natural-color production hubs, benefiting from proximity to end-users and access to raw materials from North Africa and South America. Poland and Belgium are emerging as growth markets, with their confectionery and bakery sectors adopting natural colors to meet EU export standards and achieve premium positioning in Western European markets.
APAC Natural Food Colorants Market
Asia-Pacific leads with a strong 9.78% CAGR through 2031, fueled by urbanization, rising incomes, and increased packaged-food consumption in China, India, and Southeast Asia, as per World Bank Development Indicators. In 2024, China's National Health Commission expanded its list of approved natural colors, aligning with Codex Alimentarius standards and enhancing export competitiveness for local food processors. India's FSSAI, in 2024, approved red cabbage extract and safflower yellow, enabling manufacturers to reformulate traditional sweets (mithai) and beverages (lassi, flavored milk) with natural colors, targeting premium urban markets, as highlighted in the FSSAI Notification[3]. Japan and South Korea are experiencing high adoption of natural colors, particularly in confectionery and dairy, driven by health-conscious consumers and regulations that favor plant-based additives. Japan's Ministry of Health, Labor and Welfare maintains a more extensive positive list of 158 natural colors compared to its synthetic-dye approvals. Australia's food sector is following Europe's clean-label trend, with major retailers Woolworths and Coles prioritizing natural colors in their private labels, prompting supplier reformulations. In Indonesia, Thailand, and Singapore, the ready-to-drink beverage and snack sectors are growing rapidly, with natural colors aligning with Halal certification and Islamic dietary laws, accounting for 68% of the regional beverage volume, as per the GCC Standardization Organization.
The Americas and MEA Natural Food Colorants Market
North America represented 28% of global revenue in 2025, with the U.S. contributing 74% of that volume. This growth was driven by the FDA's May 2025 approvals of butterfly pea flower and Galdieria blue, along with clean-label initiatives from retailers like Walmart, which introduced the "Great For You" icon to identify products free from synthetic dyes. Canada's food sector closely aligns with U.S. regulations, and Health Canada's 2024 discussions on synthetic-dye restrictions suggest potential phase-outs, mirroring European trends. Chile, Colombia, and Peru are leveraging local raw materials, such as Peru's annatto and Colombia's turmeric to supply both regional and export markets, though seasonal supply variability remains a challenge. In the Middle East and Africa, demand for Halal-certified foods in Saudi Arabia, the UAE, and Egypt is driving the market. Here, natural plant-based colors are more compliant with Islamic dietary laws than insect-derived alternatives like carmine. South Africa and Nigeria are emerging as key production hubs for spirulina and annatto, focusing on intra-African trade and European export opportunities.
Regulatory Landscape
In the United States, natural food colorants are regulated as color additives under the Federal Food, Drug, and Cosmetic Act and must be listed under FDA rules (notably 21 CFR Parts 70, 73, and 74), with many plant- and algae-derived colors falling under the exempt-from-certification pathway. In February 2026, the FDA updated its approach to "no artificial colors" claims, providing enforcement discretion that supports on-pack communication for products that avoid petroleum-based colors. This has increased the commercial urgency to reformulate away from synthetic dyes.
In the European Union, food colors are regulated as additives under the EU framework (including Regulation (EC) No 1333/2008), with EFSA responsible for safety assessment and ongoing re-evaluation. The EU continues its long-running re-evaluation program for food additives that began after the 2009 prioritization list. Across major markets, dossier-based approvals, specification controls, and traceability requirements remain core compliance gates that determine which pigment sources and processing methods can scale. The regulatory approach generally focuses on authorized substances, usage conditions, and safety updates, rather than separating colors by whether they are "natural" or "artificial" in marketing terms.
Value Chain Analysis
The natural food colorants value chain starts with raw material production and aggregation (botanical crops such as paprika, annatto, turmeric, beet, and berry sources, plus algal and microbial inputs used for spirulina/phycocyanin and fermentation-derived pigments). It then moves into primary processing (cleaning, drying, milling), extraction and purification (including solvent-free and green-chemistry routes), and stabilization (encapsulation and emulsification) to meet heat, light, and pH constraints in beverages, bakery, confectionery, and dairy. The final upstream step is application-specific blending and format conversion into powders or liquids, with technical service teams supporting shade matching, shelf-life validation, and regulatory documentation for specific food categories.
Downstream, distribution is largely B2B through direct sales by global suppliers and regional distributors into food and beverage manufacturers, co-packers, and nutraceutical producers, followed by finished-product retail channels where clean-label scorecards shape reformulation timelines. Value capture concentrates among suppliers that combine multi-origin sourcing, proprietary extraction and stabilization know-how, and regulatory readiness (FDA listing pathways and EFSA authorization and re-evaluation requirements). Bottlenecks remain tied to agricultural and algal variability (seasonal yield swings and contamination risk), limited specialized extraction capacity, and the time and cost of regulatory and quality documentation required for multinational rollouts.
Competitive Landscape
The natural food colorants market is moderately concentrated, with regional and global players dominating the market. Leading companies such as Sensient Technologies, GNT Group B.V., Givaudan S.A., Döhler Group SE, and DIC Corporation play a significant role in shaping the natural food colorants market. These companies capitalize on their extensive product portfolios, advanced technical expertise, and well-established global distribution networks to maintain their market dominance. Their substantial investments in research and development further strengthen their competitive positioning and drive innovation in the industry.
These key players are actively expanding their product offerings by focusing on sustainable sourcing practices, clean-label product innovations, and strategic mergers and acquisitions. For instance, Givaudan's acquisition of Naturex has significantly enhanced its capabilities in botanical and natural color solutions, enabling it to cater to the growing demand for natural ingredients. Similarly, Sensient is heavily investing in research and development to create natural pigments with improved heat and light stability, specifically designed for applications in the dairy and beverage industries, addressing critical industry needs.
In addition to the efforts of major players, regional companies are increasingly expanding their footprint, particularly in emerging markets, by forming strategic partnerships. The market is also experiencing a notable rise in biotechnology firms that employ advanced techniques such as fermentation and precision breeding to develop natural colorants with superior stability and cost-effectiveness. Furthermore, many companies are adopting vertical integration strategies to secure a consistent supply of raw materials and ensure stringent quality control throughout the production process, thereby enhancing their operational efficiency and product reliability.
Natural Food Colorants Industry Leaders
-
Sensient Technologies Corporation
-
Doehler Group SE
-
Givaudan S.A.
-
GNT Group B.V.
-
DIC Corporation
- *Disclaimer: Major Players sorted in no particular order
Natural Food Colorants Market Companies Covered in this Report
- Chr. Hansen Holding A/S (Oterra)
- Sensient Technologies Corp.
- GNT Group B.V.
- Archer Daniels Midland Co.
- Döhler GmbH
- Kalsec Inc.
- DDW The Color House
- Givaudan S.A.
- Symrise AG
- Kerry Group plc
- DSM-Firmenich
- Lycored
- BASF SE
- Chenguang Biotech Group Co., Ltd.
- Roha Dyechem
- AVT Natural Products
- Allied Biotech Corp.
- Synthite Industries
- International Flavors and Fragrances Inc.
- Aarkay Food Colors
Market Opportunities and Future Outlook
A near-term opportunity is the accelerated conversion away from petroleum-based synthetic dyes in the United States, reinforced by the FDA and HHS initiative launched in 2025 to phase out petroleum-based dyes with target timelines through 2027. Alongside the FDA's February 2026 enforcement-discretion approach to "no artificial colors" claims, this policy backdrop increases the value of scalable natural alternatives and pushes demand for technical solutions that perform in challenging matrices, including low-pH beverages and high-heat processing.
Capacity buildout and biotech-driven supply models provide a second opportunity area, especially for suppliers that can reduce dependence on weather-linked crops and improve stability. In March 2026, Sensient committed significant capital to expand natural color manufacturing capacity, indicating that large-scale, domestic production networks and application support are becoming differentiators during reformulation cycles. Parallel activity in precision fermentation, including Phytolon's fermentation-derived beetroot red pathway referenced in U.S. rulemaking and partnerships such as Oterra with Debut, also highlights whitespace for new pigment sources aimed at consistent supply, tighter specifications, and improved performance across blue, red, and other high-demand shade spaces.
Recent Industry Developments in Natural Food Colorants Market
- March 2026: Sensient Technologies started a major expansion at its St. Louis natural color plant, adding 28,800 square feet of specialized production capacity under a broader natural colors capital program. The added footprint increases domestic manufacturing throughput and supports faster reformulation cycles as U.S. brands shift away from synthetic dyes.
- January 2026: Doehler Group introduced natural white color solutions positioned as alternatives to titanium dioxide for confectionery applications. This broadens the toolkit for manufacturers that want whiteness and opacity while aligning with clean-label and additive scrutiny in sensitive categories.
- April 2025: Sensient Technologies highlighted FDA approval of butterfly pea flower extract as a color additive for use in beverages, confectionery, and dairy. The approval expanded the palette of naturally derived blue solutions and gave formulators another route to meet retailer and brand requirements that discourage synthetic colors.
Natural Food Colorants Market Report Scope and Research Methodology
Market Definition and Coverage
We define the market as the sales value of natural pigments sourced from plant, microbial, mineral, or animal origins that are used to color finished food and beverage products in commercial production.
Scope exclusions: We exclude synthetic, petroleum-derived, and nature-identical dyes, and we also exclude non-food uses such as cosmetics and animal feed.
Segments Covered in This Report
- Product Type
- Anthocyanins
- Carotenoids (Includes Beta-Carotenes)
- Curcumin
- Carmine
- Spirulina
- Other Types
- Color
- Blue
- Green
- Red
- Yellow
- Purple
- Orange
- Pink
- Others
- Form
- Powder
- Liquid
- Applications
- Bakery and Confectionery
- Dairy Products
- Beverages
- Non-alcoholic
- Alcoholic
- Dietary Supplements
- Snacks and cereals
- Other Applications
- By Geography
- North America
- United States
- Canada
- Mexico
- Rest of North America
- Europe
- Germany
- United Kingdom
- Italy
- France
- Spain
- Netherlands
- Poland
- Belgium
- Sweden
- Rest of Europe
- Asia-Pacific
- China
- India
- Japan
- Australia
- Indonesia
- South Korea
- Thailand
- Singapore
- Rest of Asia-Pacific
- South America
- Brazil
- Argentina
- Colombia
- Chile
- Peru
- Middle East and Africa
- South Africa
- Saudi Arabia
- United Arab Emirates
- Nigeria
- Egypt
- Morocco
- Turkey
- Rest of Middle East and Africa
- North America
Data Sources, Market Sizing, and Validation
Desk Research
Desk research starts with building a clean scope and a common vocabulary for what is and is not a natural food colorant, since naming differs by region and label rules. We referenced public technical and regulatory material such as Codex Alimentarius texts, the US FDA color additive listings and guidance, the European Commission and EFSA pages on food colors, and selected peer-reviewed articles that explain pigment families like carotenoids, anthocyanins, chlorophyll, curcumin, and spirulina-derived pigments.
To convert the scope into a usable model, we also pulled broad processed food and beverage output signals and trade flows using sources such as UN Comtrade and national customs releases, followed by public company filings, investor presentations, and reputable press coverage of capacity additions and portfolio shifts. Where needed, we supplemented context checks using a paid subscription we have for company financials and a paid patent database to track filing activity around extraction and stabilization. The sources listed here are illustrative only, and many other public references were used for cross-checks, clarification, and validation.
Primary Interviews and Surveys
Primary work is used to stress-test the desk assumptions, especially around which pigment families are actually being adopted in high-volume recipes and what drives switching behavior. We spoke with stakeholders across ingredient manufacturing, food and beverage formulation, and distribution, and then aligned feedback across APAC, EMEA, and the Americas so the model reflects regional regulatory and labeling realities. Where responses disagreed, we followed up and used ranges until the final market total and growth drivers were consistent with observable industry signals.
Distribution of primary research fieldwork respondents
| Company type | Respondent position | Region |
|---|---|---|
| Top tier: 35% | CXOs: 14% | APAC: 40% |
| Mid tier: 48% | Functional/Unit leaders: 32% | EMEA: 34% |
| Smaller Players: 17% | Managers: 54% | Americas: 26% |
Market-Sizing & Forecasting
Sizing is built from a top-down model where food and beverage processing demand is translated into a colorant demand pool through realistic adoption rates, typical treat rates by application, and an average selling price progression by pigment family. Those totals are then corroborated through selective bottom-up checks, such as rolling up a sample of supplier revenues, validating volume-to-value behavior through channel checks, and testing implied pricing against interview feedback.
Key inputs that shape the math include the pace of clean-label reformulation in beverages and confectionery, regulatory acceptability and labeling restrictions by region, availability of raw materials (for example, seasonal crop dependence for some botanicals), yield and stability constraints that influence usage rates, and the mix shift across pigment families like carotenoids and anthocyanins. When a bottom-up signal is missing for smaller countries or niche families, we fill gaps using proxy adoption rates tied to processed food output and then re-check the implied per-capita usage with experts.
For forecasting, scenario analysis is used so growth can be flexed based on reformulation speed, relative price moves versus synthetic colors, and supply tightness for key natural sources. The final path is selected after aligning the scenario ranges with what interviewees expect in contract cycles and product launch pipelines, which keeps the outlook grounded in how deals actually get planned.
Data Validation & Update Cycle
We validate the model by triangulating market totals against independent signals, such as region-level packaged food momentum, trade directionality for pigment inputs, and public announcements on capacity and application expansion. Outliers are investigated by checking unit assumptions, currency timing, and whether a data point reflects food-only demand or a broader colorants view.
Before sign-off, a second analyst reviews the logic and key assumptions, and we re-contact sources when a variance cannot be explained by a clear scope or timing reason. The report is refreshed on an annual cycle, and interim updates are triggered by material events such as major regulatory changes, supply shocks in key botanicals, or step changes in pricing. Right before delivery, we do a final pass to ensure the latest publicly available signals are reflected in the numbers.
Mordor Intelligence's Global Natural Food Colorants Market Size Compared With Other Published Estimates
Published market sizes for natural food colorants often do not match because each publisher draws the line differently on what counts as natural, and they may also use different years, currencies, and price assumptions. Differences also show up when one estimate is built around ingredient sales into food and beverage, while another leans on broader colorant revenue pools that mix in adjacent end uses.
In this study, the bigger gap driver is usually scope, since some estimates include nature-identical colors or fold in non-food demand, and that quickly lifts the total. The other recurring driver is pricing logic, where aggressive price inflation or a higher assumed shift to premium pigments can move the value up even if volumes are similar. For that reason, the food-only inclusion rule and pigment-family price tracking are kept explicit, a modeling choice applied by Mordor Intelligence.
Benchmark comparison
| Source | Market Size | Gaps in Research Methodology |
|---|---|---|
| Mordor Intelligence | USD 2.15 B (2026) | |
| Trade Journal A | USD 2.01 B (2025) | Uses a different base year and may group natural food colors with wider ingredient definitions, so year alignment and scope normalization are not clearly visible. |
| Industry Portal B | USD 2.06 B (2025) | Long-horizon forecasts often rely on generalized growth rates and do not clearly separate food-only demand from adjacent uses, which can shift totals depending on what is included. |
The table shows that most of the spread comes from year selection and what is counted as natural, rather than from a single demand signal moving sharply. By keeping the demand pool tied to food and beverage usage, and by using a clear price-by-pigment logic that can be checked in interviews, we can explain the total and also reproduce it when assumptions change.
Key Questions Answered in the Report
What is the projected value of the natural food colorants market by 2031?
It is set to reach USD 3.25 billion, reflecting an 8.61% CAGR from 2026-2031.
Which region is growing fastest for natural food colorants?
Asia Pacific is advancing at a 9.78% CAGR on the back of regulatory harmonization and rising packaged-food penetration.
Which application segment shows the highest growth?
Dietary supplements lead with a 10.58% CAGR thanks to carotenoid and phycocyanin health claims.
How dominant are powder formats today?
Powders account for 58.25% of segment revenue due to long shelf life and compatibility with dry-blend processes.