
Mobile Analytics Market Size and Share
Market Overview
| Study Period | 2020 - 2031 |
|---|---|
| Market Size (2026) | USD 11.19 Billion |
| Market Size (2031) | USD 32.33 Billion |
| Growth Rate (2026 - 2031) | 23.65 % |
| Fastest Growing Market | Asia Pacific |
| Largest Market | North America |
| Market Concentration | Medium |
Major Players *Disclaimer: Major Players sorted in no particular order Image © Mordor Intelligence. Reuse requires attribution under CC BY 4.0. | |
Mobile Analytics Market Analysis by Mordor Intelligence
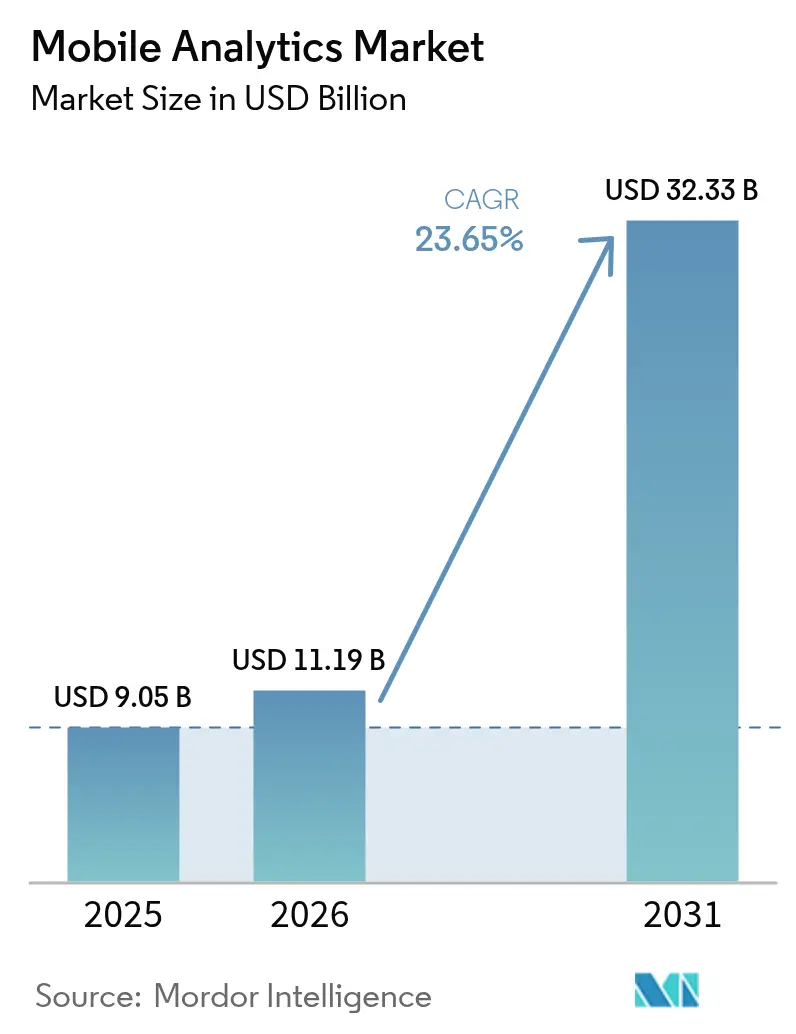
The mobile analytics market size was valued at USD 9.05 billion in 2025 and estimated to grow from USD 11.19 billion in 2026 to reach USD 32.33 billion by 2031, at a CAGR of 23.65% during the forecast period (2026-2031). Momentum is driven by the ubiquity of smartphones, cloud-native adoption, and the surge in mobile commerce transactions, which reached USD 3.56 trillion in 2024. Organizations are shifting spend toward behavioral measurement platforms because web-centric tools fail to capture gesture-level signals that drive mobile conversion. Widespread 5G coverage, rising mobile ad budgets, and the growing adoption of edge computing for on-device analytics further expand opportunities across the mobile analytics market. Competitive intensity is increasing as privacy regulation prompts vendors to develop cohort-based, first-party data techniques that balance insight generation with compliance.
Key Report Takeaways
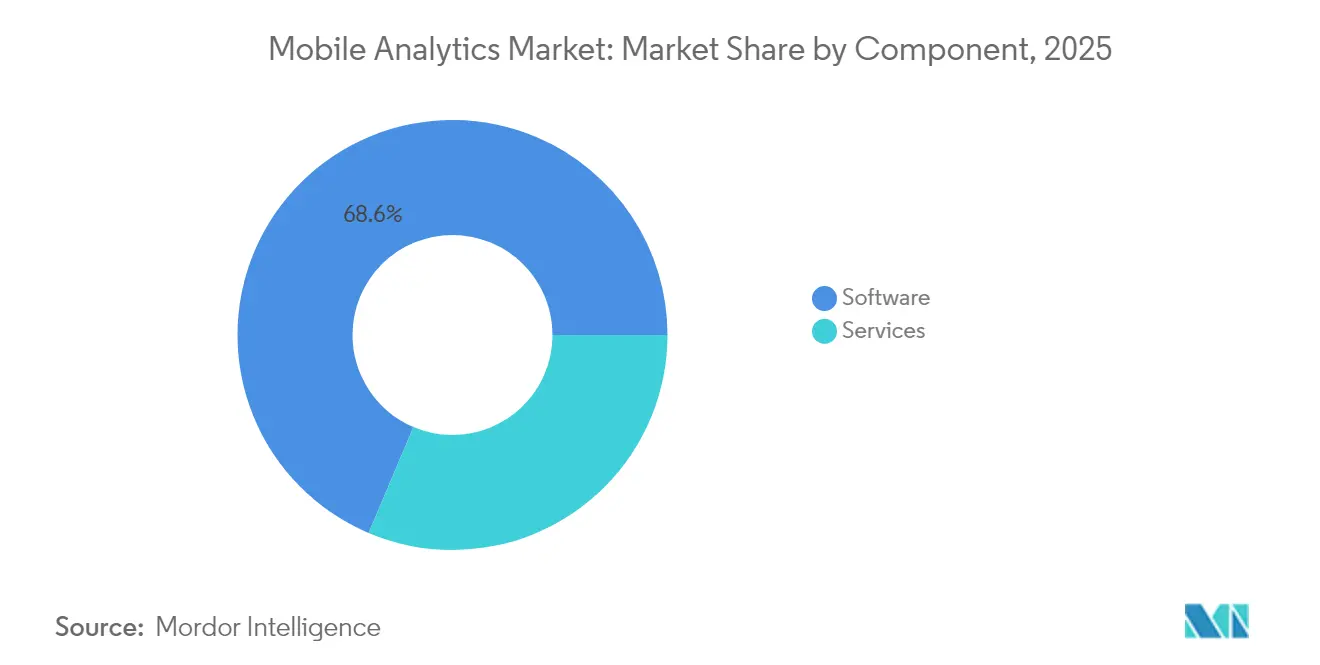
- By component, software solutions led with a 68.62% share of the mobile analytics market in 2025, while services are projected to advance at a 25.4% CAGR through 2031.
- By analytics type, application analytics held a 34.98% share of the mobile analytics market size in 2025, and in-app behavioral analytics is projected to expand at a 24.1% CAGR through 2031.
- By deployment, cloud delivery accounted for 75.88% of the mobile analytics market size in 2025; the segment is projected to rise at a 25.6% CAGR through 2031.
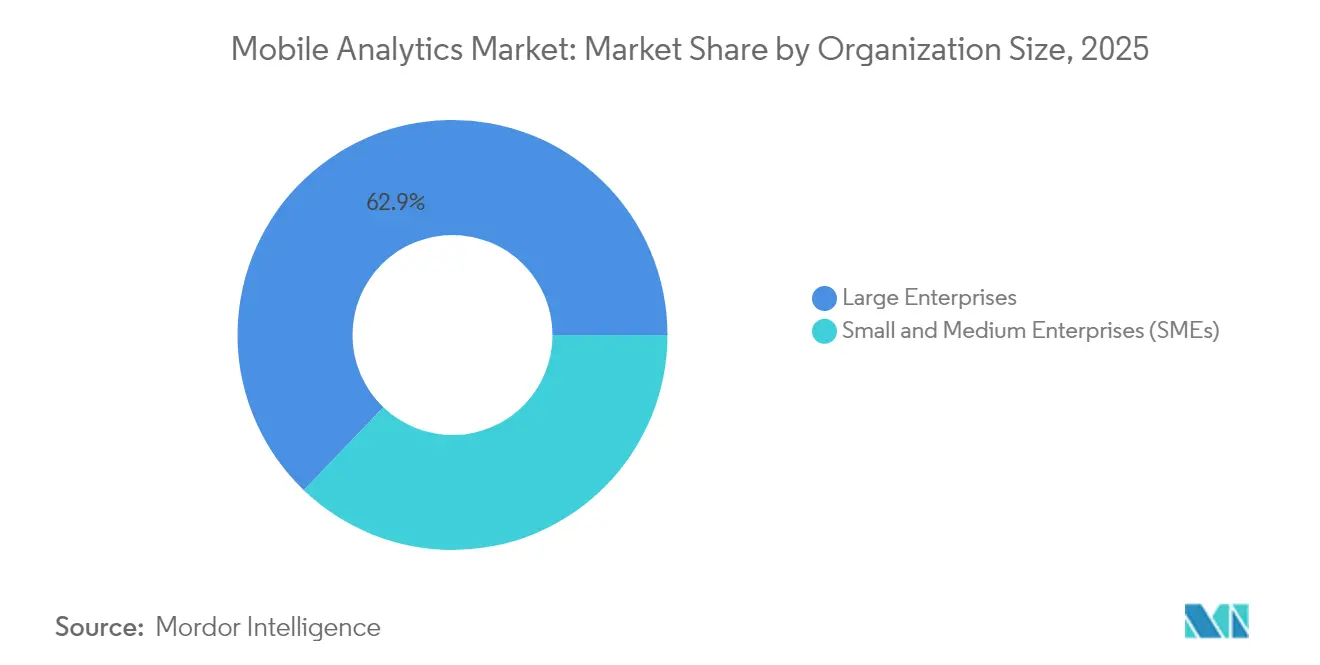
- By organization size, large enterprises generated 62.85% of revenue in 2025, whereas SMEs recorded the highest CAGR at 25.5% through 2031.
- By geography, North America captured a 38.25% revenue share in 2025; the Asia-Pacific region is the fastest-growing, with a 24.05% CAGR from 2025 to 2031.
Note: Market size and forecast figures in this report are generated using Mordor Intelligence’s proprietary estimation framework, updated with the latest available data and insights as of 2026.
Global Mobile Analytics Market Trends and Insights
Drivers Impact Analysis*
| Driver | (~) % Impact on CAGR Forecast | Geographic Relevance | Impact Timeline |
|---|---|---|---|
| Smartphone proliferation generates exabytes of behavioral data | +4.2% | Global; strongest in Asia-Pacific and emerging markets | Medium term (2-4 years) |
| Explosive growth of mobile-commerce transactions | +5.1% | Global; concentrated in North America, Europe, Asia-Pacific | Short term (≤2 years) |
| Rapid enterprise shift to cloud-native analytics platforms | +3.8% | Led by North America, Europe; Asia-Pacific following | Medium term (2-4 years) |
| Rising mobile advertising budgets driving demand for in-app insights | +4.6% | Global; emphasis on mature ad markets | Short term (≤2 years) |
| AI-powered predictive analytics enabling hyper-personalization | +3.9% | Early uptake in North America, Europe; global expansion | Long term (≥4 years) |
| On-device, privacy-preserving analytics frameworks | +2.8% | Global, driven by compliance requirements | Long term (≥4 years) |
| Source: Mordor Intelligence | |||
Smartphone proliferation generates exabytes of behavioral data.
Global smartphone users reached 6.8 billion in 2024, each device emitting roughly 2.5 GB of behavioral signals per month. Continuous streams of taps, scrolls, and location pings give enterprises fine-grained views of customer journeys, and 5G bandwidth makes real-time inference feasible. Retail apps now mine micro-gestures such as scroll velocity to predict purchase intent with up to 89% accuracy. [1] Processing at device edge is gaining ground to reduce latency and safeguard privacy, prompting vendors to ship lightweight SDKs capable of local computation. These SDKs shrink data transfer volumes and meet tightening privacy mandates while keeping performance intact, cementing edge analytics as a key value driver for the mobile analytics market.
Explosive growth of mobile-commerce transactions
Mobile commerce generated 58.9% of global e-commerce value in 2024, placing heavy emphasis on real-time journey tracking within apps. China alone processed USD 49.2 trillion in mobile payments in 2024, fueling demand for fraud detection and multi-touch attribution. [2] Social commerce and live-stream shopping create complex, rapid funnels that standard web tools cannot map. Vendors respond with specialized modules that stitch together purchase pathways across chat, video, and in-app stores within seconds, reinforcing the strategic relevance of the mobile analytics market to omnichannel growth agendas.
Rapid enterprise shift to cloud-native analytics platforms
Cloud deployments now host 76.43% of mobile analytics workloads, up from 61% in 2022, because elastic compute is essential for events. [3] Amazon Web Services logged a 340% annual rise in mobile analytics ingestion during 2024. Cloud scale supports cross-platform identity stitching, churn prediction, and A/B testing that would strain on-premise clusters. Latency-sensitive apps are adopting regional edge nodes, and sovereignty concerns are pushing hybrid strategies whereby sensitive identifiers stay on-premise while behavioral data lands in the cloud for modeling. The pattern accelerates cloud-centric innovation across the mobile analytics market.
Rising mobile advertising budgets are driving demand for in-app insights.
Advertisers invested USD 362 billion in mobile campaigns in 2024, 69.4% of total digital spend. In-app placements register 88% better engagement than mobile web, pushing brands to request deeper attribution. Gaming studios, for instance, use analytics to time rewarded-video spots, lifting completion by 34%. Apple’s App Tracking Transparency cut deterministic identifiers, so vendors pivot to probabilistic matching and contextual triggers. First-party data strategies and predictive models now underpin budget allocation, sustaining double-digit expansion of the mobile analytics market.
Restraints Impact Analysis*
| Restraint | (~) % Impact on CAGR Forecast | Geographic Relevance | Impact Timeline |
|---|---|---|---|
| Stringent data-privacy regulations such as GDPR and CCPA | -2.3% | Europe, North America; spreading worldwide | Medium term (2-4 years) |
| High risk of mobile data security breaches | -1.8% | Global; greater in regions with weak cybersecurity | Short term (≤2 years) |
| Apple’s App Tracking Transparency limits attribution data | -2.1% | Global iOS ecosystem | Short term (≤2 years) |
| SDK fragmentation causing app-performance overhead | -1.4% | Global; acute for low-spec devices in emerging markets | Medium term (2-4 years) |
| Source: Mordor Intelligence | |||
Stringent data-privacy regulations such as GDPR and CCPA
Enterprises allocate about USD 1.3 million per year to keep mobile analytics stacks GDPR-ready. California’s CCPA extends similar duties to large U.S. markets, while Brazil and India draft parallel laws. Vendors embed differential privacy and federated learning so models run on decentralized data, minimizing raw collection. Google’s Privacy Sandbox for Android exemplifies this pivot, replacing cross-app identifiers with aggregated signals. Compliance lifts barriers to entry and trims the attainable growth curve for the mobile analytics market, even as it differentiates platforms that master privacy-by-design engineering.
Apple’s App Tracking Transparency limits attribution data.
Opt-in rates hover near 25%, sharply reducing deterministic user graphs. E-commerce apps lose visibility into social-discovery-to-purchase funnels, eroding ad ROI calculation accuracy by up to 30%. Vendors scramble to craft probabilistic models and SKAdNetwork integrations, yet benchmarking shows 15-30% lower precision than legacy IDFA-based tracking. First-party data activation gains salience, but smaller publishers struggle to reach the requisite scale, curbing potential spend and slowing near-term revenue for the mobile analytics market.
*Our forecasts treat driver/restraint impacts as directional, not additive. The impact forecasts reflect baseline growth, mix effects, and variable interactions.
Segment Analysis
By Component: Services Gain Speed Amid Software Leadership
Software products contributed 68.62% of 2025 revenue, underscoring their role as the default entry point for most buyers in the mobile analytics market. Many enterprises favor visual, self-service dashboards that plug into existing data lakes and marketing clouds without extensive coding. Yet rising regulatory complexity and SDK integration pain points elevate consulting and managed services, propelling the segment at 25.4% CAGR to 2031. Implementation partners help migrate legacy tracking setups, deploy privacy-preserving models, and tune real-time personalization engines, workstreams that internal teams often lack bandwidth for. For heavily regulated sectors such as banking, external experts design GDPR-compliant funnels that retain predictive strength while lowering data collection footprints.
Managed services address skill shortages for SMEs by bundling maintenance, data engineering, and experimentation support under subscription. As a result, services revenue captures an expanding slice of the mobile analytics market, even though core software still anchors budget line items. Vendors differentiate via industry playbooks-for instance, healthcare templates that expedite HIPAA alignment. The trend suggests a future where outcome-based service contracts accompany platform licenses, reinforcing mixed-revenue models across the mobile analytics market.

By Analytics Type: Behavioral Insights Drive Next-Level Growth
Application-analytics held a 34.98% share in 2025, thanks to its focus on acquisition, retention, and conversion metrics familiar to digital teams. Campaign analytics and service analytics follow, supporting ad attribution and customer support optimization. However, in-app behavioral analytics is scaling fastest at 24.1% CAGR as enterprises recognize that surface metrics miss crucial intent cues. Streaming services detect abandonment within 30 seconds of playback and push alternate content to improve engagement by 23%. Gaming studios read finger-pressure patterns to tune difficulty curves in real time, anchoring monetization.
Machine learning models have matured to interpret micro-gestures, context switching, and session cadence with high reliability. Consequently, behavioral analytics graduates move from mere diagnostics to predictive orchestration, positioning it as a cornerstone of value creation in the mobile analytics market. As adoption widens, the boundary blurs between behavioral analytics and AI-driven personalization, prompting vendors to bake inference engines directly into SDKs for latency-free decisioning.
By Deployment Mode: Cloud Supremacy Extends
Cloud hosts 75.88% of 2025 deployments and grows at 25.6% CAGR, underscoring elasticity as a strategic must-have. The mobile analytics market size for cloud delivery is forecast to widen its lead because hyperscalers offer serverless pipelines that ingest billions of events at marginal cost. AWS customers process over 100 billion daily events, demonstrating scale economies beyond on-premise capacity. Meanwhile, European banks pursue hybrid patterns that keep personally identifiable information on in-house clusters while sending behavioral vectors to the cloud for modeling.
On-premise remains relevant for defense and public-sector workloads that face strict sovereignty mandates, yet its share slips annually. Cloud vendors counter sovereignty objections by rolling out region-locked instances and encryption-in-use features. As these controls mature, residual resistance is expected to taper, cementing cloud as the primary battleground for innovation across the mobile analytics market.
By Organization Size: SMEs Democratize Advanced Analytics
Large enterprises supplied 62.85% of revenue in 2025, leveraging scale to embed analytics across hundreds of mobile assets. Customized attribution models and cross-device identity graphs are routine inside big-tech and tier-one retail. But SMEs post the sharpest climb at 25.5% CAGR as low-code interfaces and per-seat pricing lower entry barriers. Indie merchants on Shopify, for example, deploy analytics to fine-tune checkout flows and lift basket conversion without coding expertise.
Cloud-native vendors pre-package templates for onboarding, engagement, and monetization, shrinking time-to-value to days rather than months. As SMEs adopt, the mobile analytics market benefits from volume expansion and diversified use cases ranging from hyper-local food delivery to tele-veterinary services. This democratization also pressures vendors to simplify dashboards and abstract data science, reinforcing a user-centric design ethos.
By End-User Vertical: Healthcare Races Ahead
Retail and e-commerce controlled a 22.55% share in 2025, mirroring their dependence on funnel optimization. BFSI ranks second, deploying behavioral signals to flag fraud and tailor credit products. Government agencies embrace analytics for citizen-service KPIs, while telecom operators optimize app self-care tools. Healthcare and life sciences, though smaller today, surge at a 23.7% CAGR as telemedicine, remote monitoring, and digital therapeutics expand. Behavioral analytics improves medication adherence by 40% in pilot programs.
Regulatory backing for digital health-such as relaxed reimbursement rules for virtual visits, intensifies demand. Vendors are tailoring HIPAA-compliant SDKs that store protected health information locally while exporting anonymized signals for cohort trends. Expect health-specific feature sets like symptom-progression dashboards to proliferate, bolstering vertical diversification inside the mobile analytics market.
Geography Analysis
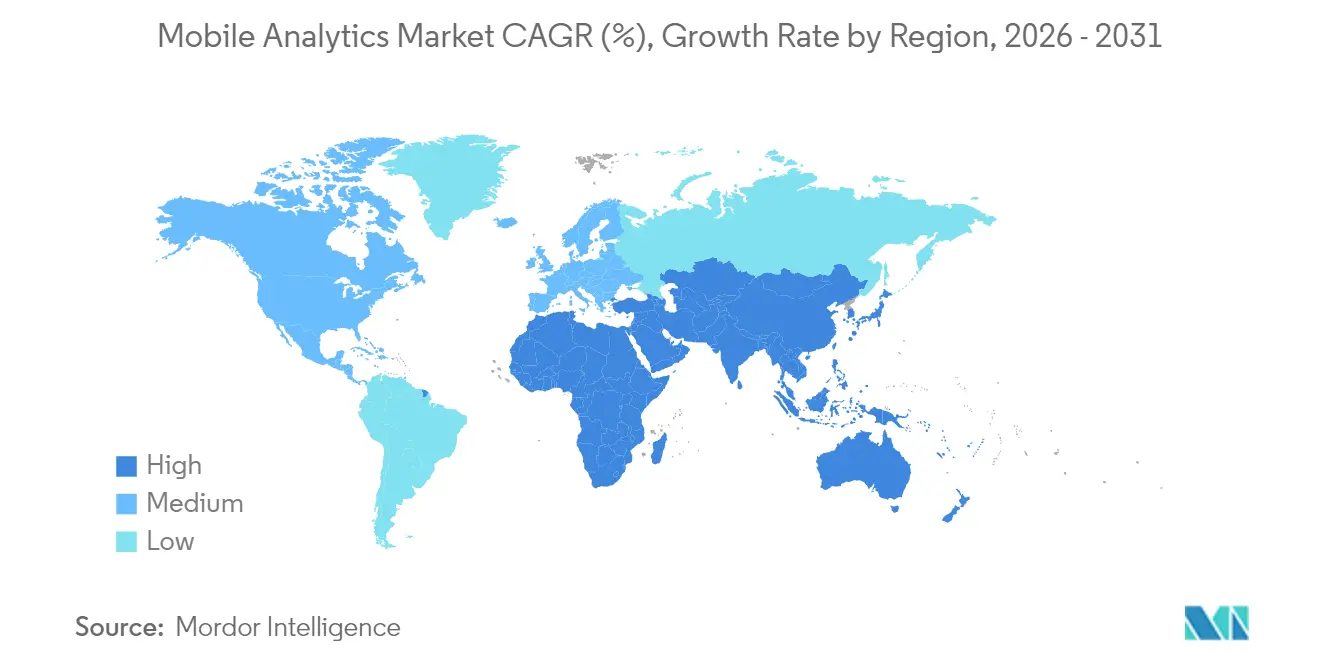
North America produced 38.25% of 2025 revenue owing to entrenched digital ad ecosystems, high mobile spend per capita, and robust venture funding. U.S. lawmakers shaped the regulatory agenda through CCPA, which spurred nationwide adoption of privacy-by-design data architectures. Canada shows momentum in fintech analytics, while Mexico’s expanding e-commerce base creates new white space for vendors that localize Spanish-language dashboards. The region’s deep technical workforce accelerates experimentation with edge AI, reinforcing its leadership in the mobile analytics market.
Asia-Pacific registers the fastest expansion at 24.05% CAGR through 2031. Penetration surpasses 85% in China, India, and Southeast Asia, and government schemes such as Digital India promote mobile-first citizen services. China’s social-commerce giants capture streams of voice, video, and chat that require petabyte-scale analytics, while India’s UPI framework fuels payment data growth. Japan and South Korea leverage 5G to power low-latency gaming insights, and Australia emphasizes CX optimization for banking and travel apps. Fragmented data-protection rules create integration hurdles, yet cross-border providers that secure localized hosting win share, highlighting Asia-Pacific as the prime acceleration engine in the mobile analytics market.
Europe grows steadily under tight GDPR oversight, favoring vendors with advanced consent orchestration. Germany pioneers industrial IoT analytics embedded in connected-car apps, the U.K. capitalizes on open banking trends, and France innovates in media streaming intelligence. Russia enforces compulsory data localization, isolating its ecosystem and opening room for domestic players. Despite a slower regional CAGR, Europe’s policy influence steers global roadmaps, making compliance features developed for EU clients standard elsewhere within the mobile analytics market.
Regulatory Landscape
Mobile analytics vendors operate under intersecting privacy, platform, and AI governance regimes that shape what data can be collected, stored, and used for profiling of mobile behavioral activity. In the EU, the AI Act (Regulation (EU) 2024/1689) entered into force in 2024 and applies from 2 August 2026, adding risk-based obligations for certain AI uses that can overlap with analytics-driven profiling and automated decisioning. In parallel, national data protection authorities keep publishing mobile-specific guidance, including France's CNIL amended Recommendation on mobile applications (Deliberation No 2025-024) dated 8 April 2025, which reinforces rules around terminal access and related consent expectations.
Outside Europe, regulatory approaches are tightening in ways that increase compliance fragmentation for global deployments. Canada tabled Bill C-36 (Protecting Privacy and Consumer Data Act) on 1 June 2026, proposing a Digital Safety and Data Protection Commission of Canada, and placing more emphasis on consumer and childrens data that map to app measurement stacks. South Korea's Personal Information Protection Commission (PIPC) also announced a shift toward a more risk-proportionate framework for AI-era data use, underscoring how some jurisdictions are trying to align AI development with privacy controls, a factor that influences how mobile analytics processing, modeling, and data residency are designed.
Value Chain Analysis
The mobile analytics value chain begins with data generation and collection inside apps and mobile web experiences, where SDKs, tagging plans, consent flows, and event schemas capture behavioral signals (taps, scrolls, sessions, purchases). The data then moves through ingestion and processing layers, often via cloud-native pipelines and data warehouses, before activation in downstream systems such as marketing automation, attribution, experimentation, and customer engagement. Platform owners and standards sit upstream as gatekeepers through OS and ad ecosystem controls, including privacy constraints in iOS and consent signaling requirements in major ad networks, which in turn limit which identifiers and events can be used for measurement.
Key suppliers and intermediaries include analytics and product analytics vendors, mobile measurement partners, cloud infrastructure providers, and implementation and managed service firms that operationalize instrumentation, governance, and experimentation programs. The chain is increasingly shaped by architectural shifts from client-side SDK sprawl toward server-side and API-first collection, aimed at reducing app-performance overhead and staying within privacy limits, alongside publisher-side transparency and supply path optimization practices in app advertising supply chains (including app-ads.txt). Vendor roadmaps also point to AI-assisted workflows inside analytics, increasing demand for higher-quality event data, stronger identity governance, and tighter integrations across the toolchain.
Competitive Landscape
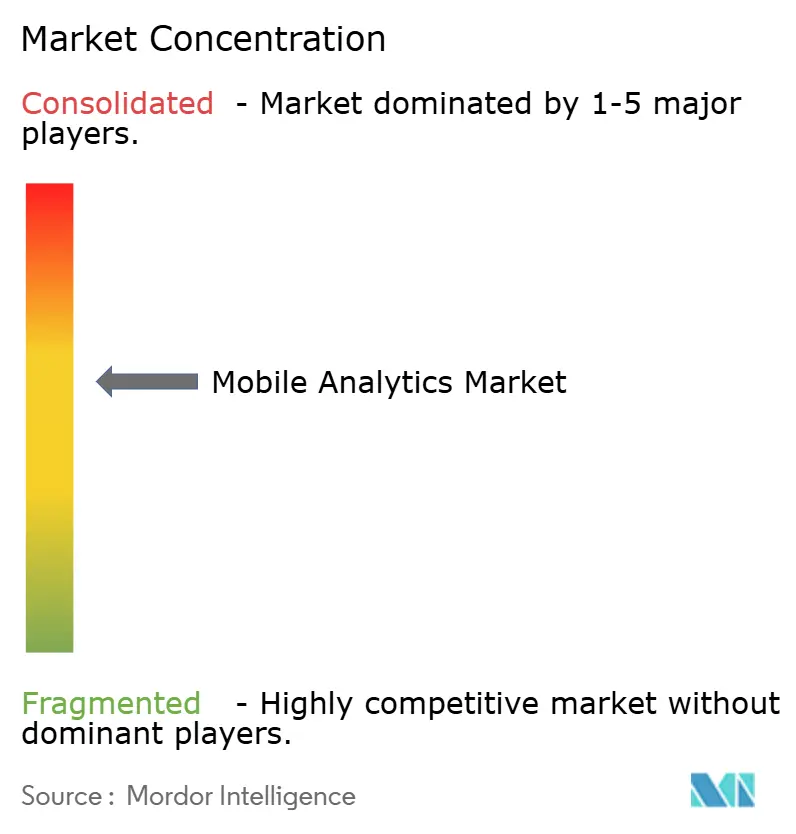
Market fragmentation is moderate: the top five vendors hold roughly 45% revenue, leaving ample space for vertical specialists. Platform owners such as Google, Apple, and Microsoft wield distribution advantage thanks to native OS hooks, while independents like Mixpanel, Amplitude, and AppsFlyer differentiate through deep-dive product analytics and attribution science. Apple’s App Tracking Transparency reshaped playbooks by stripping out IDFA, propelling demand for predictive, privacy-centric measurement. Google allocates USD 2 billion to its Privacy Sandbox to future-proof ad targeting.
Two strategy archetypes dominate the mobile analytics market. Ecosystem integrators bundle analytics with cloud or advertising suites, monetizing data synergies. Best-of-breed specialists focus on niche use cases—gaming retention loops, fintech fraud, or health compliance—commanding price premiums for domain depth. Edge-computing analytics and federated learning represent frontier battlegrounds where start-ups can leapfrog incumbents. Overall rivalry intensifies as vendors race to knit privacy, AI, and real-time orchestration into cohesive products that win enterprise wallets.
Recent consolidation underscores the competitive tempo. Sensor Tower’s USD 1.2 billion buyout of Data.ai’s analytics group forged the largest independent intelligence stack, merging store-ranking with in-app usage metrics. Microsoft Azure’s serverless Mobile Analytics Accelerator touts 60% cost reductions, pressuring rivals on TCO. Amplitude’s acquisition of Experiment integrates feature flags with behavioral data, illustrating the shift toward one-stop experimentation hubs. These maneuvers signal an arms race toward full-cycle insight platforms in the mobile analytics market.
Mobile Analytics Industry Leaders
-
Adobe Inc.
-
Alphabet Inc. (Google LLC)
-
Amplitude, Inc.
-
AppsFlyer Ltd.
-
Branch Metrics, Inc.
- *Disclaimer: Major Players sorted in no particular order
Market Opportunities and Future Outlook
Opportunities are expanding as privacy constraints and ad ecosystem changes push enterprises toward first-party, consent-aware analytics architectures and tooling that reduces reliance on device identifiers. Google policy and framework changes are translating into implementation work for app publishers and marketers: IAB Transparency and Consent Framework (TCF) v2.3 became mandatory in March 2026 for apps using Google AdMob to continue serving ads, and Google Play policy updates dated January 28, 2026 added requirements around explicit user consent for data collection tied to Digital Markets Act expectations. This creates room for vendors and service partners that package consent orchestration, data minimization, and measurement continuity, including modeled attribution and cohort techniques, without degrading app performance.
Vendor consolidation and productization around AI-native analytics also open space for differentiated platforms that blend product analytics, growth analytics, and monetization insights into faster decision loops. In May 2026, InMobi acquired MobileAction to add AI-powered app analytics and App Store Optimization into its stack, signaling demand for integrated iOS growth workflows that combine discovery, conversion, and measurement. In February 2026, Amplitude introduced agentic AI analytics capabilities that continuously analyze product usage and recommend actions, reinforcing buyer interest in analytics that connects behavioral signals to experiment design, prioritization, and execution inside product and marketing teams.
Recent Industry Developments
- June 2026: Adobe announced new technology and agency partnerships aimed at accelerating agentic AI adoption across its customer experience offerings. The move strengthens ecosystem-driven delivery of analytics and optimization workflows, and raises the bar for integrated measurement-plus-activation capabilities in enterprise stacks.
- July 2025: AppsFlyer debuted an AI-powered Model Context Protocol (MCP) capability to streamline access to attribution data and campaign execution. By making measurement data easier to operationalize across tools and teams, it tightened the linkage between mobile analytics outputs and in-flight marketing actions.
- August 2024: The EU AI Act entered into force, establishing a risk-based framework for AI systems used in the European Union. For mobile analytics providers that embed AI to profile behavior or automate decisions, the legislation elevates governance, documentation, and control requirements that influence product design and EU go-to-market readiness.
Research Methodology Framework and Report Scope
Market Definition and Coverage
This market covers software and related services used to collect, measure, and analyze data from mobile apps and mobile websites so organizations can understand user behavior and improve acquisition, engagement, and performance outcomes.
Scope exclusions: This sizing excludes general web-only analytics, telecom network analytics, and purely offline market research services that do not produce mobile usage insights.
Segmentation Overview
- By Component
- Software
- Services
- By Analytics Type
- Application-Analytics
- Campaign-Analytics
- Service-Analytics
- In-App Behavioral Analytics
- By Deployment Mode
- Cloud
- On-Premise
- By Organisation Size
- Large Enterprises
- Small and Medium Enterprises (SMEs)
- By End-User Vertical
- Retail and E-commerce
- Banking, Financial Services and Insurance (BFSI)
- Government and Public Sector
- Information Technology and Telecommunications
- Media and Entertainment
- Travel and Hospitality
- Healthcare and Life-Sciences
- By Geography
- North America
- United States
- Canada
- Mexico
- Europe
- Germany
- United Kingdom
- France
- Russia
- Rest of Europe
- Asia-Pacific
- China
- Japan
- India
- South Korea
- Australia
- Rest of Asia-Pacific
- Middle East and Africa
- Middle East
- Saudi Arabia
- United Arab Emirates
- Rest of Middle East
- Africa
- South Africa
- Egypt
- Rest of Africa
- Middle East
- South America
- Brazil
- Argentina
- Rest of South America
- North America
Data Sources, Market Sizing, and Validation
Desk Research
Desk research was used to set the market boundary, build the first set of assumptions, and create reality checks for adoption and spend levels. We leaned on public indicators such as IT and digital-economy statistics from sources like the International Telecommunication Union (ITU), the World Bank, the OECD, and national telecom and digital ministries, and then complemented it with privacy and measurement direction from sources such as the US Federal Trade Commission (FTC) and the European Data Protection Board (EDPB).
To connect demand with budgets, we also reviewed company filings, earnings call notes, investor presentations, association publications, and trusted tech press coverage that discusses mobile measurement changes and data rules. Where needed, paid subscriptions focused on company financials and intelligence, news and financials, and broad patent databases were used to cross-check revenue exposure, product focus, and M and A activity. The desk sources listed here are illustrative only, and many other public references were used for data collection, validation, and clarification.
Primary Interviews and Surveys
Primary work was used to pressure-test the desk assumptions and tighten the model inputs, especially where public data is not specific enough to mobile analytics. We spoke with a mix of solution providers, implementation partners, and large buyers across key verticals, and we also rechecked conclusions with regional experts across APAC, EMEA, and the Americas so local privacy rules and go-to-market patterns were not averaged out.
Distribution of primary research fieldwork respondents
| Company type | Respondent position | Region |
|---|---|---|
| Top tier: 34% | CXOs: 15% | APAC: 49% |
| Mid tier: 44% | Functional/Unit leaders: 34% | EMEA: 33% |
| Smaller Players: 22% | Managers: 51% | Americas: 18% |
Market-Sizing & Forecasting
The market was sized using a top-down approach where overall digital analytics and software spend signals are rebuilt into a mobile-specific demand pool, and then adjusted using mobile app usage intensity and enterprise adoption patterns. To keep totals realistic, we corroborated results with selective bottom-up approximations, such as sampled vendor revenue exposure, channel feedback, and a reasonableness check built from average contract values multiplied by a limited set of enterprise user counts.
Key inputs that influenced the model included mobile app usage growth and smartphone penetration trends, the share of customer journeys happening in mobile channels, the pace of in-app advertising and mobile commerce activity, privacy and consent rule changes that affect measurement methods, and the mix shift toward cloud deployments and subscription pricing. When interview feedback showed gaps in smaller-country reporting, we used proxy indicators like device base and enterprise digital intensity to fill missing pieces before recomputing regional totals.
Forecasting relied mainly on scenario analysis, since this market is strongly shaped by privacy enforcement timing, cookie and identifier changes, and budget cycles. In each scenario, the main drivers were translated into growth rates by region and major vertical, and then the outputs were reconciled back to the global total so the story stayed consistent.
Data Validation & Update Cycle
Outputs were checked against independent signals such as regional enterprise software spending direction, mobile engagement trends, and the observed cadence of privacy-led measurement shifts. When a country or vertical output looked out of line with those signals, the assumptions were reopened, and follow-up calls were triggered to confirm whether the variance came from definition, pricing, or adoption.
Before sign-off, the model goes through multi-step analyst reviews where calculations, currency handling, and year alignment are rechecked, followed by a final consistency pass across all tables and narratives. Reports are refreshed annually, and interim updates are made when material events occur, such as major regulation changes or large platform measurement updates. Right before delivery, we perform a fresh review so the published view reflects the latest available information.
Mordor Intelligence's Global Mobile Analytics Market Market Size Measured Against Other Published Estimates
Published market sizes for mobile analytics can vary even when the topic label looks the same, because each publisher draws the line differently on what counts as mobile analytics revenue. Differences also show up when one study anchors on enterprise spend, while another leans more on product feature breadth or on a single-year revenue rollup.
The benchmark table shows a clear spread across years and totals, and in Mordor Intelligence's model the market is counted as tools and technologies tied to mobile application and mobile website data measurement, which tends to exclude adjacent categories like broad web analytics or telecom network analytics that some sources may blend in.
Benchmark comparison
| Source | Market Size | Gaps in Research Methodology |
|---|---|---|
| Mordor Intelligence | USD 11.19 B (2026) | |
| Industry Data Publisher A | USD 14.20 B (2025) | Uses an earlier base year and appears to include a wider component scope (software plus services across a broad set of application uses), which can inflate totals when mobile engagement tools are counted beyond core measurement and analysis. |
| Market Tracker B | USD 8.10 B (2024) | Anchors on an older year and frames the market around in-app behavior software, which can undercount campaign and service analytics revenue that is still purchased for mobile website and cross-channel measurement. |
Overall, the differences line up with two practical issues, which are year alignment and how far the definition stretches into adjacent digital tools. By keeping the scope tied to measurable mobile app and mobile web analytics activity, and then validating assumptions through repeated checks, the estimate stays traceable to clear demand drivers and repeatable steps.
Key Questions Answered in the Report
What is the current value of the mobile analytics market?
The mobile analytics market size is USD 11.19 billion in 2026.
How fast is revenue expected to grow over the next five years?
Revenue is projected to climb to USD 32.33 billion by 2031 at a 23.65% CAGR.
Which deployment mode is gaining the most traction?
Cloud deployment dominates with 75.88% share in 2025 and is growing at 25.6% CAGR.
Why are in-app behavioral metrics becoming so important?
They capture gesture-level signals that predict intent more accurately than basic funnel metrics, driving higher personalization and retention.
Which region will add the most incremental revenue?
Asia-Pacific, expanding at a 24.05% CAGR, will contribute the largest incremental gains.
How are privacy regulations affecting vendor roadmaps?
GDPR, CCPA, and ATT compel vendors to adopt differential privacy, federated learning, and first-party data approaches, reshaping product features and go-to-market strategies.