Market Overview
| Study Period | 2017 - 2030 |
|---|---|
| Base Year For Estimation | 2024 |
| Forecast Data Period | 2025 - 2030 |
| Market Size (2025) | USD 1.38 Billion |
| Market Size (2030) | USD 1.8 Billion |
| Growth Rate (2025 - 2030) | 5.52% CAGR |
| Market Concentration | Medium |
Major Players*Disclaimer: Major Players sorted in no particular order Image © Mordor Intelligence. Reuse requires attribution under CC BY 4.0. | |

Milk Protein Market Analysis by Mordor Intelligence
The Milk Protein Market size is estimated at 1.38 billion USD in 2025, and is expected to reach 1.8 billion USD by 2030, growing at a CAGR of 5.52% during the forecast period (2025-2030).
The milk protein industry is experiencing significant transformation driven by evolving global health and wellness trends, particularly in response to rising obesity rates worldwide. This shift is evidenced by the increasing focus on milk protein-enriched products across various food and beverage categories. In China, where approximately 27% of the population was reported as obese in 2022, affecting over half a billion people, there has been a notable surge in demand for healthier dairy protein alternatives. The industry has responded by developing innovative formulations that cater to health-conscious consumers while maintaining product functionality and taste profiles. This health-consciousness trend has led to the emergence of new product categories and the reformulation of existing products to include higher nutritional protein content.
Consumer behavior patterns are increasingly influenced by active lifestyle choices and fitness awareness. In Saudi Arabia, approximately 48.2% of the population engaged in regular physical activities for at least 30 minutes weekly in 2021, highlighting the growing emphasis on health and wellness. This trend is further exemplified by large-scale fitness events such as the Dubai Run, which attracted over 193,000 participants in 2022. The supplement industry has particularly benefited from this trend, with approximately 75% of Americans incorporating dietary supplements into their daily routines, including 79% of female adults and 74% of male adults.
Product innovation and technological advancements are reshaping the industry landscape, with manufacturers focusing on developing specialized milk protein ingredients for specific applications. The industry has witnessed significant developments in protein extraction and processing technologies, leading to improved product functionality and applications. Companies are investing in research and development to create novel functional protein formulations that offer enhanced solubility, stability, and nutritional profiles. These innovations are particularly evident in the beverage sector, where manufacturers are developing protein supplement-enriched drinks with improved taste and texture profiles.
Regional market dynamics are evolving with changing consumer preferences and regulatory frameworks. The harmonization of food laws between regions, particularly between Turkey and the European Union, has facilitated increased trade and investment opportunities. Manufacturers are expanding their geographical presence through strategic initiatives, as exemplified by major dairy protein ingredient makers establishing offices in key markets like Dubai to enhance service integration with Middle Eastern and African customers. This expansion is accompanied by efforts to develop products that cater to local tastes and preferences while meeting international quality standards and regulations.
Global Milk Protein Market Trends and Insights
Rising health awareness and growing demand from millennials are driving the market
- Rising health awareness and a surge in demand from millennials are driving the sports nutrition segment. The segment is witnessing an upswing, with consumers increasingly seeking protein-enriched beverages and dietary supplements, citing benefits like muscle maintenance and growth. For instance, the 2023 CRN Consumer Survey on Dietary Supplements reveals that 74% of US adults consume dietary supplements, with 55% identified as "regular users".
- Sports drinks, traditionally marketed for their electrolyte-replenishing properties during intense physical activities, have evolved to emphasize benefits such as increased carbohydrates, salts, and enhanced performance during workouts. This evolution aligns with the shift toward active and healthier lifestyles. The sports nutrition segment has seen a boost from growing participation in sports among middle-aged and elderly populations. For example, in 2022, the rate of regular sports participation among Asian youth aged 6 to 12 years surged to 42%, up from 35% in 2019.
- North America stands at the forefront of the sports nutrition segment, driven by a rising athletic trend, health concerns, and dietary habits. The market is expected to benefit from the ongoing trend of flavor innovations that boast health advantages. Meanwhile, Europe is emerging as a significant player, with key markets like the United Kingdom, Germany, Spain, and France commanding a major share of the market. In 2022, statistics revealed that 38% of adults in the European Union engaged in sports or exercise at least once a week, with 6% committing to it five times weekly.

Understand The Key Trends Shaping This Market
Download PDF
Milk continues to contribute as a major animal protein source
- Milk is a key source of financial revenue for small-scale farmers and offers relatively quick returns. This development is mostly due to an increase in the number of milk-producing animals and a tangible expansion in yield figures rather than an increase in production per head. Global milk production increased by more than 59% in the previous three decades, from 530 million tons in 1988 to 843 million tons in 2018, and global milk production in 2022 was projected to reach 937 million tons, up 1.0% from 2021. According to production data from the Food and Agriculture Organization Corporate Statistical Database (FAOSTAT), India is the highest milk producer in the world. India contributed 24% of global milk production from 2021 to 2022.
- Asia, led by India and Pakistan's efficiency in milk collection and China's burgeoning large-scale farms, is poised to be the linchpin of global milk production. While North America, Central America, and the Caribbean saw moderate growth in milk output in 2022, largely driven by enhanced yields, Europe, South America, and Oceania faced projections of declining production. This decline is attributed to diminishing dairy cattle numbers, a rising shortage of skilled labor, and subpar pasture quality.
- France experienced a notable dip in milk supply in the European Union in January 2021, down over 3% from the same month in 2020, settling at just over 2 billion liters. This translated to a production drop of more than 70 million liters compared to January 2020. The decline was primarily linked to harsh early 2021 weather, alongside elevated feed prices and substandard silage quality.

Understand The Key Trends Shaping This Market
Download PDF
OTHER KEY INDUSTRY TRENDS COVERED IN THE REPORT
- Rising trend of clean-label baby food and escalating strategic investments are driving the market globally
- Healthy trends in beverages are impacting market growth
- A rise in the demand for single-serve packets may augment production
- Dairy alternatives to witness significant growth
- Meat protein alternatives are revolutionizing the meat segment
- Healthy snacking preferences with growth in online platforms are supporting market growth
- Natural ingredients, coupled with product specificity, are largely driving the segmental sales
- Europe is the leading market with a high demand for bread and biscuits
- Growing preference for convenient breakfast options may augment the market
- Increase in at-home consumption and demand for healthy confectionery products
- Growing nutritional concerns for aging populations drive the demand for medical nutrition products globally
- Ready-to-cook and frozen foods have witnessed a surge in sales
- The increasing demand for compound feed containing functional ingredients is affecting sales within this segment
- Consumption and usage of animal protein in cosmetics and nutricosmetics are supporting the market’s growth globally
Segment Analysis: Form
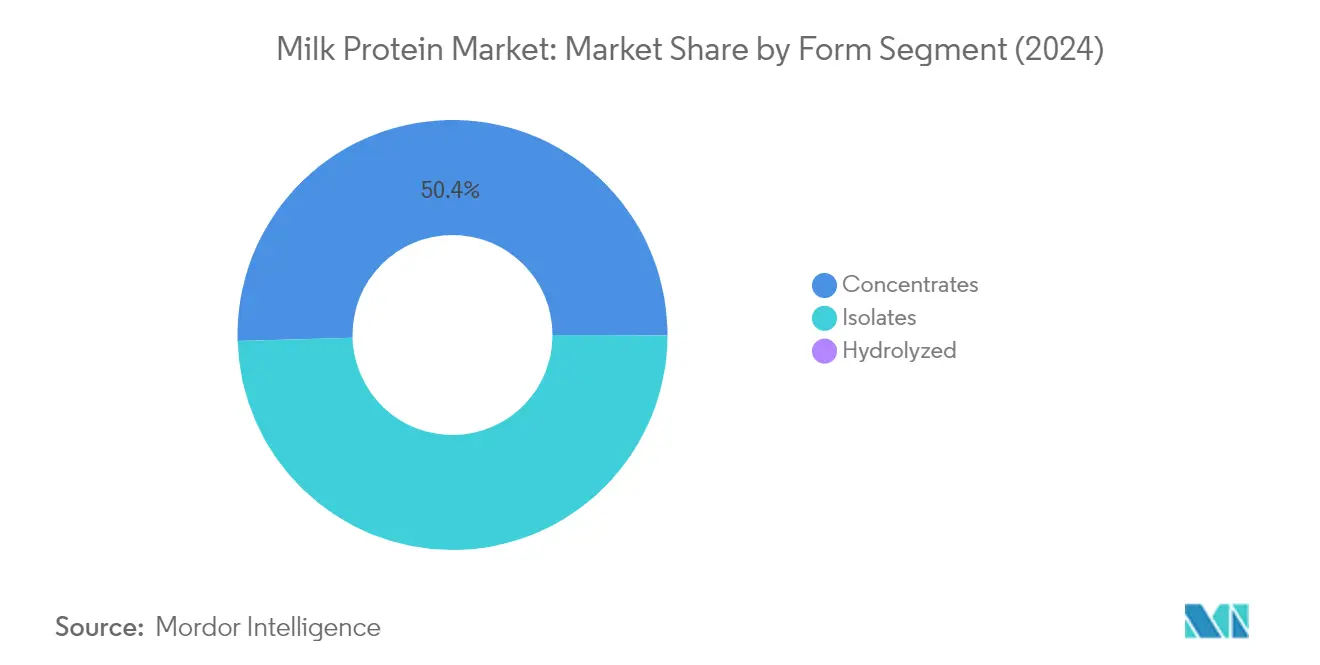
Concentrates Segment in Milk Protein Market
Milk protein concentrates (MPC) dominate the global milk protein market, commanding approximately 50% market share in 2024. The segment's leadership position is attributed to its extensive functionality and cost-effectiveness, being approximately 30% lower priced than isolates. MPCs are complete dairy proteins containing both casein protein and whey protein, available in protein concentrations ranging from 42% to 85%. Their widespread adoption is driven by versatile applications across beverages, therapeutic foods, enteral meals, and protein bars. The minimal processing involved in MPC production contributes to their lower final costs, making them particularly attractive for manufacturers seeking economical protein fortification solutions. Their effectiveness in egg replacement applications has also boosted their demand, especially in regions concerned with avian flu outbreaks.
Hydrolyzed Segment in Milk Protein Market
The milk protein hydrolysate segment is projected to exhibit the strongest growth trajectory in the milk protein market from 2024 to 2029, with an anticipated CAGR of approximately 5%. This growth is primarily driven by its expanding applications in the personal care and cosmetics industry, where it serves as a conditioning and moisturizing agent. Hydrolyzed milk protein is particularly valued for its excellent moisturizing properties, providing an optimal balance of nutrients to the skin and hair. Its anti-irritant and protective properties make it a preferred ingredient in various personal care applications, including body wash, lotions, creams, shampoos, and conditioners. The segment's growth is further supported by increasing consumer awareness of natural and protein-based personal care products.
Remaining Segments in Milk Protein Market Form Segmentation
The milk protein isolate (MPI) segment represents another significant portion of the market, offering the highest protein content among all forms at over 90%. MPIs are particularly valued in the sports nutrition and performance supplements industry due to their superior protein concentration and lower carbohydrate content. Their effectiveness in low-acid beverages and premium protein applications has established them as a premium ingredient choice, despite their higher cost compared to concentrates. The segment's growth is supported by increasing demand for lactose-free, protein-enriched food products and the rising preference for clean-label, high-protein ingredients in various food and beverage applications.
Segment Analysis: End User
Food & Beverages Segment in Milk Protein Market
The Food & Beverages (F&B) segment maintains its dominant position in the global milk protein market, accounting for approximately 53% of the total market share in 2024. This substantial market presence is primarily driven by the extensive application of milk proteins in various food and beverage products, particularly in the bakery, snacks, and beverage industries, which together constitute about 85% of F&B applications. The segment's leadership is reinforced by milk proteins' superior functionality in low-acid beverages, where they demonstrate better solubility and heat stability compared to other protein alternatives. Additionally, milk proteins' high efficacy in egg replacement has significantly boosted their demand in the bakery industry, especially in regions where avian flu concerns persist. The growing consumer awareness about protein-rich diets and the increasing incorporation of protein into mainstream food and beverage products continue to strengthen this segment's market position.
Supplements Segment in Milk Protein Market
The Supplements segment is emerging as the fastest-growing sector in the milk protein market, projected to expand at a CAGR of approximately 6% during 2024-2029. This remarkable growth is primarily driven by two key sub-segments: baby food and infant formula, and sports/performance nutrition. The segment's expansion is fueled by increasing health consciousness among consumers and the growing preference for protein-based dietary supplements. The sports and performance nutrition sub-segment is particularly dynamic, with consumers increasingly recognizing milk protein's benefits in promoting muscle protein synthesis and reducing exercise-induced muscle damage. The baby food and infant formula sub-segment's growth is supported by milk protein's effectiveness as the least processed protein ingredient, making it an ideal choice for infant nutrition products.
Remaining Segments in End User Market
The Personal Care & Cosmetics and Animal Feed segments represent emerging opportunities in the milk protein market. The Personal Care & Cosmetics segment is gaining traction due to the increasing use of hydrolyzed milk protein in cosmetic formulations, particularly for its skin hydrating and moisturizing properties. This segment is witnessing innovation in product development, especially in Korean beauty brands that emphasize natural ingredients. The Animal Feed segment, while smaller in market share, plays a crucial role in specialized applications such as calf milk substitutes and poultry feed formulations. Both segments demonstrate the versatility of milk proteins beyond traditional food applications and represent potential growth areas as new applications continue to be developed.
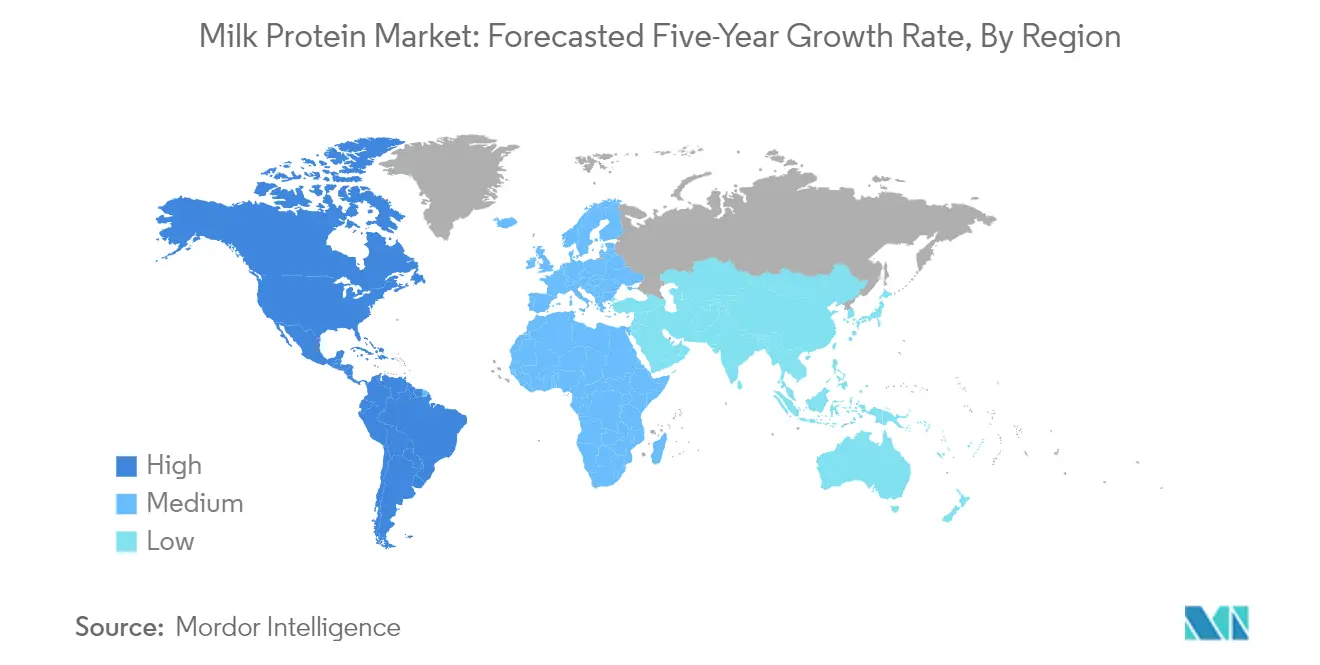
Milk Protein Market Geography Segment Analysis
Milk Protein Market in Africa
The African milk protein market demonstrates a dynamic landscape characterized by evolving consumer preferences and increasing health consciousness. The region's market is primarily driven by the growing demand in the supplements segment, particularly in sports nutrition and infant formula applications. The market shows strong potential in countries like Nigeria and South Africa, with increasing commercial activities reflecting heightened concerns over health and nutrition. The region's market structure is influenced by changing dietary patterns, though traditional consumption habits continue to play a significant role in market development.
Milk Protein Market in Nigeria
Nigeria emerges as the dominant force in the African milk protein market, holding approximately 34% market share in 2024. The country's market is primarily driven by the food and beverage sector, with significant consumption in baby food and bakery segments. The growing birth rate and low use of contraceptives among women have particularly boosted the demand for baby food applications. Nigerian manufacturers are increasingly utilizing novel baby food products, including specialized formulae for premature babies and those with specific dietary needs. The country's market is also benefiting from increased commercial activity and rising health awareness among consumers.
Milk Protein Market Growth Dynamics in Nigeria
Nigeria continues to demonstrate remarkable growth potential, with an expected growth rate of approximately 6% during 2024-2029. The country's growth trajectory is supported by the supplements segment, which is witnessing increased demand from the sports/performance nutrition sub-segment. The rising number of fitness enthusiasts and growing awareness about protein-rich diets are driving this growth. Additionally, the food and beverage sector is projected to record significant expansion, particularly in the bakery sub-segment, where milk proteins show high efficacy in gluten-free bakery goods. The market is further supported by increasing urbanization and rising disposable incomes.
Milk Protein Market in Asia-Pacific
The Asia-Pacific region represents a crucial market for milk proteins, characterized by diverse consumer preferences and rapid industrialization. The region's market is driven by increasing health consciousness, rising disposable incomes, and growing awareness about protein-rich diets. Countries like China, Japan, and India are witnessing significant growth in protein consumption, particularly in the sports nutrition and infant formula segments. The region's market is also benefiting from technological advancements in protein processing and increasing investments in research and development.
Milk Protein Market in China
China dominates the Asia-Pacific milk protein market, commanding approximately 34% market share in 2024. The country's market leadership is driven by the rising demand for specialist product categories such as newborn nutrition, clinical diets, sports, and weight training. The Chinese market benefits from a large consumer base increasingly focused on health and wellness products. The country's robust distribution network and strong manufacturing capabilities further strengthen its market position. Additionally, the growing prevalence of obesity and fitness awareness among Chinese consumers continues to drive demand for protein-enriched products.
Milk Protein Market Growth Dynamics in Malaysia
Malaysia emerges as the fastest-growing market in the Asia-Pacific region, with a projected growth rate of approximately 7% during 2024-2029. The country's growth is primarily driven by increasing health consciousness and rising demand for functional foods and beverages. Malaysia's market expansion is particularly notable in the sports nutrition segment, where milk proteins are gaining popularity among fitness enthusiasts. The country's growing middle class and increasing awareness about the benefits of protein consumption are further accelerating market growth. Additionally, the rising number of health clubs and fitness centers is creating new opportunities for milk protein applications.
Milk Protein Market in Europe
Europe represents a mature yet dynamic market for milk proteins, characterized by sophisticated consumer preferences and strong regulatory frameworks. The region benefits from advanced manufacturing capabilities and robust research and development infrastructure. Countries like Germany, France, and the United Kingdom lead the market with their innovative product developments and strong distribution networks. The European market shows particular strength in sports nutrition and infant formula applications, supported by increasing health consciousness among consumers.
Milk Protein Market in Germany
Germany stands as the largest market for milk proteins in Europe, driven by its strong food and beverage industry and increasing demand for protein-enriched products. The country's market leadership is supported by its advanced manufacturing capabilities and strong research and development infrastructure. German consumers show a particular preference for high-quality protein products, especially in the sports nutrition and infant formula segments. The country's robust distribution network and strong regulatory framework further strengthen its market position.
Milk Protein Market Growth Dynamics in Turkey
Turkey emerges as the fastest-growing market in Europe, driven by its young population and increasing health consciousness. The country's growth is supported by the harmonization achieved between Turkish and European Union food laws, attracting significant foreign investments. The Turkish market shows particular strength in the bakery segment, where milk proteins are widely used for their functional properties. The country's self-sufficiency in milk production and strong manufacturing capabilities further support its growth trajectory.
Milk Protein Market in Middle East
The Middle Eastern milk protein market demonstrates strong growth potential, driven by increasing health awareness and rising demand for protein-enriched products. The region's market is characterized by growing investments in domestic production capabilities and strong import networks. Saudi Arabia leads the market with its robust demand in the supplements segment, particularly in sports nutrition and infant formula applications. Iran shows the fastest growth potential, supported by its expanding food and beverage industry and increasing health consciousness among consumers. The region's market benefits from growing urbanization and rising disposable incomes, particularly in the Gulf Cooperation Council countries.
Milk Protein Market in North America
The North American milk protein market showcases advanced development with sophisticated consumer preferences and strong regulatory frameworks. The region benefits from extensive research and development activities and advanced manufacturing capabilities. The United States leads the market with its strong presence in sports nutrition and infant formula segments, while Mexico demonstrates the fastest growth potential driven by increasing health consciousness and rising demand for protein-enriched products. The region's market is characterized by strong innovation in product development and increasing focus on clean label products, supported by robust distribution networks and advanced technological capabilities.
Milk Protein Market in South America
The South American milk protein market shows significant growth potential, driven by increasing health consciousness and changing dietary preferences. The region benefits from favorable weather conditions and extensive dairy farming capabilities, particularly in major markets. Brazil leads the market with its strong presence in the food and beverage segment, especially in bakery applications, while Argentina shows the fastest growth potential supported by its expanding dairy industry and increasing demand for protein-enriched products. The region's market is characterized by growing investment in production capabilities and increasing focus on product innovation, particularly in sports nutrition and infant formula applications.
Get Analysis on Important Geographic Markets
Download PDF
Competitive Landscape
Top Companies in Milk Protein Market
The global milk protein manufacturer market is characterized by companies focusing on continuous product innovation and strategic partnerships to maintain their competitive edge. Major players are expanding their production capabilities through facility investments and geographical expansion, particularly in emerging markets. Companies are increasingly adopting clean-label initiatives and sustainable sourcing practices to meet evolving consumer preferences. Research and development efforts are concentrated on developing specialized protein ingredients for specific applications, from sports nutrition to infant formula. Operational agility is demonstrated through the optimization of supply chains and the integration of advanced processing technologies. Strategic collaborations with local distributors and ingredient suppliers have become crucial for market penetration and raw material security.
Consolidated Market Led By Global Players
The milk protein market exhibits a consolidated structure dominated by large multinational corporations with integrated operations across the dairy value chain. These established players leverage their extensive distribution networks, research capabilities, and brand equity to maintain market leadership. Regional players maintain a significant presence in specific geographies through specialized product offerings and local market knowledge. The industry is characterized by high entry barriers due to capital-intensive manufacturing processes and stringent quality requirements. Market consolidation continues through strategic acquisitions, particularly targeting companies with complementary product portfolios or strong regional presence.
The competitive landscape is shaped by companies with diverse business portfolios, ranging from specialized dairy ingredients manufacturers to large food conglomerates. European companies maintain a strong presence due to their advanced technological capabilities and established dairy farming infrastructure. Asian players are rapidly expanding their market presence through aggressive capacity expansion and product development initiatives. The industry witnesses frequent collaborations between manufacturers and research institutions to develop innovative protein solutions. Vertical integration strategies are increasingly adopted to ensure quality control and supply chain efficiency.
Innovation and Sustainability Drive Future Success
Success in the functional protein market increasingly depends on companies' ability to develop innovative products while maintaining sustainable practices. Market leaders are investing in advanced processing technologies to improve protein functionality and application versatility. Companies are focusing on developing specialized protein variants for specific end-user segments, particularly in high-growth areas like sports nutrition and clinical nutrition. Building strong relationships with dairy farmers and implementing transparent sourcing practices have become crucial for maintaining market position. Manufacturers are also expanding their organic and grass-fed protein offerings to capture premium market segments.
Future market success will require companies to address growing consumer concerns about environmental impact and animal welfare. Players must invest in sustainable production methods and implement comprehensive traceability systems. Regulatory compliance, particularly regarding health claims and labeling requirements, will continue to influence market dynamics. Companies need to maintain flexible production capabilities to address varying protein concentration requirements across different applications. Building strong relationships with end-users through technical support and customized solutions will become increasingly important. Market participants must also prepare for potential disruption from plant-based alternatives while maintaining focus on dairy protein quality and functionality improvements.
Milk Protein Industry Leaders
Agrial Enterprise
Fonterra Co-operative Group Limited
Glanbia PLC
Kerry Group PLC
Royal FrieslandCampina NV
- *Disclaimer: Major Players sorted in no particular order

Need More Details on Market Players and Competitors?
Download PDF
Recent Industry Developments
- November 2021: Lactalis Ingredients launched new high-protein product concepts using Pronativ® Native Micellar Casein and Pronativ® Native Whey Protein. Some of the derived concepts are high-protein shakes and high-protein pudding.
- August 2021: Lactalis India launched a protein-packed yogurt drink called Lactel Turbo Yoghurt Drink. The drink is available in mango and strawberry flavors.
- February 2021: FrieslandCampina Ingredients partnered with Cayuga Milk Ingredients for the production of its Refit milk proteins, MPI 90 and MPC 85.
Global Milk Protein Market Report Scope
Concentrates, Hydrolyzed, Isolates are covered as segments by Form. Animal Feed, Food and Beverages, Personal Care and Cosmetics, Supplements are covered as segments by End User. Africa, Asia-Pacific, Europe, Middle East, North America, South America are covered as segments by Region.Form
| Concentrates |
| Hydrolyzed |
| Isolates |
End User
| Animal Feed | ||
| Food and Beverages | By Sub End User | Bakery |
| Beverages | ||
| Breakfast Cereals | ||
| Condiments/Sauces | ||
| Dairy and Dairy Alternative Products | ||
| RTE/RTC Food Products | ||
| Snacks | ||
| Personal Care and Cosmetics | ||
| Supplements | By Sub End User | Baby Food and Infant Formula |
| Elderly Nutrition and Medical Nutrition | ||
| Sport/Performance Nutrition | ||
Region
| Africa | By Form | |
| By End User | ||
| By Country | Nigeria | |
| South Africa | ||
| Rest of Africa | ||
| Asia-Pacific | By Form | |
| By End User | ||
| Australia | ||
| China | ||
| India | ||
| Indonesia | ||
| Japan | ||
| Malaysia | ||
| New Zealand | ||
| South Korea | ||
| Thailand | ||
| Vietnam | ||
| Rest of Asia-Pacific | ||
| Europe | By Form | |
| By End User | ||
| Belgium | ||
| France | ||
| Germany | ||
| Italy | ||
| Netherlands | ||
| Russia | ||
| Spain | ||
| Turkey | ||
| United Kingdom | ||
| Rest of Europe | ||
| Middle East | By Form | |
| By End User | ||
| Iran | ||
| Saudi Arabia | ||
| United Arab Emirates | ||
| Rest of Middle East | ||
| North America | By Form | |
| By End User | ||
| Canada | ||
| Mexico | ||
| United States | ||
| Rest of North America | ||
| South America | By Form | |
| By End User | ||
| Argentina | ||
| Brazil | ||
| Rest of South America | ||
| Form | Concentrates | ||
| Hydrolyzed | |||
| Isolates | |||
| End User | Animal Feed | ||
| Food and Beverages | By Sub End User | Bakery | |
| Beverages | |||
| Breakfast Cereals | |||
| Condiments/Sauces | |||
| Dairy and Dairy Alternative Products | |||
| RTE/RTC Food Products | |||
| Snacks | |||
| Personal Care and Cosmetics | |||
| Supplements | By Sub End User | Baby Food and Infant Formula | |
| Elderly Nutrition and Medical Nutrition | |||
| Sport/Performance Nutrition | |||
| Region | Africa | By Form | |
| By End User | |||
| By Country | Nigeria | ||
| South Africa | |||
| Rest of Africa | |||
| Asia-Pacific | By Form | ||
| By End User | |||
| Australia | |||
| China | |||
| India | |||
| Indonesia | |||
| Japan | |||
| Malaysia | |||
| New Zealand | |||
| South Korea | |||
| Thailand | |||
| Vietnam | |||
| Rest of Asia-Pacific | |||
| Europe | By Form | ||
| By End User | |||
| Belgium | |||
| France | |||
| Germany | |||
| Italy | |||
| Netherlands | |||
| Russia | |||
| Spain | |||
| Turkey | |||
| United Kingdom | |||
| Rest of Europe | |||
| Middle East | By Form | ||
| By End User | |||
| Iran | |||
| Saudi Arabia | |||
| United Arab Emirates | |||
| Rest of Middle East | |||
| North America | By Form | ||
| By End User | |||
| Canada | |||
| Mexico | |||
| United States | |||
| Rest of North America | |||
| South America | By Form | ||
| By End User | |||
| Argentina | |||
| Brazil | |||
| Rest of South America | |||
Need A Different Region or Segment?
Customize Now
Market Definition
- End User - The Protein Ingredients Market operates on a B2B basis. Food, Beverages, Supplements, Animal Feed, and Personal Care & Cosmetic manufacturers are considered to be end-consumers in the market studied. The scope excludes manufacturers buying liquid/dry whey to be used for application as a binding agent or thickener or other non-protein applications.
- Penetration Rate - Penetration Rate is defined as the percentage of Protein-Fortified End User Market Volume in the Overall End User Market Volume.
- Average Protein Content - Average protein content is the average protein content present per 100 g of product manufactured by all end-user companies considered under the scope of this report.
- End User Market Volume - End-user market volume is the consolidated volume of all types and forms of end-user products in the country or region.
| Keyword | Definition |
|---|---|
| Alpha-lactalbumin (α-Lactalbumin) | It is a protein that regulates the production of lactose in the milk of almost all mammalian species. |
| Amino acid | It is an organic compound that contains both amino and carboxylic acid functional groups, which are required for the synthesis of body protein and other important nitrogen-containing compounds, such as creatine, peptide hormones, and some neurotransmitters. |
| Blanching | It is the process of briefly heating vegetables with steam or boiling water. |
| BRC | British Retail Consortium |
| Bread improver | It is a flour-based blend of several components with specific functional properties designed to modify dough characteristics and give quality attributes to bread. |
| BSF | Black Soldier Fly |
| Caseinate | It is a substance produced by adding an alkali to acid casein, a derivative of casein. |
| Celiac disease | Celiac disease is an immune reaction to eating gluten, a protein found in wheat, barley, and rye. |
| Colostrum | It is a milky fluid that’s released by mammals that have recently given birth before breast milk production begins. |
| Concentrate | It is the least processed form of protein and has a protein content ranging from 40-90% by weight. |
| Dry protein basis | It refers to the percentage of "pure protein" present in a supplement after the water in it is completely removed through heat. |
| Dry whey | It is the product resulting from drying fresh whey which has been pasteurized and to which nothing has been added as a preservative. |
| Egg protein | It is a mixture of individual proteins, including ovalbumin, ovomucoid, ovoglobulin, conalbumin, vitellin, and vitellenin. |
| Emulsifier | It is a food additive that facilitates the blending of foods that are immiscible with one another, such as oil and water. |
| Enrichment | It is the process of addition of micronutrients that are lost during the processing of the product. |
| ERS | Economic Research Service of the USDA |
| Extrusion | It is the process of forcing soft mixed ingredients through an opening in a perforated plate or die designed to produce the required shape. The extruded food is then cut to a specific size by blades. |
| Fava | Also known as Faba, it is another word for yellow split beans. |
| FDA | Food and Drug Administration |
| Flaking | It is a process in which typically a cereal grain (like corn, wheat, or rice) is broken down into grits, cooked with flavors and syrups, and then pressed into flakes between cooled rollers. |
| Foaming agent | It is a food ingredient that makes it possible to form or maintain a uniform dispersion of a gaseous phase in a liquid or solid food. |
| Foodservice | It refers to the part of the food industry which includes businesses, institutions, and companies which prepare meals outside the home. It includes restaurants, school and hospital cafeterias, catering operations, and many other formats. |
| Fortification | It is the deliberate addition of micronutrients that are not found in them naturally or which are lost during processing, to improve a food product's nutritional value. |
| FSANZ | Food Standards Australia New Zealand |
| FSIS | Food Safety and Inspection Service |
| FSSAI | Food Safety and Standards Authority of India |
| Gelling agent | It is an ingredient that functions as a stabilizer and thickener to provide thickening without stiffness through the formation of gel. |
| GHG | Greenhouse Gas |
| Gluten | It is a family of proteins found in grains, including wheat, rye, spelt, and barley. |
| Hemp | It is a botanical class of Cannabis sativa cultivars grown specifically for industrial or medicinal use. |
| Hydrolysate | It is a form of protein manufactured by exposing the protein to enzymes that can partially break the bonds between the protein's amino acids and break down large, complicated proteins into smaller pieces. Its processing makes it easier and quicker to digest. |
| Hypoallergenic | It refers to a substance that causes fewer allergic reactions. |
| Isolate | It is the purest and most processed form of protein which has undergone separation to obtain a pure protein fraction. It typically contains ≥ 90% of protein by weight. |
| Keratin | It is a protein that helps form hair, nails, and the outer layer of skin. |
| Lactalbumin | It is the albumin contained in milk and obtained from whey. |
| Lactoferrin | It is an iron‑binding glycoprotein that is present in the milk of most mammals. |
| Lupin | It is the yellow legume seeds of the genus Lupinus. |
| Millenial | Also known as Generation Y or Gen Y, it refers to the people born from 1981 to 1996. |
| Monogastric | It refers to an animal with a single-compartmented stomach. Examples of monogastric include humans, poultry, pigs, horses, rabbits, dogs, and cats. Most monogastric are generally unable to digest much cellulose food materials such as grasses. |
| MPC | Milk protein concentrate |
| MPI | Milk protein isolate |
| MSPI | Methylated soy protein isolate |
| Mycoprotein | Mycoprotein is a form of single-cell protein, also known as fungal protein, derived from fungi for human consumption. |
| Nutricosmetics | It is a category of products and ingredients that act as nutritional supplements to care for skin, nails, and hair natural beauty. |
| Osteoporosis | It is a medical condition in which the bones become brittle and fragile from loss of tissue, typically as a result of hormonal changes, or deficiency of calcium or vitamin D. |
| PDCAAS | Protein digestibility-corrected amino acid score (PDCAAS) is a method of evaluating the quality of a protein based on both the amino acid requirements of humans and their ability to digest it. |
| Per-capita consumption of animal protein | It is the average amount of animal protein (such as milk, whey, gelatin, collagen, and egg proteins) that is readily available for consumption by each person in an actual population. |
| Per-capita consumption of plant protein | It is the average amount of plant protein (such as soy, wheat, pea, oat, and hemp proteins) that is readily available for consumption by each person in an actual population. |
| Quorn | It is a microbial protein manufactured using mycoprotein as an ingredient, in which the fungus culture is dried and mixed with egg albumen or potato protein, which acts as a binder, and then is adjusted in texture and pressed into various forms. |
| Ready-to-Cook (RTC) | It refers to food products that include all of the ingredients, where some preparation or cooking is required through a process that is given on the package. |
| Ready-to-Eat (RTE) | It refers to a food product prepared or cooked in advance, with no further cooking or preparation required before being eaten. |
| RTD | Ready-to-Drink |
| RTS | Ready-to-Serve |
| Saturated fat | It is a type of fat in which the fatty acid chains have all single bonds. It is generally considered unhealthy. |
| Sausage | It is a meat product made of finely chopped and seasoned meat, which may be fresh, smoked, or pickled and which is then usually stuffed into a casing. |
| Seitan | It is a plant-based meat substitute made out of wheat gluten. |
| Softgel | It is a gelatin-based capsule with a liquid fill. |
| SPC | Soy protein concentrate |
| SPI | Soy protein isolate |
| Spirulina | It is a biomass of cyanobacteria that can be consumed by humans and animals. |
| Stabilizer | It is an ingredient added to food products to help maintain or enhance their original texture, and physical and chemical characteristics. |
| Supplementation | It is the consumption or provision of concentrated sources of nutrients or other substances that are intended to supplement nutrients in the diet and is intended to correct nutritional deficiencies. |
| Texturant | It is a specific type of food ingredient that is used to control and alter the mouthfeel and texture of food and beverage products. |
| Thickener | It is an ingredient that is used to increase the viscosity of a liquid or dough and make it thicker, without substantially changing its other properties. |
| Trans fat | Also called trans-unsaturated fatty acids or trans fatty acids, it is a type of unsaturated fat that naturally occurs in small amounts in meat. |
| TSP | Textured soy protein |
| TVP | Textured vegetable protein |
| WPC | Whey protein concentrate |
| WPI | Whey protein isolate |
Need More Details on Market Definition?
Ask a Question
Research Methodology
Mordor Intelligence follows a four-step methodology in all our reports.
- Step-1: Identify Key Variables: The quantifiable key variables (industry and extraneous) pertaining to the specific product segment and country are selected from a group of relevant variables & factors based on desk research & literature review; along with primary expert inputs. These variables are further confirmed through regression modeling (wherever required).
- Step-2: Build a Market Model: In order to build a robust forecasting methodology, the variables and factors identified in Step-1 are tested against available historical market numbers. Through an iterative process, the variables required for market forecast are set and the model is built on the basis of these variables.
- Step-3: Validate and Finalize: In this important step, all market numbers, variables and analyst calls are validated through an extensive network of primary research experts from the market studied. The respondents are selected across levels and functions to generate a holistic picture of the market studied.
- Step-4: Research Outputs: Syndicated Reports, Custom Consulting Assignments, Databases & Subscription Platforms

Get More Details On Research Methodology
Download PDF


