
MicroRNA Market Size and Share
Market Overview
| Study Period | 2020 - 2031 |
|---|---|
| Market Size (2026) | USD 3.45 Billion |
| Market Size (2031) | USD 6.96 Billion |
| Growth Rate (2026 - 2031) | 15.05 % |
| Fastest Growing Market | Asia-Pacific |
| Largest Market | North America |
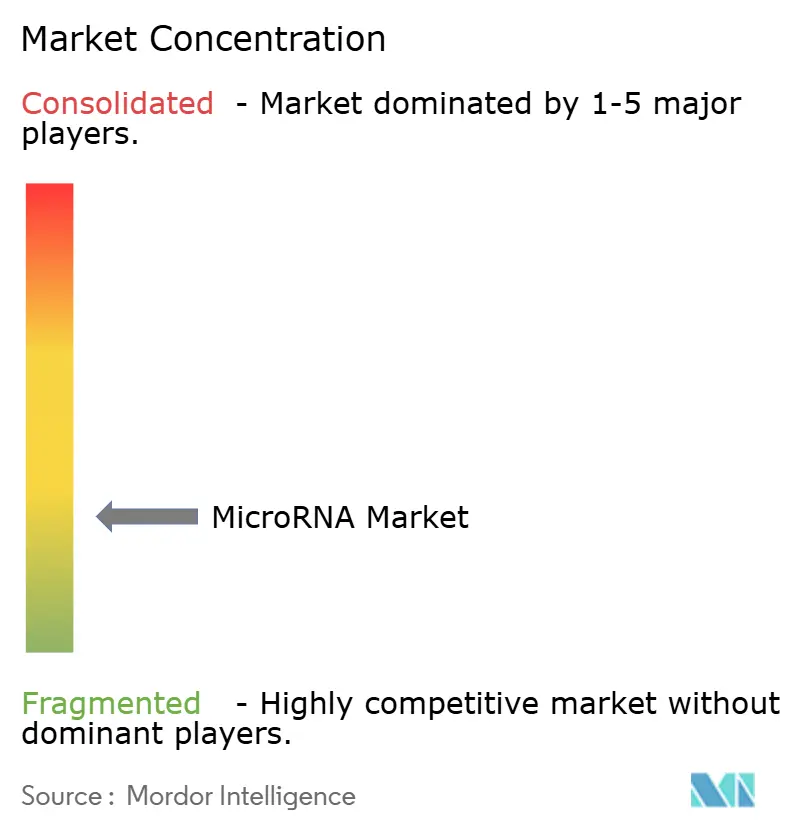
| Market Concentration | Low |
Major Players *Disclaimer: Major Players sorted in no particular order Image © Mordor Intelligence. Reuse requires attribution under CC BY 4.0. | |
MicroRNA Market Analysis by Mordor Intelligence
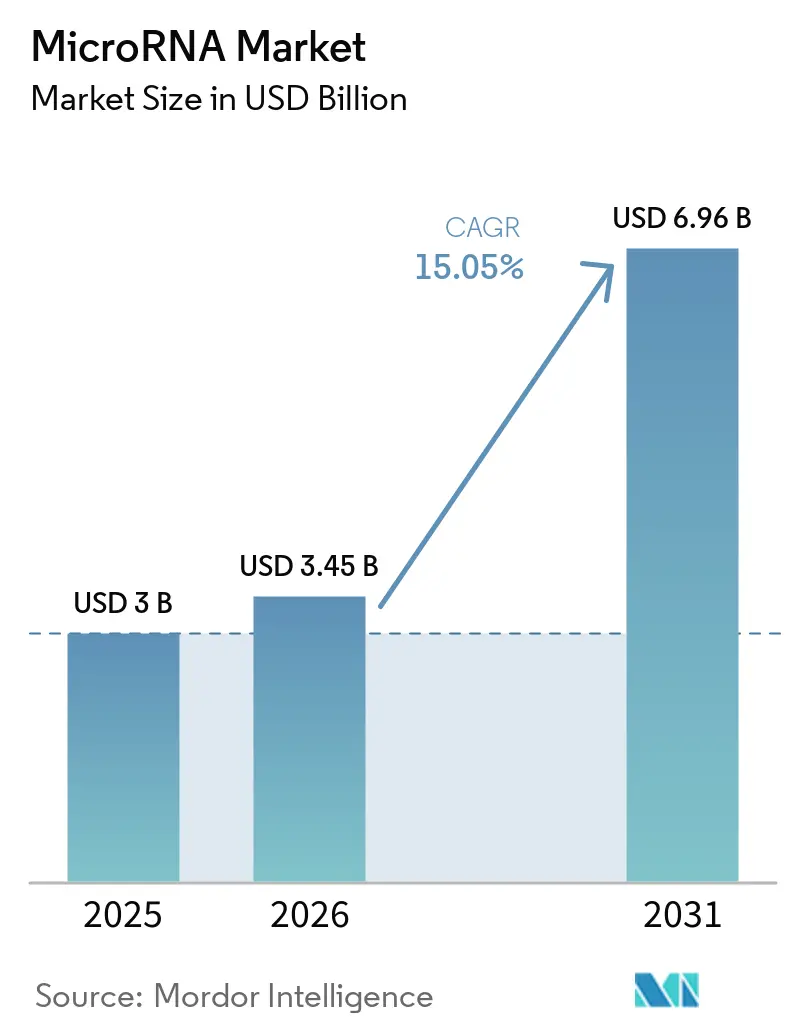
The micro RNA market size was valued at USD 3.00 billion in 2025 and estimated to grow from USD 3.45 billion in 2026 to reach USD 6.96 billion by 2031, at a CAGR of 15.05% during the forecast period (2026-2031). Momentum comes from growing adoption in precision diagnostics, expanding therapeutic pipelines, and the steady rollout of biomarker-based test menus in core laboratory settings. Regulatory fast-track incentives for oligonucleotide drugs, deeper venture funding, and continuous upgrades in next-generation sequencing (NGS) and real-time PCR (RT-qPCR) platforms are catalyzing demand across both high-income and emerging economies. Platform convergence, where a single instrument can interrogate DNA, RNA, and proteins, is pushing customers toward integrated multi-omic workflows. Meanwhile, the democratization of liquid biopsy and exosome-derived microRNA assays is enabling earlier disease detection and broadening the end-user base beyond research settings. Delivery challenges for therapeutics and lingering off-target toxicity concerns remain the primary technical hurdles, yet these restraints are opening whitespace opportunities for companies specializing in novel nanoparticle vehicles and AI-guided sequence design.
Key Report Takeaways
- By product & service, the Services segment led with 47.78% of micro RNA market share in 2025, while Kits & Reagents are projected to expand at a 15.92% CAGR through 2031.
- By technology, Real-Time PCR dominated with 38.25% revenue share in 2025; Microarray platforms show the highest forecast CAGR at 15.54% to 2031.
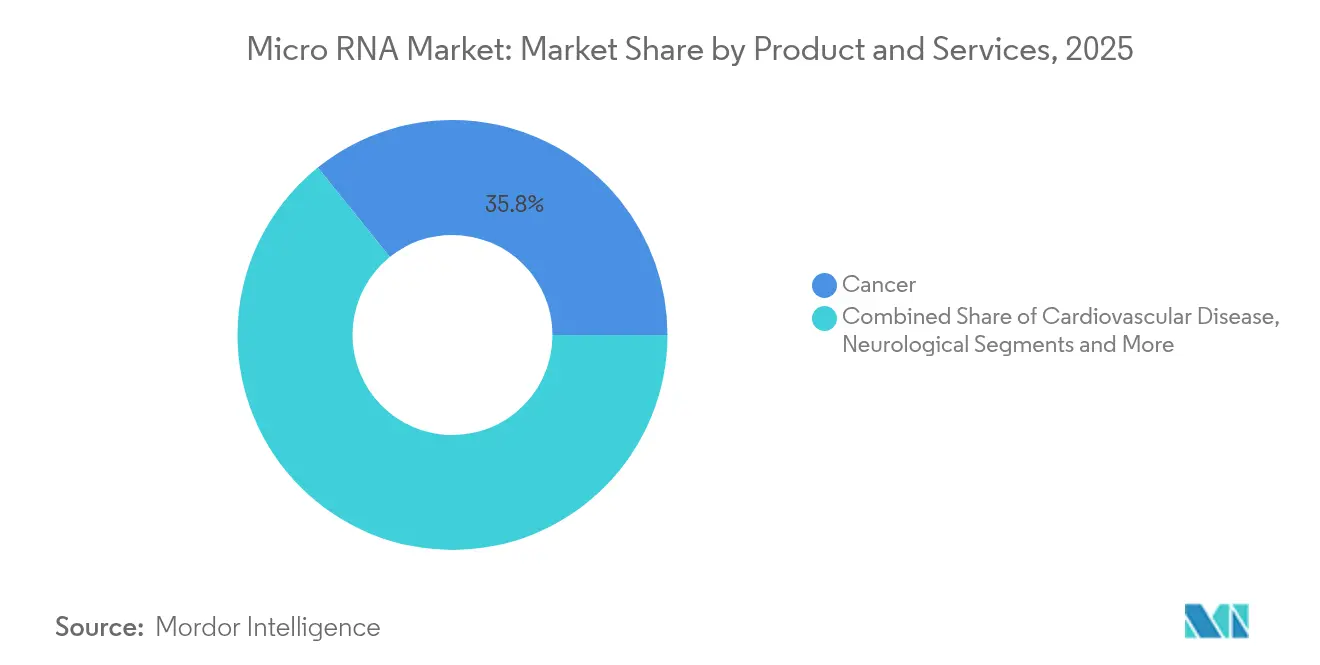
- By application, cancer captured 35.78% share of the micro RNA market size in 2025, whereas infectious diseases applications are poised for the fastest 16.02% CAGR.
- By end-user, biopharmaceutical companies held 39.86% of micro RNA market size in 2025; diagnostic centers are the quickest-growing user group at a 16.28% CAGR.
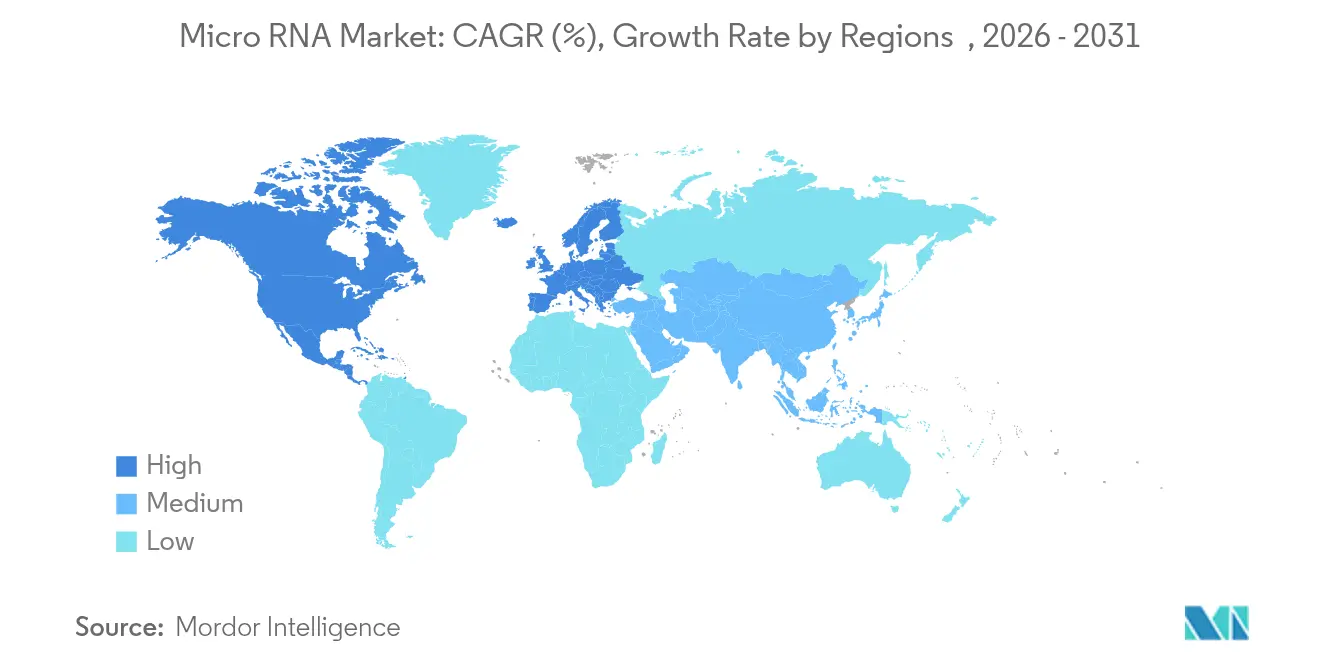
- By geography, North America commanded 41.72% micro RNA market share in 2025; Asia–Pacific is projected to advance at 16.95% CAGR through 2031.
Note: Market size and forecast figures in this report are generated using Mordor Intelligence’s proprietary estimation framework, updated with the latest available data and insights as of 2026.
Market Trends and Insights
Drivers Impact Analysis of MicroRNA Market*
| Driver | (~) % Impact on CAGR Forecast | Geographic Relevance | Impact Timeline |
|---|---|---|---|
| Rising prevalence of chronic & oncological diseases | +3.2% | Global, with highest impact in North America & Europe | Long term (≥ 4 years) |
| Rapid adoption of precision molecular diagnostics & liquid biopsy | +2.8% | North America & EU leading, APAC following | Medium term (2-4 years) |
| Intensifying R&D funding and strategic partnerships in miRNA therapeutics | +2.1% | North America & Europe core, expanding to APAC | Medium term (2-4 years) |
| Advancements in NGS & RT-qPCR platforms for small-RNA analysis | +1.9% | Global, with technology hubs in North America, Europe, Asia | Short term (≤ 2 years) |
| Regulatory fast-track / orphan-drug incentives for oligonucleotide drugs | +1.7% | North America & EU primarily | Medium term (2-4 years) |
| AI-enabled multi-omics pipelines and exosome-based miRNA assays | +1.4% | Technology-advanced regions globally | Long term (≥ 4 years) |
| Source: Mordor Intelligence | |||
Rising prevalence of chronic & oncological diseases
Chronic illnesses continue to rise, with cancer alone causing 10 million deaths in 2024, amplifying demand for microRNA-based diagnostics and therapeutics [1]World Health Organization, “Cancer Fact Sheet,” who.int. Emerging evidence shows microRNAs such as miR-4454 yielding an AUC of 0.889 for type 2 diabetes detection, spotlighting metabolic disease potential. Cardiovascular research indicates microRNAs regulating myocardial injury post-coronary microembolization, pointing to treatments beyond existing care. This widening disease spectrum reduces dependence on oncology and supports preventive medicine initiatives across aging populations in high-income countries and lifestyle-driven morbidity in emerging markets.
Rapid adoption of precision molecular diagnostics & liquid biopsy
Liquid biopsy assays using microRNA signatures now reach 90% sensitivity across nine cancers while maintaining 99% specificity. Non-invasive tests fill screening gaps for low-incidence yet deadly tumors such as pancreatic cancer; urinary miR-210-3p achieves 82.8% sensitivity and 74.3% specificity for early detection [2]Marta Gómez-Martínez et al., “Diagnostic Utility of miR-4454 in Type 2 Diabetes,” BMC Endocrine Disorders, biomedcentral.com. Diagnostic centers integrate these assays alongside protein markers and imaging, accelerating routine adoption. AI-enhanced signature discovery shortens analysis time and boosts accuracy, granting first-mover advantage to laboratories embedding machine learning into data interpretation.
Intensifying R&D funding and strategic partnerships in miRNA therapeutics
Venture and strategic investments reached new highs in 2024-2025. ARTHEx Biotech secured EUR 42 million to progress ATX-01, an antimiR targeting microRNA-23b for myotonic dystrophy; the asset carries orphan-drug designations on both sides of the Atlantic [3]ARTHEx Biotech, “ARTHEx Raises EUR 42 Million Series B,” arthxbiotech.com. Korro Bio and Novo Nordisk structured an RNA-editing alliance valued at up to USD 530 million, blending platform specialization with global clinical infrastructure. Such deals de-risk development, compress timelines, and signal large-cap pharma confidence in next-generation oligonucleotides.
Advancements in NGS & RT-qPCR platforms for small-RNA analysis
Illumina’s push into clinical multi-omics promises 18% annual growth for its sequencing installed base over the decade. LNA-enhanced RT-qPCR kits quantify microRNAs from 1 pg inputs, broadening sample compatibility. Cost-efficient microarrays gain renewed traction, with circular RNA panels delivering higher sensitivity than RNA-seq for specific targets. CRISPR-Cas12a coupled with hybridization chain reaction achieves 1 pM detection within 15 minutes, suiting point-of-care settings.
Regulatory fast-track / orphan-drug incentives for oligonucleotide drugs
US FDA and EMA continue to grant priority pathways that shorten review cycles for rare-disease oligonucleotide therapeutics, cutting both time and cost to market. In tandem with advanced manufacturing guidance, these incentives underpin robust clinical pipelines across oncology, neurology, and metabolic disorders, reinforcing revenue visibility for platform companies that satisfy quality-by-design expectations.
AI-enabled multi-omics pipelines and exosome-based miRNA assays
AI accelerates microRNA biomarker discovery by integrating genomic, transcriptomic, and proteomic datasets, producing interpretable microRNA panels tailored to disease biology. Parallel interest in exosome-derived cargo improves signal stability, allowing room-temperature transport and broadening access in low-resource settings.
Restraints Impact Analysis of MicroRNA Market*
| Restraint | (~) % Impact on CAGR Forecast | Geographic Relevance | Impact Timeline |
|---|---|---|---|
| Delivery & stability challenges for miRNA therapeutics | -2.1% | Global, particularly affecting therapeutic applications | Long term (≥ 4 years) |
| Safety and off-target toxicity concerns | -1.8% | Global, with stricter regulatory scrutiny in developed markets | Medium term (2-4 years) |
| Patent expiry of first-generation miRNA assay technologies | -1.3% | North America & Europe primarily, affecting established players | Short term (≤ 2 years) |
| Batch-to-batch variability in synthetic miRNA reagents | -0.9% | Global, with higher impact in cost-sensitive markets | Short term (≤ 2 years) |
| Source: Mordor Intelligence | |||
Delivery & stability challenges for miRNA therapeutics
Achieving tissue-specific delivery beyond the liver remains elusive. Lipid nanoparticles degrade rapidly in circulation, driving up dosage and toxicity. Single microRNAs modulate multiple pathways, demanding precision engineering to avoid unintended physiology. Research now pivots to ionizable polymer carriers and bioreducible linkers seeking enhanced pharmacokinetics. The technical gap delays broad systemic indications but spurs innovation among startups offering next-generation vehicles.
Safety and off-target toxicity concerns
Historical setbacks, such as MRX34’s discontinuation for immune-related adverse events, underscore safety vigilance. Modern AI-driven target prediction and chemical modifications—locked nucleic acids, 2’-O-methyl substitutions—are mitigating risk, yet regulatory agencies still require extensive toxicology packages. Twenty-two nucleic acid therapeutics have won FDA approval since 1998, demonstrating that well-designed chemistry can clear clinical hurdles.
*Our forecasts treat driver/restraint impacts as directional, not additive. The impact forecasts reflect baseline growth, mix effects, and variable interactions.
MicroRNA Market Segment Analysis
By Product & Service:
Services Lead Through ComplexityServices held 47.78% micro RNA market share in 2025, equal to USD 1.43 billion of spending, as laboratories outsourced extraction, quantification, and bioinformatics workflows to contract research organizations (CROs). High capital barriers, talent shortages, and the rising complexity of multi-omic data interpretation encourage research institutes and biotech firms to tap external expertise rather than build internal capacity. CROs expand bundled offerings that marry wet-lab testing with AI-assisted analytics, reinforcing stickiness.
Kits & Reagents form the fastest-growing category at a 15.92% CAGR through 2031. Standardized, ready-to-use consumables shrink protocol variability and reduce turnaround time, enabling wider adoption by mid-tier clinical labs. Innovative silicon-carbide spin columns and magnetic bead chemistries improve yield and purity, supporting downstream NGS or RT-qPCR. Instruments remain essential for centralized core facilities, yet high unit costs and long replacement cycles temper growth. Major vendors refresh portfolios with modular upgrades—automated liquid handling, cloud-native software—that extend asset life while boosting throughput.


By Technology:
Real-Time PCR Dominance Faces Platform ConvergenceReal-Time PCR accounted for 38.25% of total revenue in 2025 due to regulatory familiarity, scalable throughput, and ease of use in clinical labs. Sensitivity continues to climb through LNA-enhanced primers and microfluidic chips capable of multiplexing dozens of targets per run.
Microarray platforms, although matured, log the highest 15.54% CAGR by offering economical whole-panel profiling for exploratory studies and circular RNA analyses where sequencing depth proves costly. Innovations in probe design and dye chemistry revive interest among academic researchers and CROs requiring large cohort screens. NGS gains ground through falling per-base costs on instruments such as NovaSeq X, which marry high throughput with flexible lane configurations suitable for both discovery and clinical validation use cases.
By Application:
Cancer Leadership Chased by Infectious Disease GrowthCancer retained 35.78% share of the micro RNA market size in 2025, driven by extensive literature linking dysregulated microRNAs to tumor initiation, progression, and therapy resistance. Companion diagnostics for targeted therapies leverage tumor-specific microRNA panels to stratify patients and monitor minimal residual disease.
Infectious disease testing is projected to outpace all other segments at a 16.02% CAGR. Pandemic-induced investments demonstrated that microRNA signatures from serum, saliva, or urine can distinguish viral from bacterial infections within hours, guiding antimicrobial stewardship. Research programs now profile host microRNA responses to influenza, HIV, and tuberculosis, aiming to embed rapid panels into emergency departments. Cardiovascular and neurological indications also expand as longitudinal cohort data affirm prognostic value, diversifying revenue away from oncology.
By End-User:
Biopharmaceutical Shift Toward Diagnostic DemocratizationBiopharmaceutical companies represented 39.86% micro RNA market size in 2025, reflecting heavy spending on target validation, lead optimization, and companion diagnostic co-development. Their dominance persists, yet diagnostic centers are projected for the fastest 16.28% CAGR, propelled by accreditation of microRNA panels under in-vitro diagnostic regulations and the cost advantage of non-invasive specimen types.
Hospitals and clinics integrate point-of-care cartridges that deliver microRNA-based answers in under 30 minutes, encouraging test adoption for acute settings such as stroke triage. Academic institutions retain critical influence as discovery hubs but increasingly partner with commercial labs to monetize intellectual property, shortening technology translation timelines.
Geography Analysis
North America MicroRNA Market
North America contributed 41.72% of global revenue in 2025 underpinned by a mature biotechnology ecosystem, sizable NIH and venture funding, and FDA programs that prioritize innovative oligonucleotide therapeutics. Reimbursement frameworks covering liquid biopsy and companion diagnostics facilitate rapid hospital uptake.
APAC MicroRNA Market
Asia–Pacific is forecast as the fastest-growing region at 16.95% CAGR to 2031. Governments in China, Japan, and South Korea offer matching grants and tax incentives for RNA research infrastructure, while contract development and manufacturing organizations leverage cost-efficient supply chains to attract global sponsors. Rising chronic disease prevalence, together with aging demographics, lifts demand for early detection tests. Domestic firms tailor assays for hepatitis- and gastric cancer-heavy disease profiles, building regulatory pathways through National Medical Products Administration and Pharmaceuticals and Medical Devices Agency reforms.
EMEA and South America MicroRNA Market
Europe maintains strong market positioning through Horizon-funded consortia, sophisticated clinical trial networks, and cohesive data-protection rules that facilitate multi-center biomarker validation. ARTHEx Biotech’s latest EUR 42 million round illustrates venture appetite for microRNA-targeting therapeutics headquartered in the region. Middle East & Africa and South America remain nascent but promising; increased expenditure on tertiary care hospitals and laboratory automation sets the foundation for gradually expanding microRNA diagnostics.

Regulatory Landscape
MicroRNA diagnostics and companion assays operate under established IVD and CDx frameworks in major markets. In the European Union, Regulation (EU) 2017/746 (IVDR) requires notified-body conformity assessment, and tests categorized as companion diagnostics trigger consultation with medicinal-product authorities such as the European Medicines Agency (EMA) under EMA procedural guidance and CDx FAQs. This affects evidence plans for microRNA liquid biopsy and panel-based workflows.
For therapeutics, microRNA candidates generally follow broader regulatory frameworks used for oligonucleotide drugs and, where applicable, biologics or ATMP-adjacent requirements. Across these programs, regulators place strong emphasis on CMC, potency assays, biodistribution, PK/PD, immunogenicity, and off-target toxicity packages, particularly when nanoparticle delivery systems are involved. In clinical development, the EU Clinical Trials Regulation and the Clinical Trials Information System (CTIS) anchor trial authorization processes, while the United Kingdom updated its clinical trial oversight via The Medicines for Human Use (Clinical Trials) (Amendment) Regulations 2025, coming into force on April 28, 2026, which affects submission and conduct requirements for sponsors running miRNA-focused studies in the UK.
Value Chain Analysis
The microRNA market value chain spans discovery and assay design (biomarker selection, primer/probe design, and panel optimization), sample processing (extraction and QC of small RNA from blood, urine, saliva, tissue, and exosomes), and measurement platforms (RT-qPCR, dPCR, microarray, and NGS). It then extends to bioinformatics interpretation, reporting, and clinical or research decision support. Services and CROs form a critical midstream layer by bundling wet-lab workflows with analytics, while instrument and consumables suppliers capture recurring demand through kits, reagents, and software updates that support multi-omic and high-multiplex gene-expression workflows.
Upstream inputs for miRNA assays and therapeutics depend on specialized chemistries and materials, including phosphoramidites and high-purity lipids for lipid nanoparticle formulations. Quality, traceability, and batch consistency influence cost and lead times. Manufacturing and logistics constraints intensify for therapeutic programs because of cGMP scale-up, complex formulation steps for delivery systems, and cold-chain requirements, which can push vendor consolidation, tighter supplier qualification, and vertically integrated models where feasible. Across both diagnostics and therapeutics, regulatory-grade characterization (potency, impurities, biodistribution, and safety) feeds back into the value chain by increasing the need for standardized assays and robust documentation early in development.
Competitive Landscape
Industry structure is moderately fragmented yet trending toward consolidation. Novartis set a precedent by spending USD 1.7 billion for Regulus Therapeutics in 2025, underscoring big pharma’s intention to secure proprietary microRNA pipelines before clinical proof-of-concept milestones. Large instrumentation vendors defend share through full-stack solutions that combine chemistry, hardware, and cloud analytics, whereas mid-sized biotechs carve niches in delivery technologies or rare-disease programs.
Strategic alliances dominate deal flow. Platform providers license proprietary detection chemistries to diagnostic firms entering decentralized testing, while therapeutic developers co-develop companion assays with CROs to streamline regulatory submissions. Venture investors reward differentiated capability—tissue-specific nanoparticle delivery,
AI-based off-target prediction—over scale alone. Competitive intensity rises in point-of-care testing, where start-ups promise 15-minute cartridge results, challenging central-lab incumbents. Barriers to entry include intellectual property around LNA chemistry, robust quality management systems, and clinical validation datasets linking microRNA panels to hard outcomes.
MicroRNA Industry Leaders
Qiagen N.V.
Thermo Fisher Scientific, Inc.
PerkinElmer, Inc.
Illumina, Inc.
Takara Bio, Inc
- *Disclaimer: Major Players sorted in no particular order
MicroRNA Market Companies Covered in this Report
- Thermo Fisher Scientific
- QIAGEN
- Illumina
- Agilent Technologies
- Merck
- NanoString Technologies Inc.
- Horizon Discovery
- GeneCopoeia
- OriGene Technologies
- Norgen Biotek
- Regulus Therapeutics Inc.
- Miragen Therapeutics Inc.
- Biorchestra Co. Ltd.
- Mirxes Pte Ltd.
- TransCode Therapeutics Inc.
- Quantabio
- Miltenyi Biotec
- LGC Biosearch Technologies

Market Opportunities and Future Outlook
Opportunity is expanding where platform upgrades convert microRNA measurement into higher-throughput, higher-multiplex routine workflows, particularly in oncology and multi-omic study designs that require consistent quantification across large cohorts. In June 2026, QIAGEN expanded its QIAcuity digital PCR gene expression portfolio with a high-multiplex RNA workflow (up to 12 RNA targets), reinforcing adoption of dPCR for sensitive gene-expression quantification. It also supports assay developers building microRNA-adjacent menus that need robust multiplexing and reproducibility.
A second whitespace area sits at the intersection of microRNA liquid biopsy translation and clinical utility generation, where developers are partnering to move from research-use methods to standardized, scalable assays. In June 2026, Biocartis and City of Hope agreed to explore development of a rapid pancreatic cancer test using City of Hope microRNA-based liquid biopsy technology, which points to continued commercialization activity around microRNA signatures in hard-to-screen cancers. On the therapeutics side, the need for better in vivo delivery and clearer regulatory-grade analytics is directing investment toward nanocarriers, standardized potency frameworks, and endpoint strategies that fit accelerated pathways, as illustrated by Regulus Therapeutics reporting alignment with the US FDA in February 2025 on a Phase 3 single pivotal trial design using height-adjusted total kidney volume (htTKV) as an accepted surrogate endpoint for Accelerated Approval in ADPKD.
Recent Industry Developments in MicroRNA Market
- June 2026: QIAGEN expanded the QIAcuity digital PCR gene expression portfolio, including the QIAcuity OneStep High Multiplex Probe PCR Kit that supports up to 12 RNA targets. The release strengthens high-multiplex RNA quantification on dPCR, supporting biopharma and translational labs that are standardizing small-RNA and gene expression workflows for biomarker validation.
- February 2026: Covaris (a PerkinElmer company) launched the truCOVER Total RNA Library Prep Kit as part of its truCOVER library prep family, targeting RNA-seq library preparation from 10 to 500 ng total RNA inputs. The kit-level refinement addresses sample-to-library variability, improving the reliability of transcriptomics pipelines that frequently include small-RNA and miRNA-adjacent profiling steps.
- May 2024: Enzene Biosciences launched a new drug discovery division to complement its biologics manufacturing facility using EnzeneX technology, broadening its integrated capabilities. The move reflects continued services-side investment and supports outsourcing demand for complex nucleic-acid and biomarker programs where specialized process development and analytics are required.


MicroRNA Market Report Scope and Research Methodology
Market Definition and Coverage
For this study, the micro RNA market covers revenue earned from tools and services used to profile, detect, quantify, synthesize, and study micro RNA molecules in research and clinical workflows across major regions.
Scope exclusions: Excluded items include therapeutic pipeline licensing fees and broad oligonucleotide manufacturing that is not micro RNA specific.
Segments Covered in This Report
- By Product & Service
- Kits & Reagents
- Instruments
- Services
- By Technology
- Real-Time PCR
- Microarray
- Next-Generation Sequencing (NGS)
- Immunoassay
- Northern Blotting
- In-situ Hybridization (ISH)
- By Application
- Cancer
- Cardiovascular Disease
- Neurological Disease
- Infectious Diseases
- Immunological Disorders
- Other Applications
- By End-User
- Biopharmaceutical Companies
- Diagnostic Centers
- Hospitals & Clinics
- Others
- By Geography
- North America
- United States
- Canada
- Mexico
- Europe
- Germany
- United Kingdom
- France
- Italy
- Spain
- Rest of Europe
- Asia-Pacific
- China
- Japan
- India
- Australia
- South Korea
- Rest of Asia-Pacific
- Middle East & Africa
- GCC
- South Africa
- Rest of Middle East & Africa
- South America
- Brazil
- Argentina
- Rest of South America
- North America
Data Sources, Market Sizing, and Validation
Desk Research
Desk work started by pinning down what is counted as micro RNA revenue and what tends to be bundled into adjacent RNA categories. We reviewed public science and health references such as PubMed indexed journals for workflow adoption signals, the US National Institutes of Health for grant activity patterns, and the US Food and Drug Administration database for relevant diagnostic clearances and clinical testing context.
We also used cross-checks from sources such as the World Health Organization for disease burden context, the OECD for R&D intensity indicators, and customs and trade statistics where available to sanity check movement of relevant lab inputs. Company annual reports, investor presentations, and reputable press coverage were used to map product families and track commercial launches, and then a paid subscription covering company financials and a patent database was used selectively to fill gaps around revenue mix and innovation timelines. The sources listed here are illustrative rather than exhaustive, and other public references were also used for data collection, validation, and research clarification.
Primary Interviews and Surveys
Primary discussions were used to confirm what labs and sponsors actually purchase in micro RNA workflows, and to pressure test pricing ranges and adoption pacing by technology and end use. We spoke with a mix of suppliers, distributors, service labs, and downstream users across APAC, EMEA, and the Americas, so the assumptions were not driven by one geography or one buyer type.
Distribution of primary research fieldwork respondents
| Company type | Respondent position | Region |
|---|---|---|
| Top tier: 26% | CXOs: 13% | APAC: 45% |
| Mid tier: 57% | Functional/Unit leaders: 43% | EMEA: 33% |
| Smaller Players: 17% | Managers: 44% | Americas: 22% |
Market-Sizing & Forecasting
We built the market using a top-down and bottom-up approach where regional and global demand pools were reconstructed from lab research intensity and clinical testing activity, then filtered to micro RNA specific workflows through adoption and spend shares. To keep the totals realistic, the results were corroborated with selective bottom-up approximations, such as sampled average selling price ranges for key kits and assays, typical service pricing for profiling projects, and a supplier and channel roll up for a short list of representative offerings.
Inputs that materially shaped the model included (illustrative, not exhaustive) the pace of micro RNA publications and funded projects, the spread of sequencing and qPCR based profiling in routine lab work, the share of outsourced profiling services versus in house testing, and the price progression seen in common assay formats and library prep steps. Forecasts were developed using scenario analysis supported by expert views on research funding direction, clinical translation speed, and expected cost per sample changes, and then adjusted where adoption constraints were flagged (for example, reimbursement uncertainty or slower validation timelines). Where company disclosures did not split micro RNA revenues cleanly from broader RNA products, we used interview led allocation keys and rechecked them against product catalogs and patent activity signals.
Data Validation & Update Cycle
Totals were checked through triangulation across multiple angles, including demand indicators, supplier side signals, and price and volume logic, before any number was finalized. When the model produced outliers, the underlying driver was reviewed, such as a sudden step change in assumed service pricing or an unrealistic regional share, and then the assumption was either corrected or reconfirmed through follow up calls.
A second analyst review was completed to test whether the market direction matched external signals and whether year over year movements were explainable. The report is refreshed annually, and interim updates are triggered when there is a material event that can shift adoption or pricing, followed by a final pre delivery review so clients receive the most current view.
Mordor Intelligence's Global Micro Rna Market Size Compared With Other Published Estimates
Published market values for micro RNA do not always match because the scope can shift between tools, services, and adjacent RNA categories, and because different base years and currency timings can be used. Differences also show up when one estimate leans more on research activity signals, while another leans more on limited supplier revenue disclosures.
Therapeutic pipeline licensing fees sit outside Mordor Intelligence's scope, which is one reason the 2025 value can look higher or lower versus estimates that mix in broader RNA therapeutics economics or exclude dedicated instruments and services. Another driver is how service revenue is handled, since some models count only product kits and reagents, while others include profiling and synthesis services but apply a single global price point. Refresh cadence matters as well, because sequencing cost declines and changes in outsourcing share can alter the value mix even when sample volumes grow steadily.
Benchmark comparison
| Source | Market Size | Gaps in Research Methodology |
|---|---|---|
| Mordor Intelligence | USD 3.00 B (2025) | |
| Trade Journal A | USD 1.54 B (2024) | Uses an earlier base year and can understate dedicated instrument revenue, and it may not fully normalize regional pricing differences in outsourced profiling and synthesis services. |
| Industry Publisher B | USD 0.28 B (2022) | Anchored to older year benchmarks and commonly describes a narrower commercial pool, which can miss parts of research grade workflow spend and the later rise in clinical adoption. |
The spread in the table mainly comes from what revenue streams are included, which year is treated as current, and how quickly prices are assumed to move as volumes rise. By keeping the math tied to clear demand signals and pressure testing it with supplier and pricing checks, the final number stays traceable and repeatable for planning.


Key Questions Answered in the Report
How big is the MicroRNA Market?
The MicroRNA Market size is expected to reach USD 3.45 billion in 2026 and grow at a CAGR of 15.05% to reach USD 6.96 billion by 2031.
What factors are driving rapid growth in the micro RNA market?
Growth stems from rising chronic disease prevalence, regulatory incentives for oligonucleotide drugs, and continuous improvements in NGS and RT-qPCR platforms that make microRNA diagnostics and therapeutics more accessible.
Who are the key players in MicroRNA Market?
Qiagen N.V., Thermo Fisher Scientific, Inc., PerkinElmer, Inc., Illumina, Inc. and Takara Bio, Inc are the major companies operating in the MicroRNA Market.
Which is the fastest growing region in MicroRNA Market?
Asia–Pacific is forecast to expand at a 16.95% CAGR through 2031, propelled by government R&D incentives, expanding clinical trial activity, and increasing chronic disease burdens.
Page last updated on:


 Your data is secure and never sold or shared.


