
Market Overview
| Study Period | 2020 - 2031 |
|---|---|
| Market Size (2026) | USD 88.45 Billion |
| Market Size (2031) | USD 105.06 Billion |
| Growth Rate (2026 - 2031) | 3.52 % |
| Fastest Growing Market | Asia Pacific |
| Largest Market | North America |
| Market Concentration | Medium |
Major Players *Disclaimer: Major Players sorted in no particular order Image © Mordor Intelligence. Reuse requires attribution under CC BY 4.0. | |
Metal Cans Market Analysis by Mordor Intelligence
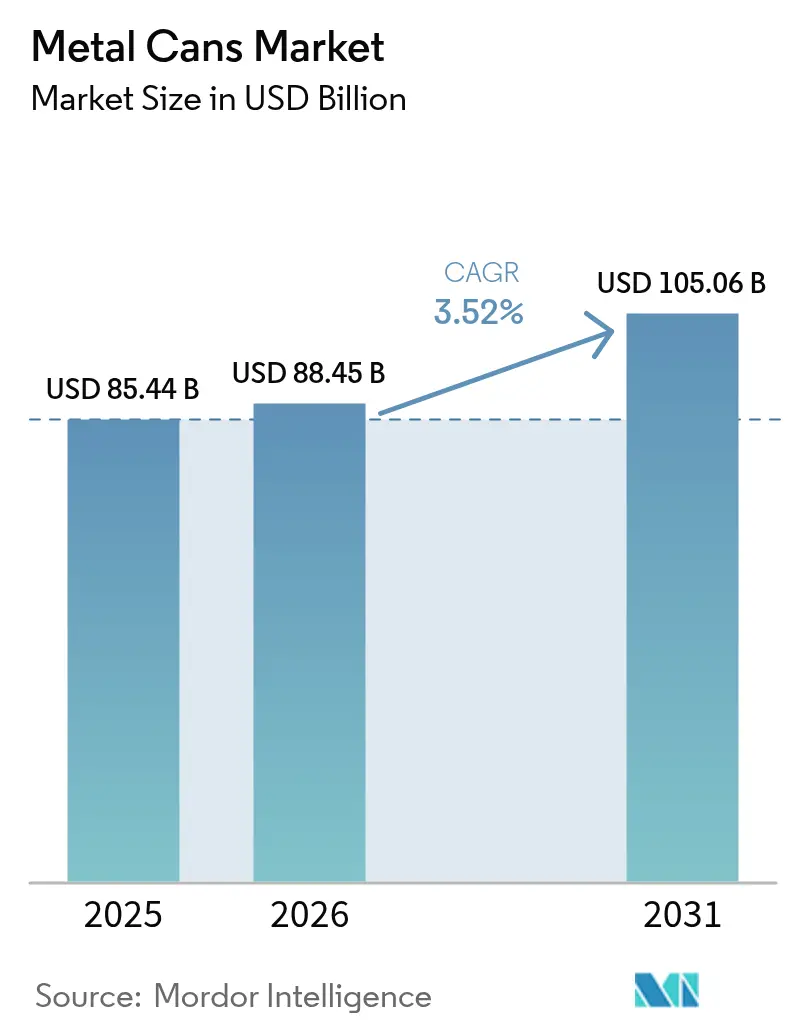
The global metal cans market size in 2026 is estimated at USD 88.45 billion, growing from 2025 value of USD 85.44 billion with 2031 projections showing USD 105.06 billion, growing at 3.52% CAGR over 2026-2031. Current expansion reflects the shift from conventional packaging toward recyclable, circular-economy solutions. Aluminum maintains a pivotal position because it can be recycled indefinitely without degrading, and national recycling programs are rapidly scaling collection infrastructure-Japan’s 2024 aluminum can recovery rate surpassed 93%. Lightweighting technologies such as Ball Corporation’s ReAl Gen 2 alloy, introduced in 2024, are trimming material use by up to 15% and helping brand owners contain cost volatility tied to primary aluminum pricing. At the same time, deposit-return systems and extended producer-responsibility programs in Europe, North America, and parts of Asia are internalizing environmental costs, reinforcing the value proposition of the metal cans market. The beverage sector remains the cornerstone end user, yet pharmaceutical demand is gathering pace on the back of tamper-evident requirements and track-and-trace mandates, underpinning the metal cans market’s multi-segment resilience.
Key Report Takeaways
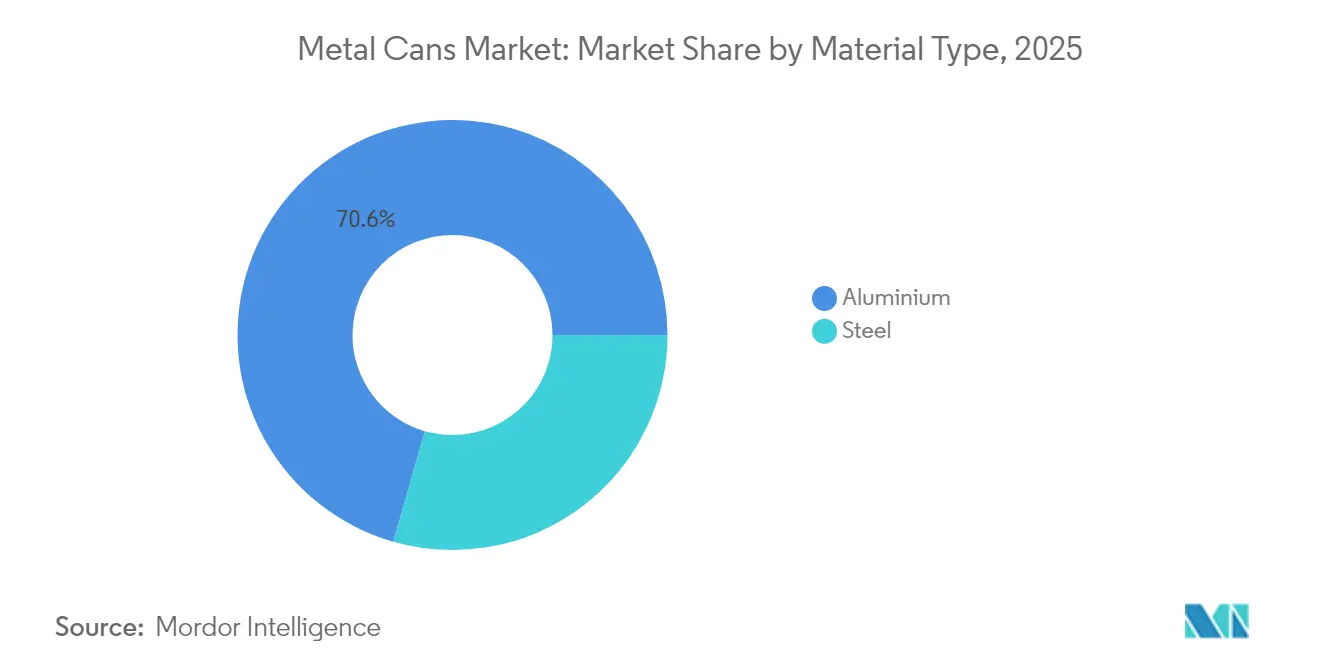
- By material type, aluminum commanded 70.56% of metal cans market share in 2025, while steel registered slower expansion despite niche retention in certain food categories.
- By can structure, two-piece formats led with 54.06% revenue share in 2025; monobloc aerosol cans posted the fastest 4.78% CAGR through 2031.
- By capacity, the 250-500 ml range accounted for 30.18% of the metal cans market size in 2025; ≤250 ml cans are on track for a 4.88% CAGR.
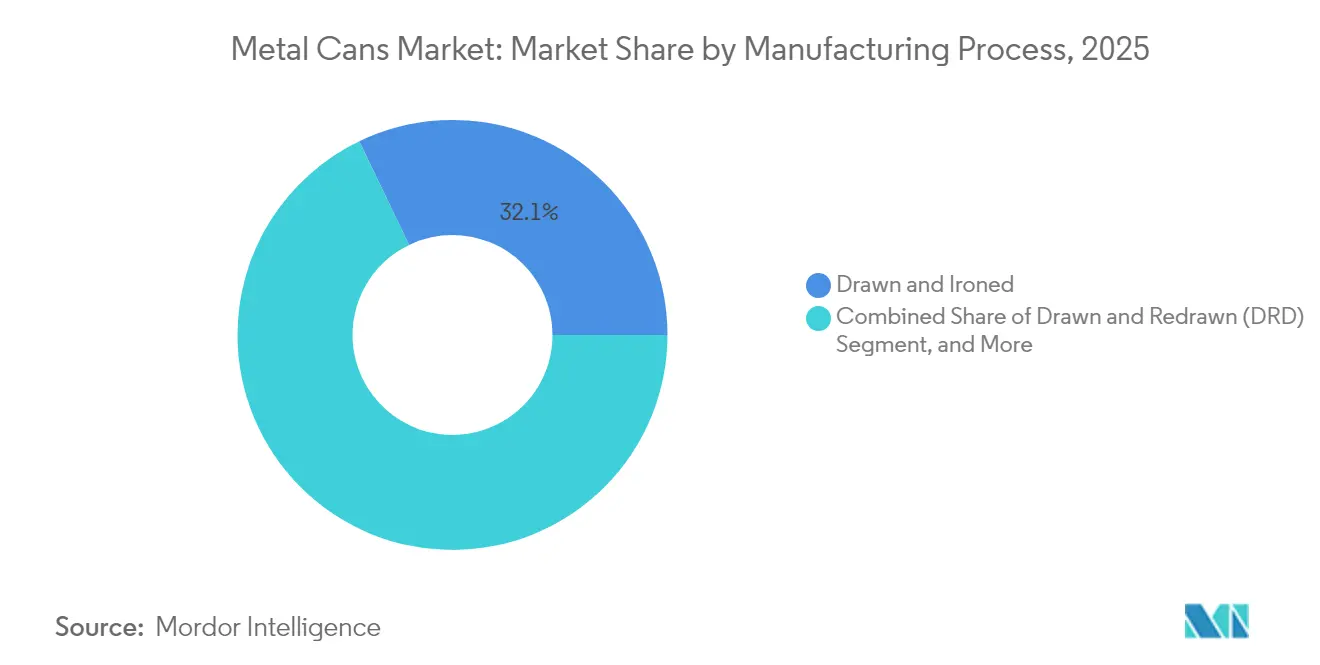
- By manufacturing process, drawn-and-ironed cans held 32.14% of the metal cans market size in 2025, whereas impact extrusion is accelerating at a 4.74% CAGR.
- By end-user industry, beverages contributed 38.01% of the metal cans market share in 2025; pharmaceuticals are advancing at a 4.95% CAGR to 2031.
- By geography, North America led with 39.72% revenue share in 2025; Asia-Pacific is projected to expand at a 5.88% CAGR through 2031.
Note: Market size and forecast figures in this report are generated using Mordor Intelligence’s proprietary estimation framework, updated with the latest available data and insights as of 2026.
Market Trends and Insights
Drivers Impact Analysis of Metal Cans Market*
| Driver | (~) % Impact on CAGR Forecast | Geographic Relevance | Impact Timeline |
|---|---|---|---|
| Aluminum price volatility accelerates lightweighting adoption | +0.8% | North America and Europe (global spillover) | Medium term (2-4 years) |
| Global DRS programs expanding refill-deposit loops | +0.6% | Europe and Asia-Pacific; emerging in North America | Long term (≥ 4 years) |
| Growth in RTD beverage launches | +0.9% | Global; strongest in Asia-Pacific | Short term (≤ 2 years) |
| Food-waste reduction initiatives | +0.4% | North America and Europe; expanding to emerging markets | Medium term (2-4 years) |
| Craft aerosol packaging for “at-home spa” | +0.3% | Premium segments in North America and Europe | Short term (≤ 2 years) |
| Smart-printing enabling supply-chain traceability | +0.2% | Developed markets worldwide | Long term (≥ 4 years) |
| Source: Mordor Intelligence | |||
Aluminum Price Volatility Accelerates Lightweighting Adoption
Manufacturers are answering unpredictable aluminum costs by cutting material use instead of sacrificing margins. ReAl Gen 2, commercialized in 2024, reduces can wall thickness up to 15% while preserving top-load strength, directly offsetting commodity swings. Lighter cans also ease logistics emissions, aligning with corporate net-zero roadmaps. Premium brands willingly absorb the incremental technology cost because the aesthetic and sustainability credentials support higher shelf prices. Patent activity shows designers fine-tuning micro-alloy recipes that raise strength-to-weight ratios and enable high-speed impact extrusion. As more lines convert, the metal cans market enjoys a reinforcing cycle of lower material intensity and enhanced economic resilience.
Global DRS Programs Expanding Refill-Deposit Loops
Mandatory deposit-return systems are closing the loop on beverage containers and systematically advantaging infinitely recyclable aluminum. Europe’s updated Packaging and Packaging Waste Regulation, in force since 2024, sets aggressive material-specific targets that aluminum readily meets. Singapore and Germany post return rates above 90%, providing reliable secondary feedstock that shields manufacturers from volatile virgin supply. These loops shrink lifecycle emissions and reduce producer compliance fees, which in turn encourage brand owners to pivot toward cans in new beverage sub-segments. As infrastructure matures, DRS economics further elevate the attractiveness of the metal cans market relative to PET and flexibles.
Growth in RTD Beverage Launches
The global boom in ready-to-drink coffees, teas, cocktails, and functional beverages is sharpening demand for aluminum’s light-proof barrier and rapid chill properties. RTD coffee alone grew 23% in 2024 and overwhelmingly favored cans over glass for portability and superior artwork display. Asian urban consumers prioritizing convenience, and Western millennials seeking premium chilled cocktails, both gravitate toward sleek can formats. Smaller SKUs dovetail with portion-control trends and enable producers to test niche flavors without high glass line changeover costs. Each new RTD launch raises baseline can volumes and reinforces brand storytelling possibilities through high-definition printing.
Food-Waste Reduction Initiatives Driving Shelf-Stable Formats
Government and corporate pledges under U.N. SDG 12.3 aim to halve food waste by 2030; shelf-stable metal packaging directly supports that ambition. [1]United Nations, “Sustainable Development Goal 12: Responsible Consumption and Production,” un.org Aluminum and steel cans extend shelf life two-to-five times longer than many flexible pouches, safeguarding quality in soups, sauces, and seasonal produce. Campbell Soup’s 2024 range demonstrates how shelf-stable recipes satisfy consumer convenience while meeting retailers’ shrink-reduction KPIs. Extended ambient stability also simplifies inventory management for e-commerce channels, which favor packages that resist temperature swings and long dwell times.
Restraints Impact Analysis of Metal Cans Market*
| Restraint | (~) % Impact on CAGR Forecast | Geographic Relevance | Impact Timeline |
|---|---|---|---|
| PET and flexibles cost advantage in emerging markets | -0.7% | Asia-Pacific and Latin America (price-sensitive segments) | Short term (≤ 2 years) |
| EU BPA-migration limits on epoxy liners | -0.3% | Europe; spillover to other developed markets | Medium term (2-4 years) |
| Steel mill decarbonization costs | -0.4% | Europe and North America (global raw-material flows) | Long term (≥ 4 years) |
| E-commerce shift to “ship-in-own-container” | -0.2% | High e-commerce penetration markets | Medium term (2-4 years) |
| Source: Mordor Intelligence | |||
PET and Flexibles Cost Advantage in Emerging Markets
Where incomes stay modest, PET bottles and pouches undercut cans by 15-25% on a delivered-cost basis, slowing metal penetration in India, Brazil, and parts of Southeast Asia. PET’s local resin output and lightweight logistics keep shelf prices low. Yet new Indian EPR rules effective 2024 have started to erode plastics’ price edge by monetizing end-of-life liabilities, encouraging retailers to trial aluminum formats for aspirational sub-brands. [2]Ministry of Environment, Forest and Climate Change, “Extended Producer Responsibility Guidelines 2024,” moef.gov.in
EU BPA-Migration Limits on Epoxy Liners
Europe’s latest bisphenol A limits have forced can makers to qualify new water-based or polymeric liners, adding as much as USD 550,000 in validation costs per SKUs. The expense temporarily cramps margins and slows launch timelines, but once approved, BPA-NI coatings deliver compliant performance and position cans as the safest choice for infant and specialty nutrition.
*Our forecasts treat driver/restraint impacts as directional, not additive. The impact forecasts reflect baseline growth, mix effects, and variable interactions.
Metal Cans Market Segment Analysis
By Material Type:
Aluminum’s Circular Economy AdvantageAluminum captured a commanding 70.56% metal cans market share in 2025 and is on course for a 4.35% CAGR through 2031. That dominance rests on closed-loop recycling systems that require 95% less energy than primary smelting, lowering scope 3 emissions for brand owners. Across beverages, personal care, and pharmaceuticals, marketers leverage aluminum’s printable surface and corrosion resistance to differentiate premium SKUs. In parallel, decarbonization pressures elevate aluminum versus steel, whose mills face rising carbon fees.
Steel remains essential where physical robustness overrides weight penalties-chiefly in canned meats and heat-processed meals. Yet continuing decarbonization costs are eroding its long-term price competitiveness. Producers respond by alloying tinplate with chromium to trim gauge, but substitution risk persists. For investors, the metal cans market reflects a clear material bifurcation: aluminum for growth, steel for stability.


By Can Structure:
Monobloc Innovation Drives GrowthTwo-piece cans preserved 54.06% share in 2025 thanks to efficient drawn-and-ironed lines that churn out billions of beverage units annually. These formats balance weight, cost, and stacking strength, underscoring their role as the backbone of the metal cans market size. On the innovation front, monobloc aerosol designs are expanding at a 4.78% CAGR, helped by personal-care brands seeking seamless shapes and advanced valves.
Impact-extruded monoblocs enable refillable cartridge systems and ultralight shells, unlocking eco-premium price points in deodorants and hair mists. Three-piece welded cans, while aging, sustain niche demand in large-volume foodservice and specialty products where customized diameters or necked ends matter more than weight. Overall, structural variety equips converters to serve diverse product viscosities, filling pressures, and shelf-life requirements.
By Capacity/Size:
Premiumization Fuels Smaller FormatsThe 250-500 ml category delivered 30.18% of the metal cans market size in 2025, driven by mainstream soda and beer volumes. Yet ≤250 ml slim and sleek cans represent the fastest 4.88% CAGR. These smaller formats match today’s portion-control ethos and command higher price per ounce as consumers equate compact graphics with specialty positioning. Smart-printing pilots commonly debut on 200 ml RTD coffees, illustrating how digital engagement layers onto premium SKUs.
Mid-size 500-1,000 ml cans hold steady among family beverages and pantry staples, whereas containers exceeding 1 L cater to industrial coatings, edible oils, and institutional ingredients. As e-commerce expands, shipping cost constraints spotlight weight-efficient smaller cans, further fueling the premium miniature trend inside the global metal cans market.
By Manufacturing Process:
Impact Extrusion Gains EfficiencyDrawn-and-ironed technology made up 32.14% of the metal cans market size in 2025 since it scales easily for carbonated beverages. The method delivers thin walls with minimal scrap, maintaining its cost edge for high-throughput lines. Impact extrusion, however, is gaining ground at a 4.74% CAGR because it lets producers form dent-resistant, seamless walls for cosmetics, OTC sprays, and lubricants while cutting metal waste by roughly 20%.
Process engineers have refined die-lubricant mixtures and servo press controls to raise cycle speeds, narrowing the unit-cost gap with DI lines. Drawn-and-redrawn techniques survive where multi-stage deep draws create complex geometries for paint, sealants, or specialty chemicals. Collectively, process diversification equips manufacturers with a playbook to optimize strength, aesthetics, and sustainability targets.
By End-User Industry:
Pharmaceutical Uptake AcceleratesBeverage fillers retained 38.01% metal cans market share in 2025 and continue to be the demand anchor, underscored by high carbonation stability and fast-chill appeal. In contrast, pharmaceuticals are the growth engine, advancing at a 4.95% CAGR as regulators tighten integrity and counterfeit controls. Serialization-ready metal packs meet 2D-barcode mandates, and aluminum’s inertness safeguards active ingredients.
Food brands leverage cans to curb spoilage, a corporate priority linked to SDG 12.3 goals. Personal-care labels exploit decoration latitude to convey spa-quality cues, while automotive fluids and paints rely on puncture resistance and chemical compatibility. These multi-industry streams reinforce volume diversity and help buffer cyclical weakness in any single sector.
Geography Analysis
North America Metal Cans Market
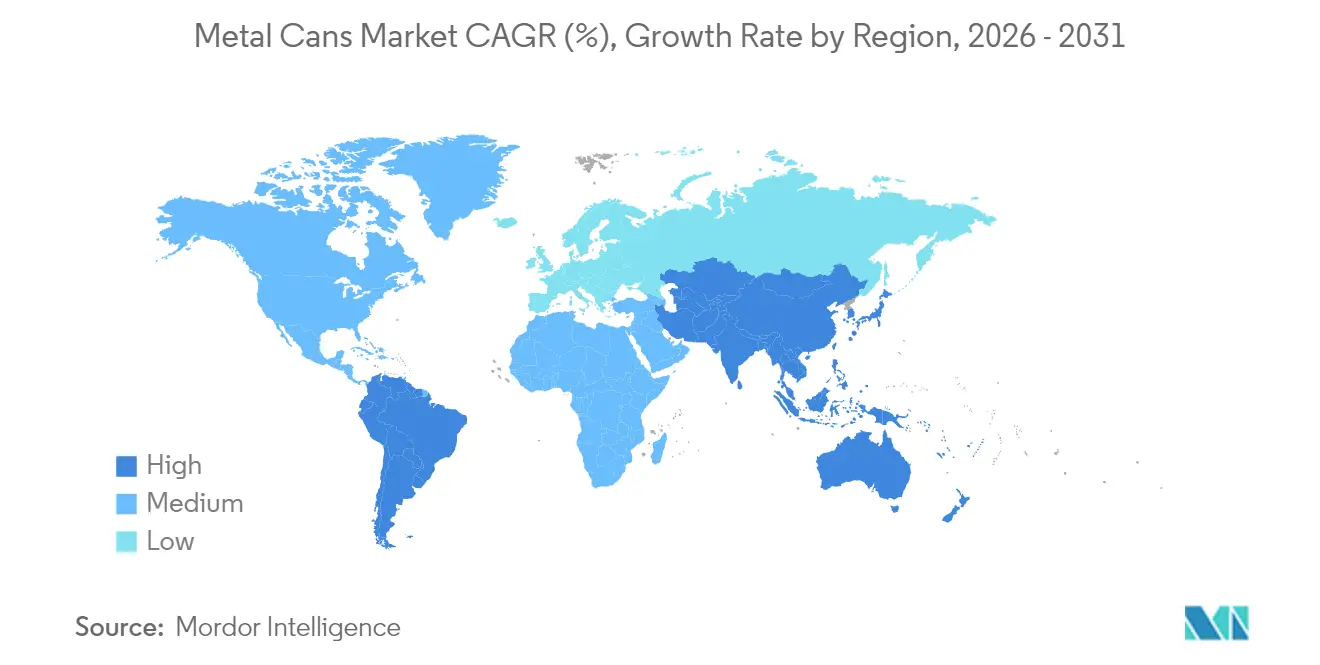
North America led the global metal cans market with 39.72% revenue share in 2025. Mature soft-drink consumption, highly efficient curbside collection, and EPR statutes underpin stable can demand. Regional aluminum recycling rates hover near 75%, ensuring supply security while muting virgin-metal exposure. Recent announcements exceeding USD 200 million for new capacity in the United States and Mexico signal long-term confidence in steady, if incremental, growth.
APAC Metal Cans Market
Asia-Pacific is projected to log a 5.88% CAGR to 2031, the fastest worldwide. Urban migration, rising middle-class incomes, and surging RTD innovations keep can volumes expanding. Japan’s deposit-scheme framework recovered 93% of aluminum cans in 2024, setting a circular-economy benchmark for neighbors. China’s move from import dependence to regional export hub illustrates the strategic shift toward indigenous manufacturing and broader influence over global supply networks.
EMEA and South America Metal Cans Market
Europe balances opportunity and complexity. Stringent BPA rules force costly liner shifts, yet the same regulations elevate cans’ sustainability credentials and accelerate steel-to-aluminum substitution. The Green Deal’s circularity targets amplify recycling premiums, ultimately supporting the metal cans market despite short-term compliance drag. South America and the Middle East and Africa represent frontier demand where infrastructure gaps and price sensitivity slow adoption, but gradual EPR frameworks and digitization could lift can penetration over the forecast horizon.

Value Chain Analysis
The metal cans value chain starts with upstream raw materials and substrates, centered on aluminum and steel supply from smelters and mills, followed by rolling and sheet or coil preparation, and the supply of specialty internal and external coatings and chemicals used for corrosion protection and decoration. Can converters (including Ball, Crown, Ardagh Metal Packaging, and CAN-PACK) then form bodies and ends on high-speed lines, apply liners and inks, and deliver finished packaging to beverage, food, personal care, and pharmaceutical fillers that run on high-throughput filling and seaming systems.
Downstream, distribution economics favor regional manufacturing clusters because empty cans are bulky and transport-sensitive, making freight and warehousing important cost and service determinants, especially during seasonal beverage peaks when capacity can tighten. Recycling and collection systems close the loop by feeding secondary metal back into can sheet. Industry coordination is increasingly visible through initiatives such as the Global Beverage Can Circularity Alliance, which brings can makers, metal producers, and brand owners together around measurable recycling and investment commitments through 2030.
Competitive Landscape
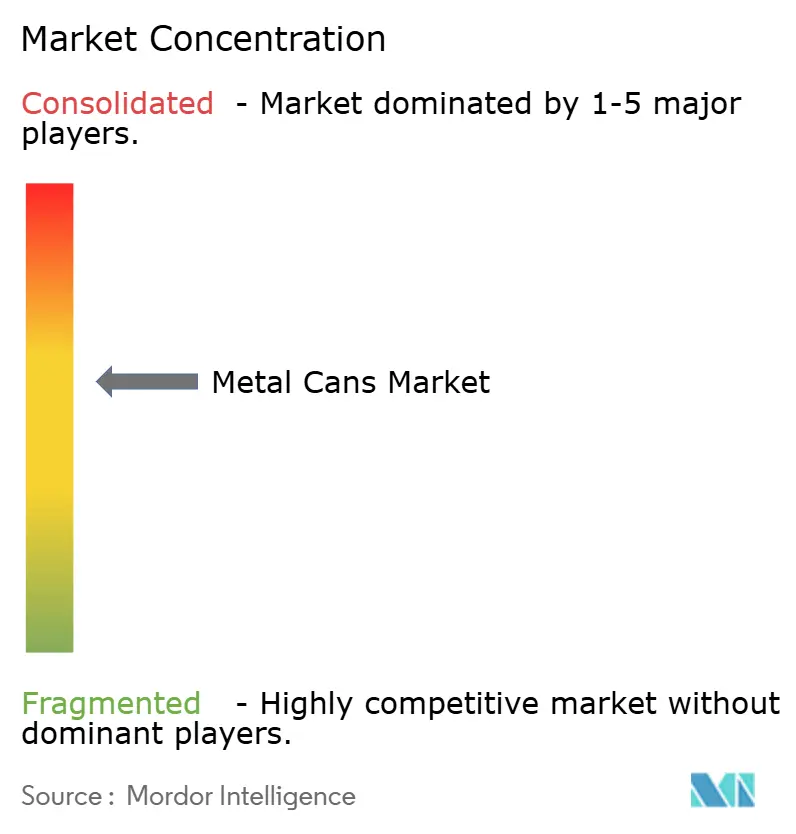
Industry structure is moderately consolidated, with a handful of multinationals controlling large swaths of capacity yet facing nimble regional challengers. Ball Corporation, Crown Holdings, Ardagh Metal Packaging, and Silgan Holdings collectively defend market positions through geographic expansion, lightweighting R&D, and digital printing rollouts. The 2024 acquisition of Helvetia Packaging by Crown bolstered premium food can portfolios in Europe.
Technology races center on reducing metal intensity, embedding smart-codes, and validating BPA-NI liners. Companies are also integrating blockchain audits to assure provenance and differentiate with traceability certifications. Smaller entrants penetrate craft beverage and personal-care niches by offering agile design services and short-run printing, challenging incumbents to enhance service levels.
Steel decarbonization costs and carbon-trading exposure are tilting the competitive field toward aluminum, prompting some converters to retrofit lines accordingly. Strategic alliances-such as Ball’s partnership with Meadow-bring cross-category expertise and broaden aluminum’s reach into sectors historically dominated by plastics. The result is an ecosystem where scale, sustainability credentials, and digital capabilities together define winning positions.
Metal Cans Industry Leaders
Ball Corporation
Crown Holdings Inc.
Ardagh Group S.A.
Silgan Holdings Inc.
CAN-PACK S.A.
- *Disclaimer: Major Players sorted in no particular order
Metal Cans Market Companies Covered in this Report
- Ball Corporation
- Crown Holdings Inc.
- Ardagh Group S.A.
- Silgan Holdings Inc.
- CAN-PACK S.A.
- Toyo Seikan Group Holdings Ltd.
- CPMC Holdings Ltd.
- Showa Denko K.K.
- Mauser Packaging Solutions LLC
- DS Containers Inc.
- CCL Container Inc.
- Independent Can Company
- Hindustan Tin Works Ltd.
- Saudi Arabian Packaging Industry Co. (SAPIN)
- Kian Joo Can Factory Berhad
- Colep Packaging S.A.
- Can-One Berhad
- Greif Metal Packaging Division
- Massilly Holding SAS
- Universal Can Corp.
- Pacific Can China Holdings Ltd.

Market Opportunities and Future Outlook
Capacity additions targeted at high-growth beverage markets create near-term whitespace for local sourcing, faster design cycles, and premium formats, particularly in India, the Middle East, and parts of Latin America. In 2026, Crown Holdings announced a new two-line beverage can facility in Northern India (2.2 billion cans per year nameplate), AGI Greenpac began construction of a greenfield aluminum can plant in Uttar Pradesh (two lines, 1.6 billion cans per year), and CANPACK partnered with Bavaria on a new aluminum can plant in Malambo, Colombia. These steps show converters and beverage groups locking in supply security close to demand centers.
In Europe, the transition workstream around Regulation (EU) 2025/40 (PPWR), which applies from 12 August 2026, expands opportunities for compliant can solutions, including BPA-NI and lower-concern coating systems, harmonized labeling readiness, and higher recycled-content positioning that aligns with EPR eco-modulation frameworks discussed by bodies such as Metal Packaging Europe. Technology upgrades that lower energy and material intensity, including lightweighting alloys such as Ball Corporation's ReAl Gen 2 and higher-efficiency curing and decorating systems, support cost and decarbonization objectives while enabling shorter runs and customization for RTD beverages and premium personal care aerosols.
Recent Industry Developments in Metal Cans Market
- June 2026: Crown Holdings published its 2025 Sustainability Report, highlighting progress across operational programs, including water stewardship results across its global footprint. The disclosure supports customer and regulator scrutiny of packaging supply chains, while reinforcing Crown's positioning with beverage and food brand owners that are tightening supplier sustainability requirements.
- April 2026: Crown Holdings announced plans to establish a two-line beverage can manufacturing facility in Northern India with approximately 2.2 billion cans of annual capacity, targeting both alcoholic and non-alcoholic beverage demand. The move expands local supply options in a fast-growing packaging geography and shifts competitive dynamics for regional can procurement and lead times.
- January 2025: Ball Corporation entered into a strategic alliance with Meadow involving a minority investment to commercialize the MEADOW KAPSUL fully recyclable aluminum can system for personal and home care products. The partnership broadens aluminum can applicability beyond beverages by creating a route to replace plastic packs in select categories, supporting converters pursuing higher-margin specialty formats.


Metal Cans Market Report Scope and Research Methodology
Market Definition and Coverage
For this report, the market covers revenue generated from the sale of metal cans used to pack and protect consumer and industrial products, across major end uses and regions. We treat the market in value terms (USD) and align demand to can consumption across food, beverages, and other packaged goods.
Scope exclusions: This sizing does not count non-can metal packaging formats such as metal drums, pails, or foil-based laminates.
Segments Covered in This Report
- By Material Type
- Aluminium
- Steel
- By Can Structure
- Two-Piece
- Three-Piece
- Monobloc Aerosol
- By Capacity / Size
- ≤250 ml
- 250–500 ml
- 500–1,000 ml
- >1,000 ml
- By Manufacturing Process
- Drawn and Ironed (D&I)
- Drawn and Redrawn (DRD)
- Impact Extrusion
- By End-User Industry
- Food
- Beverage
- Personal Care and Cosmetics
- Pharmaceuticals
- Paints and Industrial Chemicals
- Automotive Fluids and Lubricants
- Other End-User Industry
- By Geography
- North America
- United States
- Canada
- Mexico
- South America
- Brazil
- Argentina
- Chile
- Rest of South America
- Europe
- United Kingdom
- Germany
- France
- Spain
- Italy
- Rest of Europe
- Asia-Pacific
- China
- India
- Japan
- Australia
- South Korea
- Vietnam
- Rest of Asia-Pacific
- Middle East and Africa
- Middle East
- Saudi Arabia
- United Arab Emirates
- Turkey
- Rest of Middle East
- Africa
- South Africa
- Nigeria
- Egypt
- Rest of Africa
- Middle East
- North America
Data Sources, Market Sizing, and Validation
Desk Research
Desk work starts with establishing the demand pool and the packaging context, and then mapping it to where metal cans are actually used. We relied on public sources such as UN Comtrade, the World Bank, OECD, the US Census Bureau, and Eurostat to understand trade, consumption signals, and macro shifts that can move packaged food and beverage volumes.
On the supply side, we reviewed company annual reports, investor presentations, and trusted press coverage to track capacity expansions, plant utilization commentary, and product mix direction. For select steps, a paid subscription covering company financials and another covering shipment-level import export data were used to cross-check revenue ranges and validate trade flows where public data was lagging. These are illustrative examples, and many other public and paid sources were also consulted for data collection, validation, and clarification during the study.
Primary Interviews and Surveys
Primary work was used to pressure-test the desk assumptions on can mix, pricing, and regional demand differences, and then to confirm what changes were actually visible in procurement and production planning. We spoke with a mix of can makers, material and coating ecosystem participants, and end users in packaged food, beverages, and selected industrial categories, with coverage balanced across major regions so the model did not lean on one geography.
Distribution of primary research fieldwork respondents
| Company type | Respondent position | Region |
|---|---|---|
| Top tier: 34% | CXOs: 12% | APAC: 44% |
| Mid tier: 52% | Functional/Unit leaders: 32% | EMEA: 35% |
| Smaller Players: 14% | Managers: 56% | Americas: 21% |
Market-Sizing & Forecasting
The core build uses a top-down approach where packaged-food and beverage activity, along with regional production and trade signals, is translated into a can demand pool and then converted into value using price benchmarks. To make sure totals stayed realistic, results were corroborated with selective bottom-up checks, such as sampled revenue roll-ups for key suppliers, and volume times average selling price checks by major end uses before final adjustments.
Key inputs used in the model include beverage can penetration versus alternative packs, canned food output trends, aluminum and steel pricing direction (which influences realized can pricing), mix shifts between two-piece and three-piece formats, and regional trade and consumption momentum. Where gaps existed in publicly visible volumes or prices, the missing pieces were filled using ranges validated in interviews, and then constrained by what the broader demand indicators could support.
For forecasting, scenario analysis was applied around a base case that blends expected packaged consumption growth with pricing and mix evolution, and then stress-tested for inflation and substitution effects. Each scenario was kept tied to observable drivers so that a client can trace how a variable change moves the final market value.
Data Validation & Update Cycle
Validation is handled through a set of cross-checks that compare the model outputs with independent signals, and then flag anything that does not reconcile to the direction of trade, consumption, or supplier commentary. When a variance is larger than expected, assumptions are revisited, and follow-up outreach is triggered to confirm whether the issue is pricing, mix, or timing.
Before sign-off, the model and logic go through multi-step analyst reviews so arithmetic, unit conversions, and regional allocations are consistent. Reports are refreshed annually, and interim updates are made when material events occur, such as major capacity additions or sharp metal price moves. Right before delivery, a final pass is completed so the view reflects the latest available information.
Mordor Intelligence's Global Metal Cans Market Market Size Versus Other Published Estimates
Published market sizes for metal cans can look far apart even when they describe the same industry, because the counted can formats, end-use boundaries, and pricing assumptions are often not aligned. Differences also come from the chosen base year, the inflation treatment applied to can pricing, and how fast the estimates get updated when material costs and can mix shift.
The biggest gaps usually show up around whether aerosol and specialty impact-extruded formats are included, how much of industrial uses are counted, and whether values are built from demand signals or from broader packaging revenue pools. Currency conversion timing also matters in a global market, since a different exchange-rate window can move the USD total without any real change in local consumption.
Benchmark comparison
| Source | Market Size | Gaps in Research Methodology |
|---|---|---|
| Mordor Intelligence | USD 88.45 B (2026) | |
| Global Consultancy A | USD 77.79 B (2025) | Uses an earlier base year and is more tightly centered on food and beverage applications with closure and can-type splits, which can understate industrial and specialty demand that is captured when end-use coverage is wider. |
| Industry Publisher B | USD 78.00 B (2025) | Includes a broader set of can categories and applies a long forecast window, where aggressive growth and price progression assumptions can widen the gap versus models that anchor price and mix changes to near-term observed signals. |
The table shows a noticeable spread driven mainly by year alignment and what is counted as a metal can, and in Mordor Intelligence's model the 2026 value includes aerosol and other specialty can structures alongside food and beverage, with pricing built from metal-linked movements and interview-validated pass-through. With these scope rules stated clearly and the checks tied to observable demand indicators, the estimate is easier to reproduce and to update when market conditions change.


Key Questions Answered in the Report
How large is the global metal cans market in 2026?
The metal cans market size reaches USD 88.45 billion in 2026 and is projected to advance at a 3.52% CAGR to 2031.
Which region is growing fastest for metal packaging?
Asia-Pacific posts the quickest 5.88% CAGR, propelled by urbanization and surging RTD beverage launches.
What material dominates beverage can production?
Aluminum holds 70.56% market share thanks to its lightweight, infinitely recyclable profile and strong recycling infrastructure.
Why are pharmaceuticals increasing their use of metal cans?
Regulatory focus on tamper evident, track-and-trace capable, chemically inert packaging is steering drug companies toward aluminum formats that meet these requirements.
How are deposit-return systems affecting can demand?
Mandatory DRS schemes lock in high collection rates, supply abundant recycled feedstock, and lower compliance costs, thereby boosting the economic case for metal cans.
Which manufacturing process is gaining share?
Impact extrusion is expanding at a 4.74% CAGR because it delivers seamless walls, reduced scrap, and compatibility with refillable aerosol concepts.
Page last updated on:


 Your data is secure and never sold or shared.


