
Metabolomics Market Size and Share
Market Overview
| Study Period | 2020 - 2031 |
|---|---|
| Market Size (2026) | USD 2.77 Billion |
| Market Size (2031) | USD 4.57 Billion |
| Growth Rate (2026 - 2031) | 10.47 % |
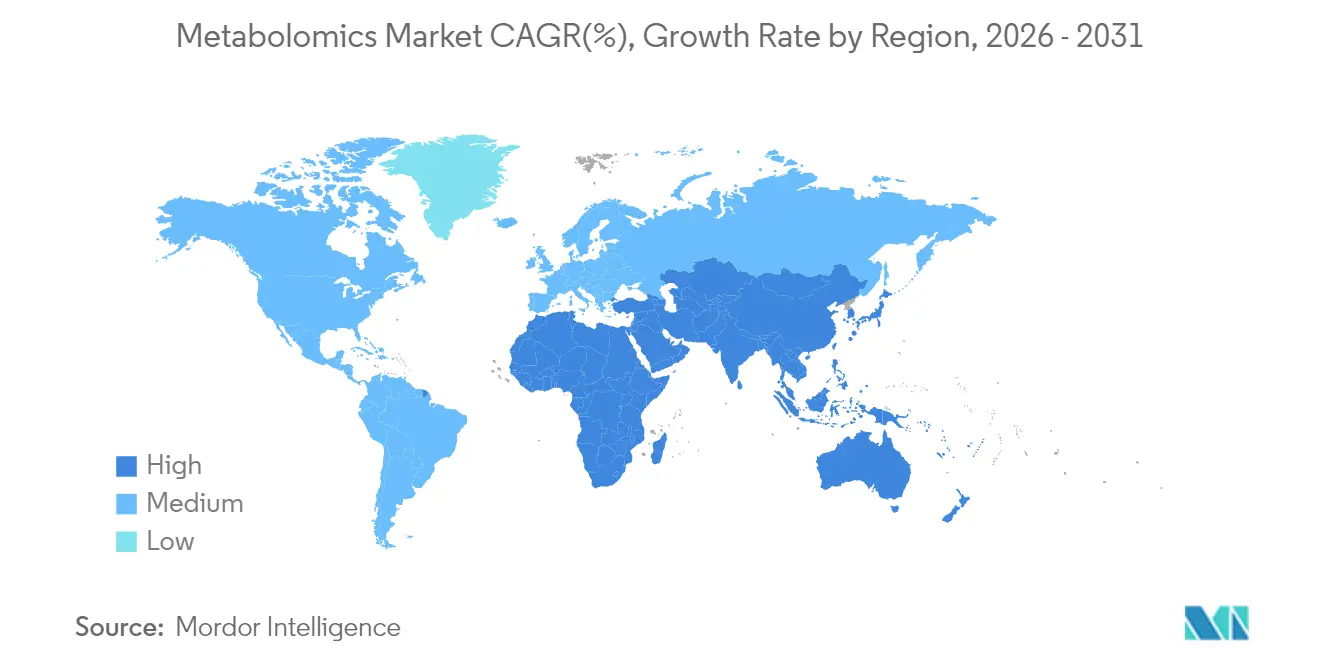
| Fastest Growing Market | Asia Pacific |
| Largest Market | North America |
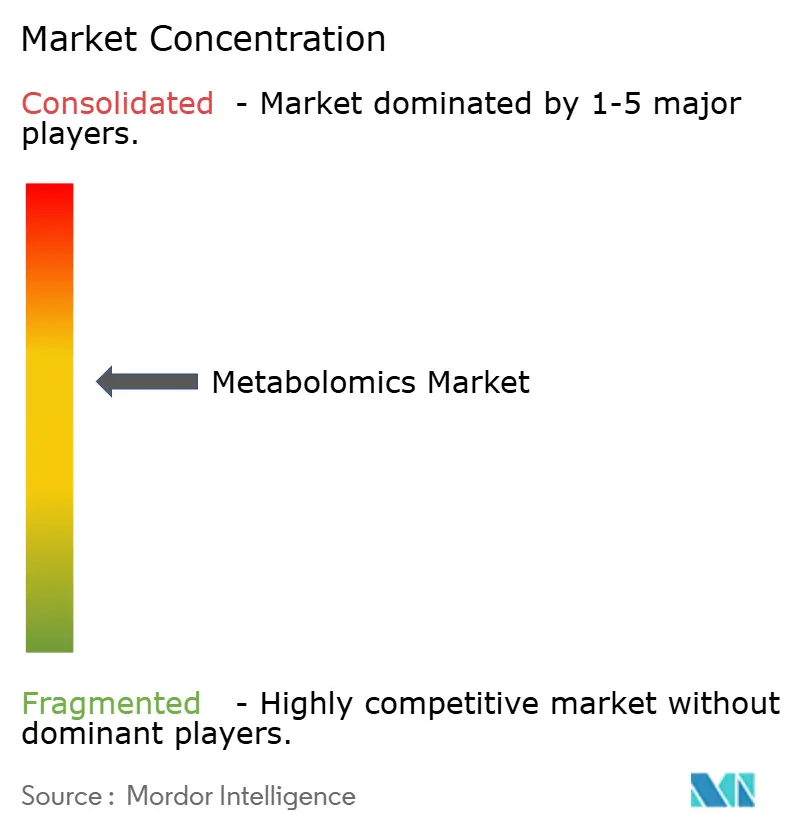
| Market Concentration | Medium |
Major Players *Disclaimer: Major Players sorted in no particular order Image © Mordor Intelligence. Reuse requires attribution under CC BY 4.0. | |
Metabolomics Market Analysis by Mordor Intelligence
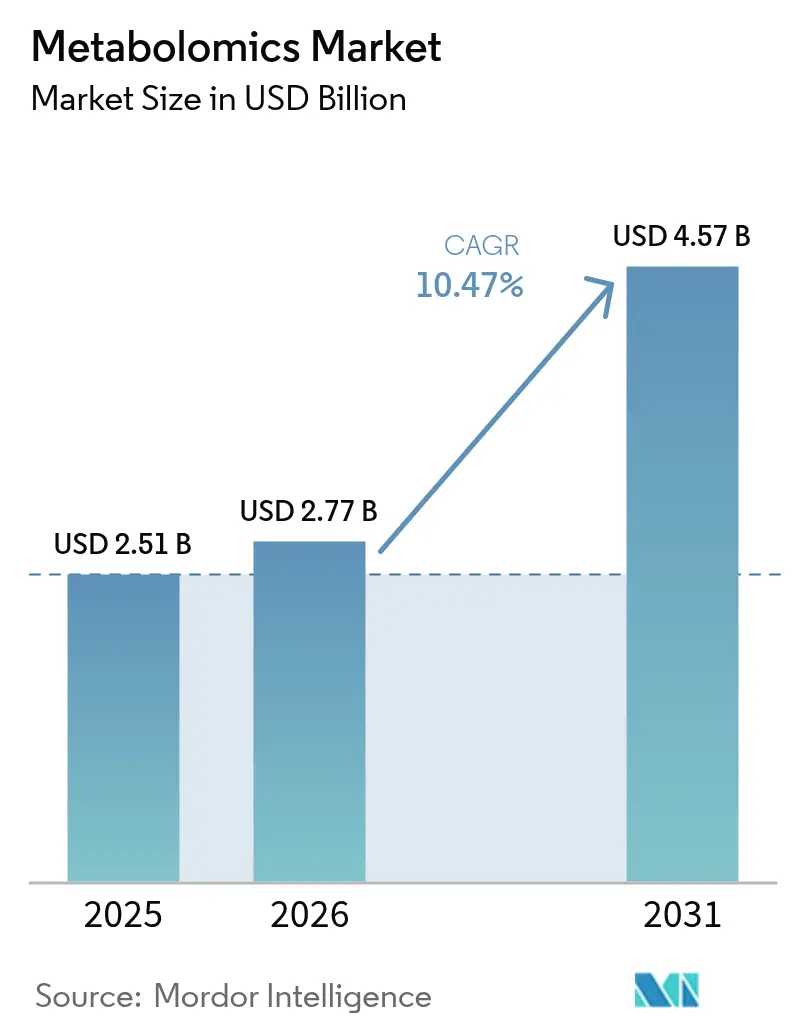
The Metabolomics Market size was valued at USD 2.51 billion in 2025 and estimated to grow from USD 2.77 billion in 2026 to reach USD 4.57 billion by 2031, at a CAGR of 10.47% during the forecast period (2026-2031).
Sustained demand for precision-medicine solutions, rapid improvements in high-resolution mass-spectrometry platforms, and widespread deployment of artificial-intelligence pipelines are the primary forces widening the metabolomics market opportunity set. Pharmaceutical companies are embedding metabolomic readouts in early-stage screening to shorten development timelines, while hospitals are beginning to adopt targeted metabolite panels for routine diagnostics. Regulatory harmonization—most notably the FDA’s Q2(R2) analytical-procedure validation framework gives laboratory directors greater confidence to integrate these assays into clinical workflows. Intensifying competition, manifested in multi-billion-dollar acquisitions of complementary “omics” assets, further highlights the strategic importance of metabolomics within end-to-end life-science toolkits. Collectively, these dynamics underpin robust capital inflows, reinforce the long-term growth trajectory, and solidify the metabolomics market as a cornerstone of next-generation healthcare innovation.
Key Report Takeaways
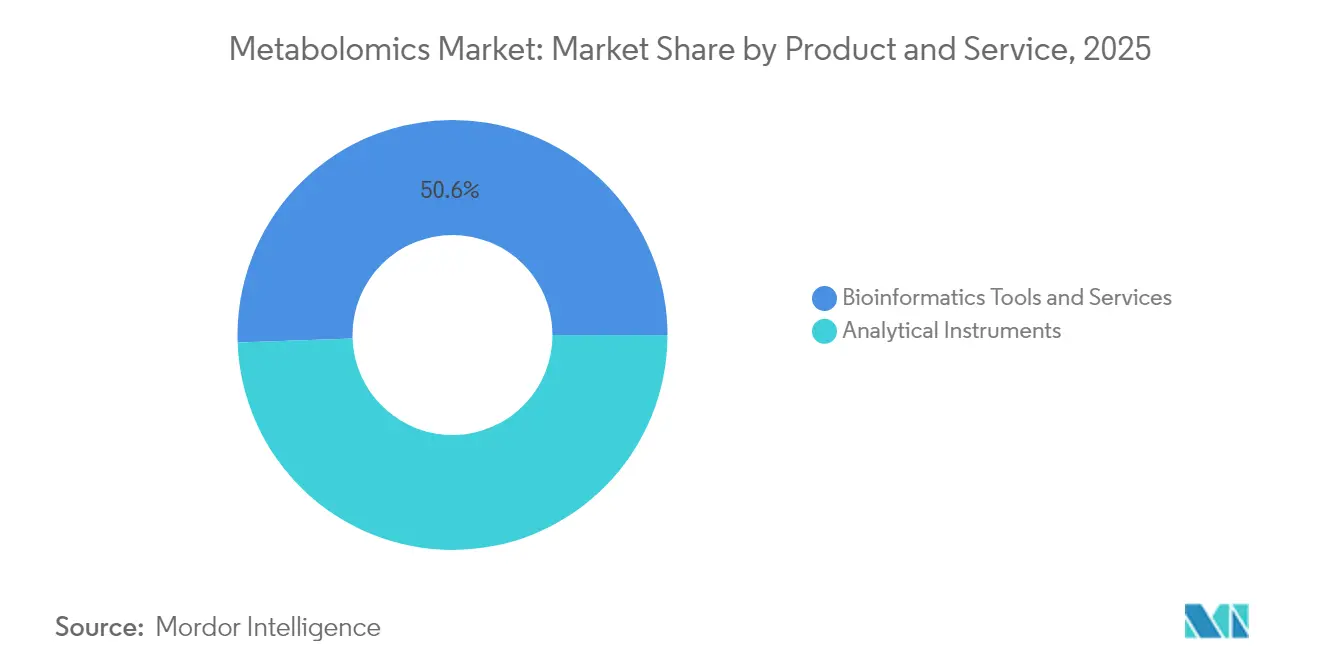
- By product & service, bioinformatics tools and services held 50.55% of 2025 revenue, while the same segment is projected to expand at an 11.21% CAGR through 2031.
- By application, biomarker and drug discovery accounted for 31.05% of the metabolomics market share in 2025; personalized medicine is set to register the fastest 14.68% CAGR to 2031.
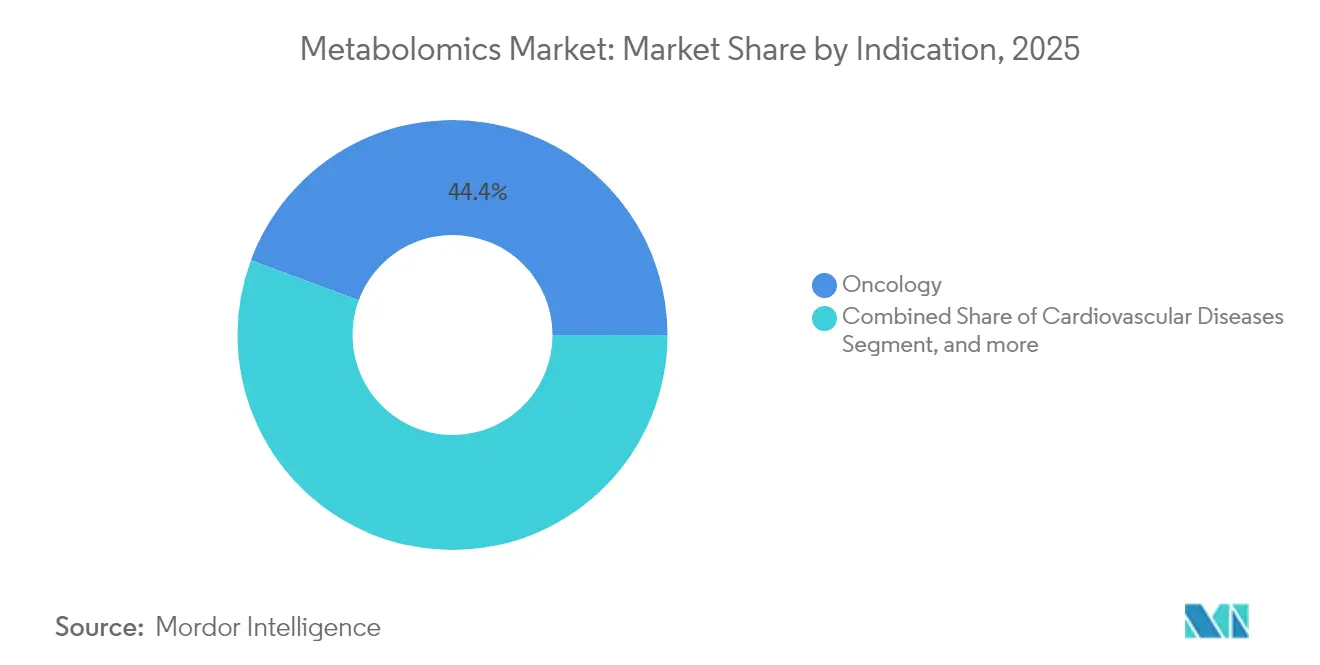
- By indication, oncology dominated with 44.35% revenue share in 2025, whereas neurological disorders lead future growth at a 15.45% CAGR.
- By end user, academic and research institutes led with 36.95% revenue share in 2025; hospitals and diagnostic laboratories deliver the highest 11.08% adoption CAGR to 2031.
- By geography, North America contributed 41.10% of 2025 revenue, while Asia-Pacific is forecast to grow at a 13.22% CAGR through 2031.
Note: Market size and forecast figures in this report are generated using Mordor Intelligence’s proprietary estimation framework, updated with the latest available data and insights as of 2026.
Market Trends and Insights
Drivers Impact Analysis of Metabolomics Market*
| Driver | (~) % Impact on CAGR Forecast | Geographic Relevance | Impact Timeline |
|---|---|---|---|
| Rising Demand for Personalized/Precision Medicine | +2.8% | Global, with early adoption in North America & EU | Medium term (2-4 years) |
| Escalating Public & Private R&D Funding for Omics-Based Drug Discovery | +2.1% | North America, EU, Asia-Pacific core markets | Long term (≥ 4 years) |
| Technological Advances in High-Resolution MS And LC Platforms | +1.9% | Global, manufacturing concentrated in US, Germany, Japan | Short term (≤ 2 years) |
| Growing Adoption of Multi-Omics Workflow Integration in Pharma Pipelines | +1.6% | Global pharmaceutical hubs, spill-over to emerging markets | Medium term (2-4 years) |
| AI-Driven Metabolite-Annotation Platforms Shortening Analysis Time | +1.4% | Technology centers in North America, EU, China | Short term (≤ 2 years) |
| Expansion of Single-Cell & Spatial Metabolomics for Rare-Cell Profiling | +1.2% | Research-intensive regions: North America, EU, Japan | Long term (≥ 4 years) |
| Source: Mordor Intelligence | |||
Rising Demand for Personalized/Precision Medicine
Precision-nutrition and individualized-therapy initiatives are firmly embedding metabolomic readouts into clinical-decision pathways. The NIH has earmarked USD 156 million over five years to study diet-gene-metabolome interactions, underscoring policy-level commitment to patient-specific interventions. Basket and umbrella clinical-trial designs routinely stratify patients by circulating metabolite profiles, which accelerates enrollment and enhances statistical power. Molecular portraits that integrate metabolomics with genomic and proteomic layers improve diagnostic specificity, reduce adverse-event rates, and direct evaluated therapies toward responsive sub-populations. Pharmaceutical sponsors value metabolomic data because it delivers real-time pharmacodynamic feedback that complements static genetic biomarkers. Point-of-care devices, currently undergoing validation, promise to extend these capabilities to primary-care settings, broadening the total accessible patient pool and reinforcing positive uptake momentum across the metabolomics market.
Escalating Public & Private R&D Funding for Omics-Based Drug Discovery
Long-cycle research budgets increasingly allocate dedicated lines to multi-omics infrastructure, with metabolomics frequently cited as a critical short-list priority. Large pharmaceutical enterprises now integrate AI-driven annotation engines, such as PandaOmics, to converge metabolomic, transcriptomic, and proteomic datasets, thereby illuminating novel druggable targets. Competitive grant programs in Europe and Asia-Pacific also fund translational metabolomics for rare-disease research, boosting cross-border collaboration and NGS-linked compound‐screening throughput. Venture and growth-equity investors continue to fund specialist platform companies that convert metabolite libraries into actionable therapeutic insights, bringing fresh capital and commercial discipline to the metabolomics market. These cumulative injections of funding absorb development risk and accelerate time-to-market for data-rich services.
Technological Advances in High-Resolution MS and LC Platforms
Next-generation instrumentation, highlighted by the Stellar platform’s 10-fold sensitivity gain and 5-fold compound-throughput expansion, has markedly enlarged the metabolite dynamic range that researchers can interrogate. SCIEX’s ZT Scan DIA upgrade extends data-independent acquisition to near comprehensive coverage while preserving quantitative linearity. Pairing these hardware improvements with self-supervised learning models trained on millions of spectra drastically slashes manual-curation time, moves discovery workflows upstream, and trims per-sample processing cost. Miniaturized, cartridge-based sample-handling modules further reduce instrument downtime, making high-end platforms viable for regional hospitals rather than only Tier-1 academic centers. Collectively, these innovations widen the installed-base footprint and support double-digit expansion within the metabolomics market.
Growing Adoption of Multi-Omics Workflow Integration in Pharma Pipelines
Spatial multi-omics now overlays metabolomic, genomic, and transcriptomic data at sub-cellular resolution, enabling researchers to map drug-induced metabolic rewiring inside tissue microenvironments. Web-based software suites eliminate coding barriers, allowing bench scientists to run cross-platform analytics through drag-and-drop interfaces.[1]“Metabolomics: Towards Comprehensive Metabolic Profiling,” Nature Biotechnology, nature.com Single-cell metabolomics reveals intra-tumoral heterogeneity and metabolic niche dependencies that bulk assays systematically miss, directing more precise combination-therapy design. Regulatory bodies are codifying guidelines exemplified by the FDA’s Q14 protocol-development framework that legitimize multi-omics methods inside formal submission dossiers.[2]Food and Drug Administration, “Q2(R2) Validation of Analytical Procedures,” fda.gov Standard-setting drives platform vendor alignment and underpins solid commercial value propositions throughout the metabolomics market.
Restraints Impact Analysis of Metabolomics Market*
| Restraint | (~) % Impact on CAGR Forecast | Geographic Relevance | Impact Timeline |
|---|---|---|---|
| Capital-Intensive Nature of Advanced Analytical Instruments | -1.8% | Global, particularly affecting emerging markets and smaller institutions | Short term (≤ 2 years) |
| Shortage Of Bioinformaticians with Metabolome Expertise | -1.2% | Global, most acute in Asia-Pacific and emerging markets | Medium term (2-4 years) |
| Lack of Globally Harmonised Metabolite Reference Standards | -0.9% | Global, with regulatory fragmentation between US, EU, and Asia-Pacific | Long term (≥ 4 years) |
| Data-Privacy Hurdles in Federated Clinical Metabolomics Networks | -0.7% | EU and North America primarily, expanding to global markets | Medium term (2-4 years) |
| Source: Mordor Intelligence | |||
Capital-Intensive Nature of Advanced Analytical Instruments
State-of-the-art high-resolution mass spectrometers often sell for USD 500,000–2 million, with recurrent service contracts adding 10-15% of purchase cost annually. Smaller institutions struggle to justify such capital outlays, constraining broader diffusion and keeping usage concentrated among well-funded centers. Vendor-hosted leasing models and collaborative core-facility networks provide interim relief, yet budgetary headwinds remain a formidable drag. The metabolomics market nevertheless benefits from gradual cost compression as modular, 3D-printed components reduce manufacturing expense. Cloud-connected platforms that enable remote operation and data processing further alleviate on-site infrastructure requirements, slightly easing this restraint’s severity over time.
Shortage of Bioinformaticians with Metabolome Expertise
Comprehensive metabolomic analysis demands cross-disciplinary skill sets that meld analytical chemistry, machine learning, and systems biology talent that remains in short supply.[3]“Urinary Metabolite Signatures for Early Alzheimer’s Detection,” Frontiers in Aging Neuroscience, frontiersin.org Emerging markets face heightened scarcity as competitive salaries in established regions siphon specialized professionals. Universities have begun rolling out tailored curricula, but graduate output is still below growing laboratory demand. Automated annotation pipelines and low-code visualization modules partially bridge the expertise gap, permitting non-specialists to generate publication-quality insights. Even so, talent acquisition challenges temper the pace at which newly equipped facilities can scale, marginally dampening near-term expansion within the metabolomics market.
*Our forecasts treat driver/restraint impacts as directional, not additive. The impact forecasts reflect baseline growth, mix effects, and variable interactions.
Metabolomics Market Segment Analysis
By Product & Service:
Bioinformatics Dominance Drives Market EvolutionThe bioinformatics tools and services segment captured 50.55% of the metabolomics market size in 2025 and is projected to sustain an 11.21% CAGR through 2031, reflecting the data-centric orientation of modern metabolomics workflows. This leadership is anchored in the recognition that fewer than 2% of recorded spectra can be matched to curated libraries, turning algorithmic annotation into the field’s primary bottleneck. Emerging cloud-native engines automatically cross-reference spectral data against ever-larger repositories while ranking putative compound identities with probabilistic confidence scores. Multi-tenant deployment models distribute computational overhead and lower entry barriers for resource-constrained laboratories, further expanding total addressable users inside the metabolomics market.
Sophisticated pipelines such as microbeMASST now integrate taxonomic metadata, unlocking previously invisible microbial-metabolite linkages and fuelling downstream functional-omics investigations. As user interfaces simplify, bench scientists without advanced coding experience can execute high-dimensional pathway mapping, which in turn accelerates hypothesis generation. Hardware vendors reinforce symbiotic demand by offering end-to-end instrument-to-cloud data capture and automated upload utilities. This virtuous cycle elevates bioinformatics from a back-office support role to a primary revenue engine, ensuring the segment’s continued prominence within the broader metabolomics market.


By Application:
Personalized Medicine Reshapes Clinical MetabolomicsBiomarker and drug discovery maintained 31.05% revenue share in 2025; however, personalized-medicine workflows will lead expansion at a 14.68% CAGR, confirming the strategic importance of patient-specific interventions. Consumer interest in nutrition-based disease prevention, alongside clinical adoption of treatment-tailoring assays, is realigning investment priorities toward comprehensive profile-matching services. Toxicology programs leverage untargeted metabolomic screens to uncover off-pathway liabilities earlier in the pipeline, saving late-stage attrition cost and guiding revision cycles. Nutrigenomics applications assess bioactive-compound bioavailability and metabolic adaptation, delivering actionable dietary recommendations that resonate with wellness-oriented stakeholders across the metabolomics market.
Clinical laboratories implement validated panels for metabolic disorders, chronic kidney disease, and oncology recurrence monitoring, demonstrating real-world utility and reimbursement readiness. The rise of multiplex assays capable of quantifying hundreds of analytes simultaneously enhances diagnostic yield per sample, lowering per-target cost and increasing clinician adoption. Integration with electronic health-record systems further embeds metabolomic data into routine care, reinforcing personalized medicine’s status as the high-growth frontier of the metabolomics market.
By Indication:
Neurological Disorders Drive Innovation Beyond OncologyOncology retained a 44.35% revenue lead in 2025, yet neurological applications will outpace all others with a 15.45% CAGR to 2031 as researchers discover early-stage metabolic fingerprints for neurodegeneration. Urine-based markers such as theophylline show promise for non-invasive Alzheimer’s screening, offering alternatives to spinal-fluid taps and complex imaging studies. Similarly, metabolomic interrogation of Parkinson’s disease reveals folate and tetrahydrobiopterin pathway disruption, inviting targeted supplementation trials. Spatial metabolomics applied to brain-tumor tissues uncovers microenvironment-specific nutrient dependencies, guiding local-delivery therapeutic concepts within the metabolomics market.
Cardiovascular and infectious-disease research maintains solid footing, but the distinct unmet need in early neurodegenerative diagnosis positions neurological-disorder assays at the innovation forefront. Pharma pipelines increasingly reference cerebrospinal-fluid metabolic profiles for patient stratification in adaptive-design trials, accelerating evidence generation. Public-funded consortia pool large-scale biobank samples to expand statistical power, propelling biomarker validation forwards and highlighting this indication’s strategic significance for the metabolomics market.
By End User:
Clinical Translation Accelerates Hospital AdoptionAcademic and research institutes held 36.95% of 2025 revenue; nonetheless, hospital and diagnostic-laboratory contracts are forecast to grow at an 11.08% CAGR as certified assays transition from bench to bedside. Clearer regulatory pathways, combined with evidence of clinical utility, are pushing procurement committees to allocate capital toward mass-spectrometry-based platforms. Point-of-care devices that deploy cartridge-miniaturized NMR or ambient-ionization MS remove logistical delays inherent in centralized testing and open new channels across the metabolomics market.
Contract research organizations (CROs) enhance adoption velocity by offering turnkey multi-omics trial-support packages, de-risking complex analytical requirements for sponsors. Pharmaceutical companies outsource high-volume profiling to specialized CROs while reserving core-capability investments for strategic discovery workflows. This flexible capacity model smooths demand spikes and ensures that new entrants can access best-in-class technical infrastructure without heavy upfront costs. Consequently, hospital adoption of validated panels is set to scale rapidly, further embedding clinical metabolomics in routine care pathways.
Geography Analysis
North America Metabolomics Market
North America preserved 41.10% revenue leadership in 2025, fortified by robust NIH and enterprise-level R&D spending, mature regulatory frameworks, and local manufacturing reinvestment exemplified by Thermo Fisher Scientific’s USD 2.0 billion capacity expansion plan. The metabolomics market size for the United States reflects widespread deployment of multi-omics oncology tests, fast catch-up of metabolic-panel reimbursement, and extensive academic-industry partnerships. Canada’s precision-health initiatives and Mexico’s growing pharmaceutical export capacity provide incremental lift, sustaining the region’s aggregate revenue share. Data-privacy legislation such as the California Consumer Privacy Act drives early adoption of privacy-enhancing computation, reinforcing North American leadership in secure, interoperable metabolomics data platforms.
APAC Metabolomics Market
Asia-Pacific represents the fastest-growing territory at a 13.22% CAGR through 2031, driven by China’s localization of high-end mass-spectrometer assembly and India’s scaling clinical-trial infrastructure. Government stimulus packages covering precision medicine, coupled with inward foreign-direct investment, underpin capacity build-out across Tier-1 hospitals. Japan’s Foods with Function Claims framework enables metabolomics-supported functional-food labels that command premium shelf pricing, extending commercial relevance beyond pharma into consumer-health sectors. Australia and South Korea leverage strong academic ecosystems to attract multinational-sponsored trials, further enlarging the regional metabolomics market footprint.
Europe Metabolomics Market
Europe maintains a substantial portion of global revenue through coordinated Horizon-funded research networks, established biopharmaceutical clusters, and accelerated adoption of privacy-preserving data federations. Germany’s engineering prowess undergirds continued instrumentation innovation, while the United Kingdom pushes translational medicine programs that embed metabolomics into National Health Service pilot pathways. France streamlines reimbursement for multi-omics oncology tests, stimulating domestic laboratory demand. Italy and Spain add volume via growing clinical-research outsourcing assignments. The European Commission’s emphasis on green and sustainable agrifood supply chains triggers additional metabolomics market applications in food authenticity and environmental surveillance, providing diversified revenue channels across the continent.

Regulatory Landscape
Regulatory oversight for metabolomics is implemented through requirements around bioanalytical validation and, when metabolomics is used clinically, IVD and data-governance controls. In the United States, the FDA has been expanding guidance relevant to omics-derived endpoints and analytical procedures, including its Q2(R2) analytical-procedure validation framework referenced by laboratories adopting targeted panels, and a March 2026 draft guidance on the use of New Approach Methodologies (NAMs) in drug development that outlines expectations for validating novel data streams such as omics-based approaches.
In Europe, the EMA routes method acceptance for novel metabolomics approaches through qualification pathways for novel methodologies and scientific advice, while aligning with the ICH M10 bioanalytical method validation guideline (in effect since January 2023) for studies supporting marketing authorization. When metabolomics outputs are used as clinical tests or software-assisted tools, the EU MDR/IVDR regimes also apply, and AI-enabled analytics for interpretation increasingly intersect with governance under the EU Artificial Intelligence Act (Regulation (EU) 2024/1689). Across regions, international standards such as ISO 23118:2021 for pre-examination handling of human specimens provide practical anchors for sample integrity and documentation in clinical and translational metabolomics workflows.
Competitive Landscape
The metabolomics market features moderate concentration, with legacy analytical-instrument giants expanding through inorganic moves while specialist software firms carve out high-growth niches. Thermo Fisher Scientific, Agilent Technologies, and Waters Corporation command outsized installed bases, leveraging life-cycle service contracts and consumables bundles to lock in customers. Thermo Fisher’s USD 3.1 billion Olink acquisition and forthcoming USD 4.1 billion Solventum purchase demonstrate aggressive portfolio broadening aimed at vertical integration from sample prep to data analytics. Agilent pairs cutting-edge hardware with proprietary ChemStation software upgrades that streamline study design, hoping to counter software-driven challengers.
Emerging players differentiate through AI-first product strategies. Metabolon secured USD 60 million of credit, allocating funds to scale its metabolite-library expansion and automated-analysis engine. Olaris, now backed by Bruker equity, launched an NMR-based kidney-transplant monitoring assay, illustrating how focused disease-area solutions can achieve rapid market entry. SCIEX deepened its computational stack by partnering with Bioinformatics Solutions Inc., fusing ZenoTOF hardware with cloud-delivered peptide-search algorithms that enhance proteomics depth and feed metabolomics pathway-cross-talk analysis.
Competitive intensity is expected to heighten as point-of-care vendors enter the field. Companies developing cartridge-style ambient-ionization modules seek to bypass traditional bench‐top hardware, disrupting incumbent revenue streams. Privacy-preserving federated-learning platforms promise compliant cross-institutional data sharing, opening white-space for SaaS vendors unattached to instrument chains. Finally, sustained pharma demand for spatial metabolomics and 3-dimensional tissue mapping will reward firms that combine hardware, reagents, and AI analytics into seamless turnkey offerings, reshaping competitive dynamics across the metabolomics market.
Metabolomics Industry Leaders
Thermo Fisher Scientific Inc.
Bio-Rad Laboratories
Agilent Technologies Inc.
Bruker
Danaher Corporation (SCIEX)
- *Disclaimer: Major Players sorted in no particular order
Metabolomics Market Companies Covered in this Report
- Thermo Fisher Scientific
- Agilent Technologies
- Danaher – SCIEX
- Waters Corporation
- Bruker
- Shimadzu
- PerkinElmer
- LECO
- Bio-Rad Laboratories
- Kore Technology
- Metabolon
- Biocrates Life Sciences
- Chenomx
- Metabolomic Discoveries
- Creative Proteomics
- Human Metabolome Technologies
- Metabolomics Australia
- Exalenz Bioscience
- Owlstone Medical
- AbsoluteIDQ

Market Opportunities and Future Outlook
Clinical translation and infrastructure build-out are opening near-term whitespace for standardized, high-throughput workflows that convert metabolite signatures into operational clinical and research services. Centralized and shared-resource facilities are particularly attractive for lowering access barriers to advanced instrumentation and specialized staff, which is consistent with NIH-backed modernization programs such as the UCSF Quantitative Metabolite Analysis Center (QMAC) and the NIH-funded Center for Single-Cell and Spatial Metabolomics & Multi-Omics (S2M2) at UC San Diego, which uses Bruker Daltonics instrumentation. By expanding the number of projects that can be run under consistent QC and repeatable protocols, these investments lift demand for analytical instruments, consumables, and bioinformatics subscriptions.
There is also an opportunity to productize exposome and population-health use cases as they move from exploratory studies toward commercial kits and services, including both targeted quantitation and scalable annotation software. A March 2026 project announced by MetabolomiX Inc. and the University of Alberta to develop and commercialize the QUANTEX-600 kit, measuring over 600 chemicals from small blood samples, illustrates how research capability can be translated into repeatable laboratory workflows. Ongoing emphasis on ISO-aligned assays and method standardization, supported by funding to expand the Metabolomics Innovation Centre (TMIC) tool suite (May 2024), further supports end-to-end offerings that combine validated methods, reference materials, and automated bioinformatics for hospitals, CROs, and multi-site research networks.
Recent Industry Developments in Metabolomics Market
- June 2026: Agilent Technologies collaborated with Sound Analytics to launch an integrated LC/MS workflow for DMPK laboratories, combining the 1290 Infinity III system and 6495D triple quadrupole MS with LeadScape for Agilent software. The release supports turnkey, standardized deployment for high-throughput metabolism studies and increases attach potential for software and services alongside core instrumentation.
- May 2026: Thermo Fisher Scientific unveiled the Thermo Scientific Orbitrap Tribrid Apex and Orbitrap Excedion mass spectrometers at ASMS 2026, highlighting enhanced dynamic range (eDR) capabilities for applications including drug metabolism studies. The launch sets performance benchmarks for high-resolution MS platforms used in metabolomics and reinforces competitive differentiation tied to sensitivity and throughput in multi-omics workflows.
- October 2024: Agilent Technologies and the National University of Singapore established the NUS-Agilent Center of Excellence in Cell Metabolism to support large-scale metabolic profiling using platforms such as Seahorse XF and xCELLigence technologies. The center anchors local application development and validation activity, creating a channel for method standardization and broader regional adoption in academic and population-health settings.


Metabolomics Market Report Scope and Research Methodology
Market Definition and Coverage
This market is defined as the global revenues generated from metabolomics workflows that help identify and quantify small molecule metabolites from biological samples. It includes tools, consumables, software, and related services that support the full analysis process across research and applied lab settings.
Scope exclusions: Standalone multi-omics instruments or analytics sold specifically for proteomics or genomics only are excluded from the market totals.
Segments Covered in This Report
- By Product & Service
- Analytical Instruments
- Separation Techniques
- Liquid Chromatography
- Gas Chromatography
- Capillary Electrophoresis
- Detection Techniques
- Mass Spectrometry
- Nuclear Magnetic Resonance
- Other Detection Techniques
- Separation Techniques
- Bioinformatics Tools & Services
- Analytical Instruments
- By Application
- Biomarker & Drug Discovery
- Toxicology
- Nutrigenomics
- Personalized Medicine
- Clinical Diagnostics
- Environmental & Agricultural Research
- By Indication
- Oncology
- Cardiovascular Diseases
- Neurological Disorders
- Infectious Diseases
- Metabolic Disorders
- By End User
- Academic & Research Institutes
- Pharmaceutical & Biotechnology Companies
- Contract Research Organizations
- Hospitals & Diagnostic Laboratories
- By Geography
- North America
- United States
- Canada
- Mexico
- Europe
- Germany
- United Kingdom
- France
- Italy
- Spain
- Rest of Europe
- Asia-Pacific
- China
- Japan
- India
- Australia
- South Korea
- Rest of Asia-Pacific
- Middle East & Africa
- GCC
- South Africa
- Rest of Middle East & Africa
- South America
- Brazil
- Argentina
- Rest of South America
- North America
Data Sources, Market Sizing, and Validation
Desk Research
Desk research starts with mapping the demand context and the operating footprint for metabolomics across regions, and then shaping the key inputs into a consistent model structure. Public sources were used to anchor core signals, including NIH and NCBI publications, FDA device and diagnostics information where relevant, CDC health statistics, OECD health and R&D indicators, and World Bank macro series to help normalize spend patterns and lab capacity.
The evidence base was widened using annual reports, investor decks, and earnings commentary from companies active in instruments, software, and services. Reputable press and association materials were also reviewed for how lab practice and adoption are tracked. Paid subscriptions were referenced for company financial details and intelligence, patent databases, and shipment-level import and export views to sanity check supply-side movement for key instrument classes and consumables. The sources listed above are illustrative only, and additional public documents and datasets were also reviewed to collect inputs, run cross-checks, and clarify assumptions.
Primary Interviews and Surveys
Primary work was done through expert interviews and structured surveys with lab decision makers, researchers, service providers, and channel participants across major regions. These discussions helped confirm what is counted as metabolomics revenue versus adjacent omics spend, and they were also used to align assumptions on utilization, price bands, and the split between instruments, consumables, software, and fee-based services.
Distribution of primary research fieldwork respondents
| Company type | Respondent position | Region |
|---|---|---|
| Top tier: 28% | CXOs: 14% | APAC: 41% |
| Mid tier: 54% | Functional/Unit leaders: 33% | EMEA: 33% |
| Smaller Players: 18% | Managers: 53% | Americas: 26% |
Market-Sizing & Forecasting
Sizing is built using top-down and bottom-up logic. The lab and research demand pool is reconstructed by region, and then filtered through metabolomics adoption, workflow intensity, and typical spend per workflow for instruments, consumables, software, and services. Results are then checked using selective bottom-up approximations, such as sampled ASP times unit volumes for key instrument types, channel checks on consumables pull-through, and service revenue ranges from specialist providers, which helps correct for over or under counting.
Key inputs used in the model include research funding direction and publication momentum, installed base expansion for mass spectrometry and NMR usage in life science labs, instrument replacement cycles, consumables attachment rates, and the mix shift toward outsourced studies and bioinformatics usage. Where sub-segment data is thin, gaps are handled by applying conservative adoption curves supported by interviews and using region-specific price bands instead of one global average.
Forecasting is carried out using scenario analysis supported by a light multivariate regression on a small set of drivers that tend to move the market steadily over time, including R&D intensity, clinical translation activity, and lab capacity additions. The final growth path is then aligned to the consensus ranges heard from primary respondents, so unusual jumps are challenged before the numbers are finalized.
Data Validation & Update Cycle
Validation is done in layers so the model does not rely on one data stream. Outputs are compared against independent signals such as instrument shipment direction, publication and grant trends, and service outsourcing momentum. Variances outside expected ranges for a region or component are then investigated.
Before sign-off, the work goes through analyst reviews that check calculation logic, unit consistency, and currency conversions. Any sensitive assumptions are re-tested with follow-up outreach when needed. Reports are refreshed annually, with interim updates when material events can shift demand, and a final pre-delivery review is completed so clients receive the most current view available at the time of release.
Mordor Intelligence's Global Metabolomics Market Market Sizing Compared With Other Published Estimates
It is common to see different market sizes for metabolomics because publishers do not always count the same revenue streams, and they may also use different base years and growth paths. The biggest swings usually come from what gets included beyond core metabolomics workflows, and from how pricing and adoption are carried forward in the forecast window.
Key gap drivers in this market often include whether bioinformatics is counted as a narrow metabolomics add-on or as a broader analytics bucket, whether adjacent multi-omics platforms are blended into the total, and how instrument replacement and consumables pull-through are treated when labs expand capacity. Some estimates also apply aggressive adoption assumptions for clinical diagnostics use, or they update currency conversion timing differently, which can change a global number even when local demand has not moved much.
Mordor Intelligence treats these scope and timing differences directly in the review of published ranges, using consistent metabolomics workflow boundaries and cross checks to avoid mixing adjacent omics analytics into the base.
Benchmark comparison
| Source | Market Size | Gaps in Research Methodology |
|---|---|---|
| Mordor Intelligence | USD 2.77 B (2026) | |
| Industry Publisher A | USD 3.77 B (2024) | Uses an earlier base year and tends to present a wider revenue umbrella, where adjacent technology spend and a broader set of services can be blended into metabolomics totals, which lifts the starting value. |
| Global Publisher B | USD 2.69 B (2023) | Uses a different base year and a higher growth profile through 2031, and it does not clearly separate metabolomics-only software and services from broader omics analytics, a scope treatment applied by Mordor Intelligence. |
The spread in the table is mainly explained by base-year choice and by how strictly metabolomics-only revenues are separated from adjacent omics and general analytics services. By keeping the scope tied to metabolomics workflows and then checking totals against practical adoption and pricing signals, the number stays traceable to clear inputs and repeatable steps.


Key Questions Answered in the Report
What is the current size of the metabolomics market?
The metabolomics market is valued at USD 2.77 billion in 2026 and is projected to reach USD 4.57 billion by 2031.
Which product segment leads the metabolomics market?
Bioinformatics tools and services lead with 50.55% revenue share in 2025 and exhibit an 11.21% CAGR outlook.
Why is Asia-Pacific considered the fastest-growing region?
Localized instrument manufacturing in China and expanding clinical-research capacity in India push Asia-Pacific to a 13.22% CAGR through 2031.
How are hospitals adopting metabolomics?
Hospitals and diagnostic labs are integrating validated metabolite panels for disease monitoring, growing at an 11.08% CAGR due to clearer regulatory guidance.
What technological advances are accelerating the field?
Next-generation mass spectrometry platforms offering 10-fold sensitivity gains and AI-powered annotation tools drastically reduce analysis time and broaden application scope.
Which indications show the highest growth potential?
Neurological disorders lead future growth with a 15.45% CAGR, driven by advances in early-stage Alzheimer’s and Parkinson’s biomarkers.
Page last updated on:


 Your data is secure and never sold or shared.


