
Medical Robotic Systems Market Size and Share
Market Overview
| Study Period | 2020 - 2031 |
|---|---|
| Market Size (2026) | USD 17.92 Billion |
| Market Size (2031) | USD 37.44 Billion |
| Growth Rate (2026 - 2031) | 15.88 % |
| Fastest Growing Market | Asia Pacific |
| Largest Market | North America |
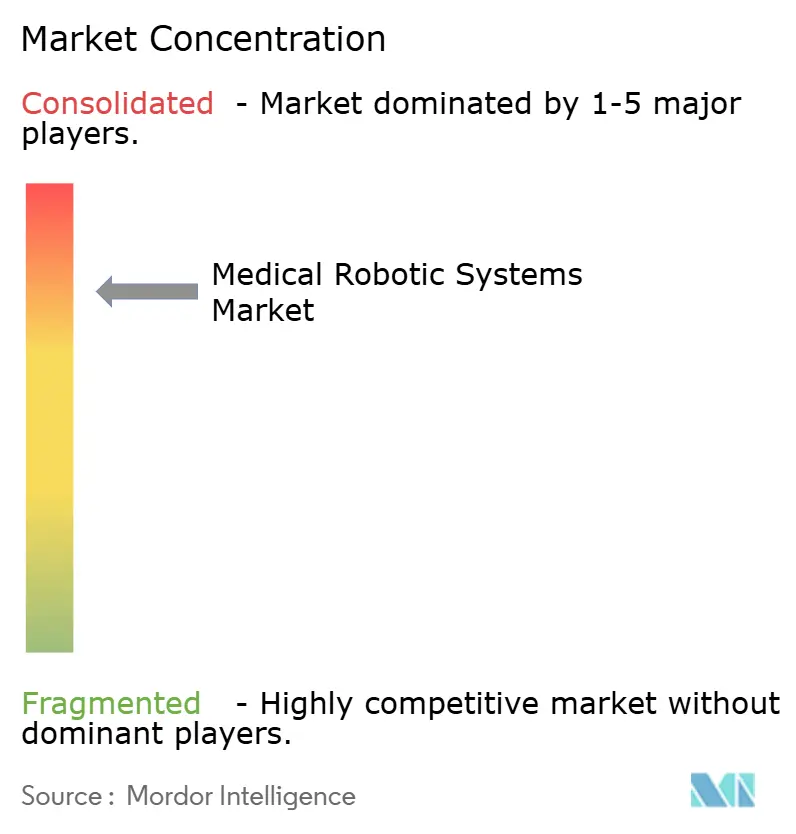
| Market Concentration | High |
Major Players *Disclaimer: Major Players sorted in no particular order Image © Mordor Intelligence. Reuse requires attribution under CC BY 4.0. | |
Medical Robotic Systems Market Analysis by Mordor Intelligence
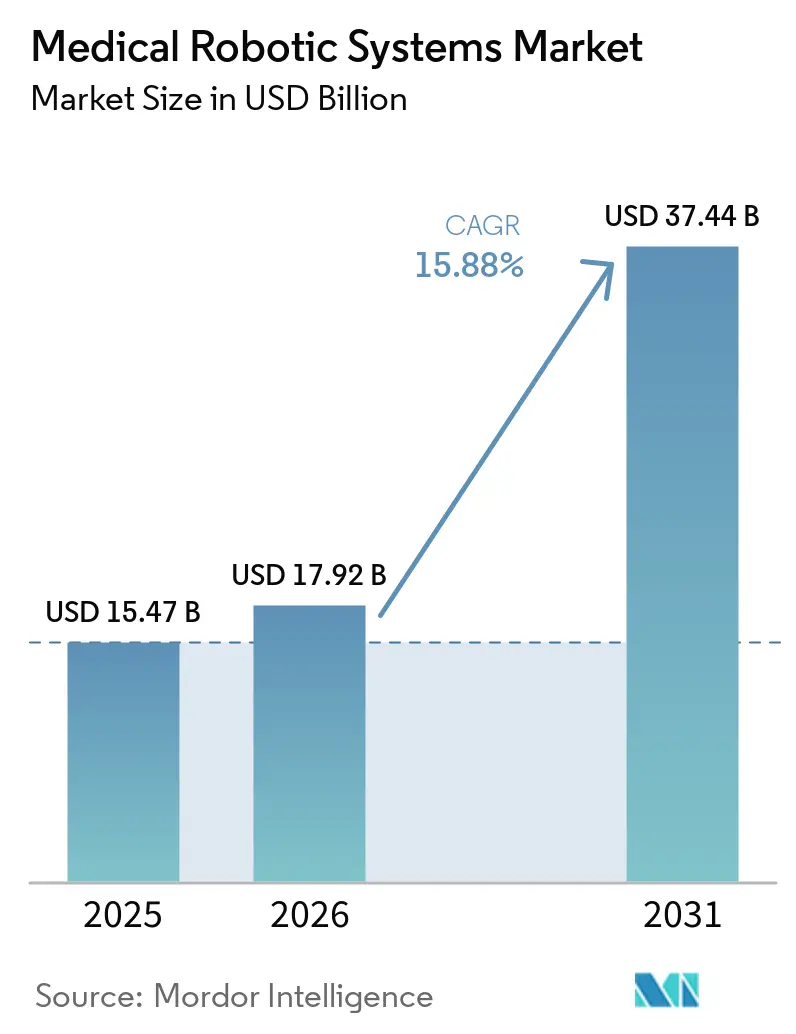
The medical robotic systems market size is expected to grow from USD 15.47 billion in 2025 to USD 17.92 billion in 2026 and is forecast to reach USD 37.44 billion by 2031 at 15.88% CAGR over 2026-2031. Growing convergence between artificial intelligence and precision engineering, subscription-based financing that removes capital barriers, and regulatory policies that favor automated solutions are key accelerants. Procedure volumes are rising fastest in outpatient surgery centers across the United States and Europe, while China’s tier-3 hospitals deploy oncology-focused platforms to shorten cancer treatment queues. North America maintains its leadership through favorable reimbursement, while the Asia-Pacific region registers the steepest growth curve as government-sponsored rehabilitation programs expand access. Competitive positioning hinges on the installed base, clinical evidence, and the ability to wrap hardware in data-driven service contracts that secure recurring revenue.
Key Report Takeaways
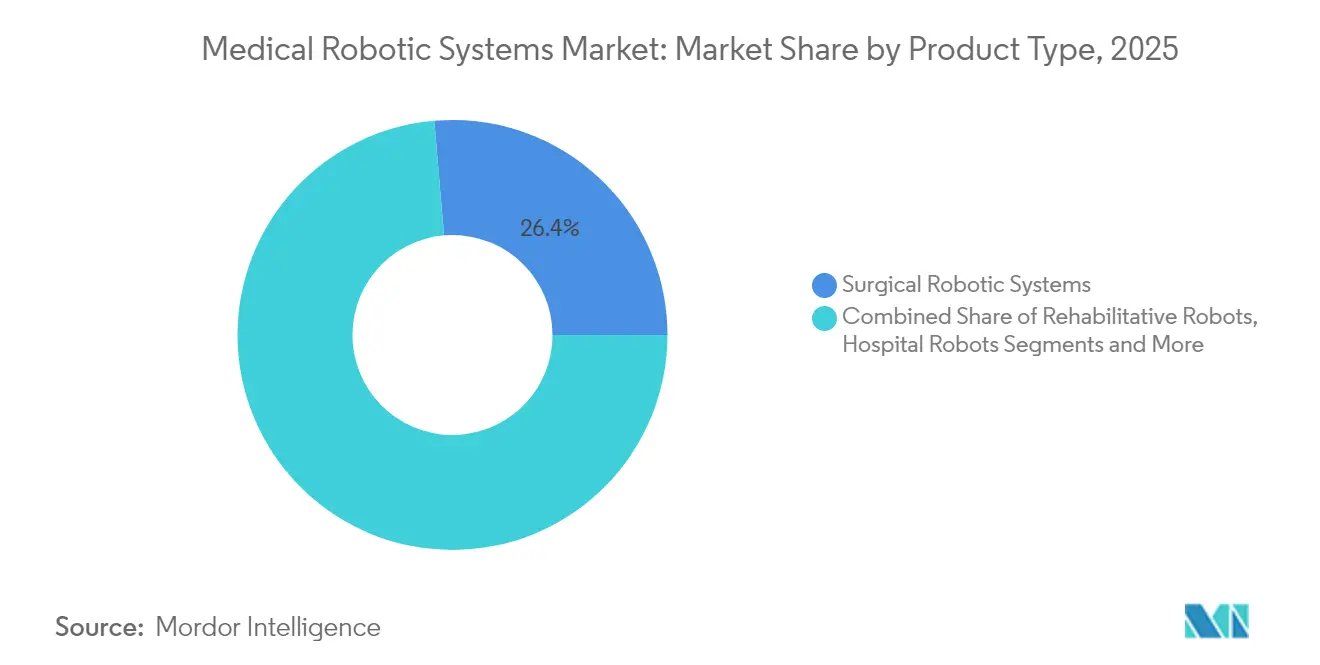
- By product type, surgical robotic systems led the medical robotic systems market with a 26.35% share in 2025; exoskeleton and rehabilitative robots are projected to expand at a 18.48% CAGR through 2031.
- By component, instruments and accessories commanded a 50.35% share of the medical robotic systems market size in 2025, while the services segment is projected to post the fastest 18.3% CAGR through 2031.
- By application, general surgery accounted for a 29.15% share of the medical robotic systems market size in 2025; however, neurology applications are expected to advance at a 18.1% CAGR through 2031.
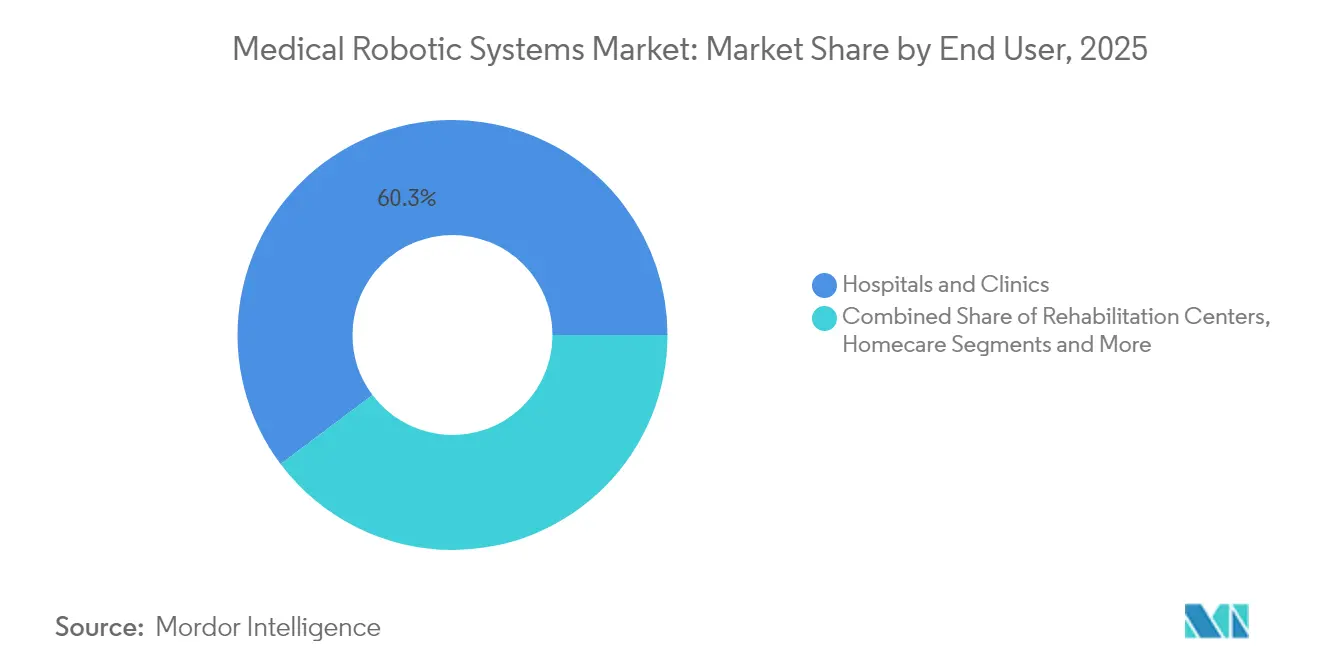
- By end user, hospitals and clinics held 60.25% of the medical robotic systems market share in 2025, whereas ambulatory surgery centers are expected to record the highest 18.05% CAGR through 2031.
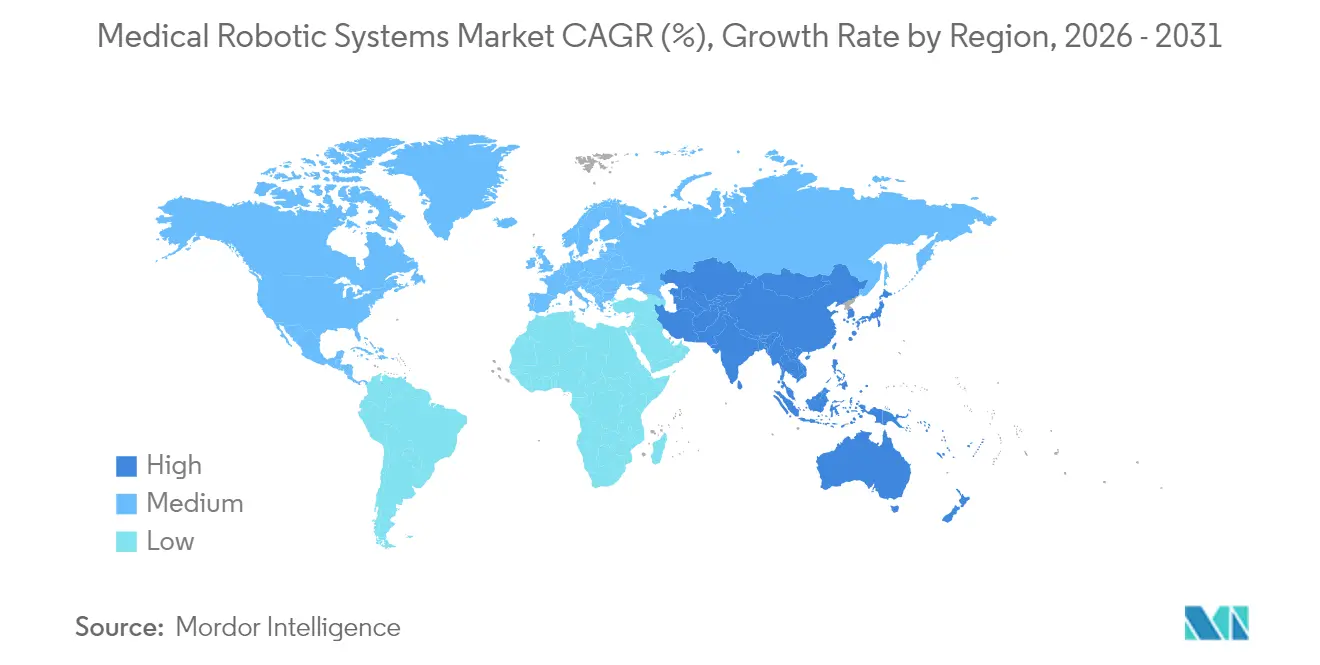
- By region, North America is expected to hold a 35.45% revenue share in 2025, while the Asia-Pacific region is forecast to grow at a 17.6% CAGR from 2025 to 2031.
Note: Market size and forecast figures in this report are generated using Mordor Intelligence’s proprietary estimation framework, updated with the latest available data and insights as of 2026.
Market Trends and Insights
Drivers Impact Analysis of Medical Robotic Systems Market*
| DRIVER | (~) % IMPACT ON CAGR FORECAST | GEOGRAPHIC RELEVANCE | IMPACT TIMELINE |
|---|---|---|---|
| Accelerating Adoption of Outpatient Robotic Surgery Centers in US and Europe | +2.8% | North America and Europe | Medium term (2-4 years) |
| Rapid Surge in Oncology-Focused Robotic Procedures in China's Tier-3 Hospitals | +2.1% | China, spill-over to Asia Pacific | Short term (≤ 2 years) |
| Mandatory Minimum-Volume Policies in Germany Pushing Hospitals toward Robotic Systems | +1.4% | Germany, expanding to European Union | Long term (≥ 4 years) |
| Emergence of Subscription and Leasing Business Models Reducing Up-front CAPEX | +3.2% | Global, early gains in emerging markets | Medium term (2-4 years) |
| Integration of AI-Powered Intra-operative Imaging Driving Precision Neurosurgery | +2.5% | Global, concentrated in developed markets | Long term (≥ 4 years) |
| Government-Sponsored Rehabilitation Robotics Programs Addressing Stroke Burden | +1.7% | Japan and South Korea, expanding to Asia Pacific | Long term (≥ 4 years) |
| Source: Mordor Intelligence | |||
Accelerating Adoption of Outpatient Robotic Surgery Centers in the United States & Europe
Ambulatory surgery facilities reduce procedure costs by 30-40% relative to inpatient settings while matching clinical outcomes, a differential that compels payers to steer appropriate cases into same-day pathways, supporting growth in the medical robotic systems market. Medicare’s payment updates for 2025 continue to expand the ASC-eligible list, and private insurers deploy bundled payments that reward high-throughput centers. European systems follow suit; Germany links hospital funding to procedure-volume thresholds, prompting regional networks to pool robotic assets to keep complex cases local.[1]
Rapid Surge in Oncology-Focused Robotic Procedures within China’s Tier-3 Hospitals
China’s National Health Commission increasingly references robot-assisted resection in its oncology protocols, spurring procurement among provincial referral centers that traditionally lacked capital budgets. Hospitals leverage robotics to recruit top surgeons from tier-1 cities and to standardize outcomes across sprawling networks. Domestic vendors enter with lower-priced systems, compressing acquisition costs and accelerating penetration beyond state targets.
Mandatory Minimum-Volume Policies in Germany Pushing Hospitals toward Robotic Systems for Complex Surgeries
In Germany, mandatory minimum-volume regulations are driving the surge in robotic systems for intricate surgeries. These regulations require hospitals to perform a specified number of specific surgeries, such as pancreatic and esophageal procedures, annually to maintain their accreditation. By enhancing surgical precision and reducing variability, robotic systems are enabling hospitals to meet these stringent requirements. As a result, hospitals are channeling investments into robotic platforms, not only to centralize specialized surgeries but also to attract and retain top-tier surgeons who favor advanced technology. Furthermore, these robotic systems are aiding multi-site hospital networks by standardising workflows and promoting collaborative surgical initiatives. In response, vendors are highlighting Germany as a pivotal market, introducing innovations such as multi-port, single-port, and imaging-integrated robotic systems. With an emphasis on meeting minimum procedural volumes, hospitals are ramping up robotic training, adopting AI-driven workflows, and enhancing documentation to ensure compliance. Moreover, Germany's regulatory stance is resonating with neighbouring EU nations, many of which are contemplating similar volume-based quality standards, solidifying Germany's role as a frontrunner in Europe's robotic surgery landscape.
Emergence of Subscription & Leasing Business Models Reducing Up-front CAPEX in Middle-Income Markets
Robotics-as-a-Service converts large capital purchases into predictable monthly fees that bundle hardware, instruments, maintenance, and training. Med One Group reports a 40% year-over-year increase in surgical-robot leases, a trend that is especially visible in Latin America and Southeast Asia, where hospital borrowing capacity is limited. Manufacturers gain steady annuity streams while hospitals align costs with utilization.[2]Subscription-based and leasing models are driving the surge in medical robot adoption, especially in middle-income markets. These models convert hefty capital expenditures (CAPEX) into manageable operational expenses (OPEX), making it easier for budget-conscious hospitals to embrace the technology. With options such as predictable monthly payments, pay-per-use, and bundled packages (covering services, consumables, and training), hospitals can expand their robotics programs without the delays associated with lengthy capital-approval processes. Leasing not only provides access to cutting-edge robotic innovations but also sidesteps concerns of depreciation and obsolescence.
Restraints Impact Analysis of Medical Robotic Systems Market*
| RESTRAINTS | (~) % IMPACT ON CAGR FORECAST | GEOGRAPHIC RELEVANCE | IMPACT TIMELINE |
|---|---|---|---|
| Rising Back-log of Post-Warranty Service Costs Deterring Smaller Hospitals | -1.8% | Global, concentrated in emerging markets | Medium term (2-4 years) |
| Data-Protection Regulations Limiting Cloud-Connected Robot Analytics | -1.2% | Europe & North America, expanding globally | Long term (≥ 4 years) |
| Shortage of Certified Robotic Surgeons in Latin America Slowing Utilization Rates | -0.9% | Latin America, spill-over to emerging markets | Long term (≥ 4 years) |
| Stringent FDA Cybersecurity Draft Guidance Elevating Compliance Costs for New Entrants | -1.1% | Global, concentrated in US market entry | Medium term (2-4 years) |
| Source: Mordor Intelligence | |||
Rising Back-log of Post-Warranty Service Costs Deterring Smaller Hospitals
As post-warranty service expenses surge, the medical robots market faces a significant challenge, particularly affecting smaller hospitals. Typically, annual service fees for robotic surgical systems range between 12% and 18% of the system's original cost. This recurring financial burden proves unsustainable for many mid- and low-volume facilities. Consequently, rural and Tier-2 hospitals are experiencing a growing backlog of deferred maintenance, resulting in increased downtime and diminished returns on their robotics investments. The situation is exacerbated by limited access to competitive third-party servicing, inflationary pressures on biomedical services, and sluggish response times from original equipment manufacturers (OEMs). These challenges have prompted some hospitals to adopt a reactive maintenance approach rather than a preventive one. Such a backlog can result in reliance on outdated software, compromised operational safety, and limited surgical options. Without in-house biomedical engineers, smaller hospitals often find themselves heavily reliant on costly OEM technicians, which intensifies their financial challenges. This mounting service backlog not only heightens medico-legal risks but also increases the likelihood of cancelled robotic procedures and hinders the adoption of emerging technologies, such as AI-guided navigation. The repercussions are most pronounced in regions such as Southeast Asia, Eastern Europe, and Latin America, where hospitals operate on thin margins and surgical volumes fall short of justifying the steep service costs.
Data-Protection Regulations (GDPR/HIPAA) Limiting Cloud-Connected Robot Analytics
In Europe, strict data-protection laws, such as GDPR, and HIPAA in the U.S., are increasingly stifling the growth of cloud-connected robotic analytics. Modern medical robots, which rely on cloud processing for tasks such as algorithm training, predictive maintenance, and intraoperative video insights, are facing challenges. The cross-border transfer of surgical data is mired in compliance hurdles. Even anonymised metadata is often classified as high-sensitivity health information. As a result, hospitals face regulatory risks, lengthy approval cycles, and administrative challenges related to BAAs, cybersecurity certifications, and data anonymization. These challenges have prompted many facilities to either turn off connected features or shift to on-premise analytics, thereby compromising the sophistication and accuracy of their predictive models. The restricted sharing of diverse datasets across institutions hampers AI development, slows algorithm refinement, and diminishes benchmarking quality across global installations. Additionally, cloud-edge fusion models encounter challenges due to dual-processing risks, and encrypted real-time streaming can hinder the effectiveness of surgical collaboration tools. Ultimately, these compliance-driven challenges inflate vendor costs, delay product deployment, and limit access to advanced cloud-based robotics, curbing the growth of AI-enhanced surgical robot ecosystems.
*Our forecasts treat driver/restraint impacts as directional, not additive. The impact forecasts reflect baseline growth, mix effects, and variable interactions.
Medical Robotic Systems Market Segment Analysis
By Product Type:
Surgical Dominance Amid Rehabilitation UpswingSurgical systems retained a 26.35% share of the medical robotic systems market in 2025, buoyed by mature reimbursement codes and extensive training pipelines among surgeons. Utilization spans urology, gynecology, general, and orthopedic procedures, with cumulative da Vinci case volumes surpassing 15 million globally. Oncology applications in radiosurgery, led by platforms such as CyberKnife, demonstrate a 89.3% local tumor control rate, reinforcing clinical acceptance.
Rehabilitative solutions trail in revenue but are scaling quickly on the back of publicly funded stroke programs. Exoskeleton sessions deliver higher therapy intensity, and early health-economic studies show 15% faster functional recovery versus conventional physiotherapy. Combined, these factors push rehabilitation robotics to an 18.48% CAGR, the fastest within the medical robotic systems market.

By Component:
Services Propel Recurring RevenueConsumable instruments and accessories accounted for 50.35% of the medical robotic systems market share in 2025, as every procedure requires single-use items such as staplers, trocars, and energy tips. High-throughput hospitals average seven robotic cases per console per day, a cadence that secures double-digit margins for vendors even after bulk-pricing concessions. To entrench loyalty, suppliers introduce smart inventory cabinets that automatically replenish disposables and book charges directly to patient dossiers, thereby trimming nursing time by 12 minutes per case.
Services, spanning lease, warranty, software, and training, scale even faster at an 18.3% CAGR, as providers favor operating-expense models over capital lock-in. Multi-year “system-as-a-service” packages now bundle unlimited instruments, predictive maintenance, and quarterly software updates that enhance AI guidance without requiring new hardware. Hospitals, such as the University of California health network, report a 2% higher uptime and 9% quicker credentialing of new surgeons after migrating to subscription portals that host virtual reality (VR) rehearsal modules. Vendors increasingly tie fee levels to case volumes, aligning economics with utilization and making renewals almost frictionless.
By Application:
Neurology Emerges as Growth EngineGeneral surgery retained a 29.15% share of the 2025 medical robotic systems market, leveraging high-frequency procedures such as cholecystectomy, bariatric revisions, and ventral hernia repair, which achieve post-complication reductions of up to 40% compared to laparoscopy. Reimbursement authorities in the United States and France approve bundled payments that reimburse robotics when they are cost-equivalent to laparoscopy at a 24-month follow-up, driving sustained demand. Surgeons credit motion scaling and 8K visualization for enabling fine dissection near critical vasculature, a capability that curbs conversion-to-open rates to below 2%.
Neurology, however, is the fastest riser, with a 18.1% CAGR, as stereotactic guidance systems merge with intraoperative MRI to localize deep brain targets with 0.5 mm accuracy. Hospitals performing robot-guided spine fusions report 30% less X-ray exposure and 20 minutes shorter OR time per level fused, savings that translate into an additional daily case on high-volume lists. AI-powered anomaly detection flags microhemorrhages in real-time, enhancing safety in tumor resections. These advantages underpin payer approvals in Germany and South Korea, widening addressable volumes.
By End User:
Ambulatory Centers Capture MomentumHospitals and integrated delivery networks still commanded a 60.25% market share of the medical robotic systems market in 2025, leveraging critical-care backup and 24/7 imaging to handle multi-quadrant oncology and cardiac cases. In the robotic medical imaging market, Broader access enables communities to manage cardiovascular and neurovascular cases locally rather than referring to urban tertiary centers. Teaching centers embed robotics into residency curricula; a single 1,000-bed academic hospital may operate six to eight consoles across disciplines, solidifying vendor lock-in through credentialing pipelines. Such institutions negotiate tiered-instrument pricing that falls once volume exceeds 1,500 cases annually, preserving margins while expanding the vendor footprint.
Ambulatory surgery centers (ASCs) are growing at a 18.05% CAGR, converting former orthopedic suites into multi-specialty robotic pods where same-day discharge hits 95% of caseload. U.S. Medicare’s 2025 outpatient rule adds colectomy and prostatectomy to the ASC-covered list, a catalyst that opens up seven-figure annual revenue opportunities for early adopters. To accommodate tighter footprints, vendors in the medical robotic systems industry are rolling out compact carts with boom-mounted arms and integrated smoke evacuation, which save 14 square feet compared to legacy rigs. Rehabilitation clinics, meanwhile, pilot subscription exoskeletons reimbursed under new CPT codes for gait training, signaling further end-user diversification.
By Automation Level:
Semi-Autonomous Platforms PrevailIn 2025, tele-operated medical robots commanded a dominant 54.65% share of the medical robotic systems market. This surge is attributed to the increasing adoption of surgical consoles in hospitals, driven by compelling evidence of enhanced precision, reduced complications, and expedited recovery times. The leadership of tele-operated systems is further solidified by rising procedure volumes in urology, gynecology, and general surgery. Major manufacturers are reaping benefits not only from upgrades to their installed base but also from a steady stream of revenue generated through instruments and services. Yet, challenges loom: high capital expenditures, stringent credentialing mandates, and extended training periods hinder wider adoption, particularly in mid-sized hospitals. Additionally, limited interoperability among systems and concerns over procedural costs further dampen penetration rates. Nonetheless, teleoperated platforms remain the cornerstone of surgical robotics on a global scale.
Healthcare systems are increasingly adopting robotic rehabilitation, mobility support, bedside assistance, and logistics automation, resulting in a 18.48% growth rate for assistive and collaborative medical robots during the forecast period. The demand for robotic exoskeletons, therapy robots, and mobile collaborative assistants is being driven by an aging population, a rising burden of chronic diseases, and staffing shortages in hospitals, supporting growth in the medical robotics market. These robotic systems not only provide operational relief but also standardize therapy sessions and enhance patient engagement. The growth of this sector is bolstered by advancements in AI-driven sensing technologies and safer interactions between humans and robots. Yet, challenges such as reimbursement gaps, a lack of extensive long-term clinical evidence, and difficulties in integrating these technologies into existing hospital workflows pose significant hurdles. Despite these challenges, the versatility of these robots and their comparatively lower entry costs, especially when juxtaposed with surgical robots, position them as the fastest-growing segment in the market.
Geography Analysis
North America Medical Robotic Systems Market
North America captured 35.45% revenue in 2025, supported by clear FDA pathways, strong venture funding, and payer acceptance of robotic codes. U.S. ambulatory centers increasingly integrate multi-specialty robotic suites, and Canada’s provincial tenders shift toward leasing to manage upfront budgets. Mexico’s private hospitals embrace robotics to service inbound medical tourists seeking cost-effective bariatric and orthopedic procedures.
APAC Medical Robotic Systems Market
The Asia-Pacific region is the fastest-growing geography, with a 17.6% CAGR to 2031, driven by public funding, demographic pressure, and rising insured populations. China’s tier-3 hospital procurements accelerate oncology robot volumes, while Japan subsidizes exoskeletons for post-stroke therapy under its national insurance scheme. India’s corporate hospital chains adopt robots to differentiate care and draw diaspora patients, with procedural pricing 40-60% lower than Western counterparts.
Europe Medical Robotic Systems Market
Europe shows moderate but steady adoption shaped by heterogeneous payer systems. Germany’s volume-based quality rules force robotic investment, especially in visceral and cardiac surgery. The United Kingdom’s NICE incorporates cost-effectiveness thresholds, stretching adoption timelines yet ensuring sustainable utilization. France, Italy, and Spain pool robotic assets across regional clusters, while the Nordics integrate robotic data feeds into national registries for outcome benchmarking.
Regulatory Landscape
Medical robotic systems operate under medical-device rules that increasingly combine quality systems, software lifecycle controls, and cybersecurity requirements for connected platforms. In the United States, the FDA Quality Management System Regulation (QMSR) took effect on February 2, 2026, incorporating ISO 13485:2016 by reference and tightening expectations for supplier controls and design-change documentation for OEMs and key subsystem vendors.
In Europe, compliance continues to be governed primarily by the EU Medical Device Regulation (MDR 2017/745), with adjacent updates shaping how evidence and standards are interpreted. Commission Delegated Regulation (EU) 2026/1451 (published March 20, 2026) amended MDR provisions related to exempted implantable and Class III devices from mandatory clinical investigations, while June 2026 Official Journal updates (Implementing Decisions (EU) 2026/1231 and (EU) 2026/1313) refreshed harmonized standards for MDR and IVDR. For AI-enabled features, the EU AI Act (Regulation 2024/1689) classifies many AI-enabled medical devices in Class IIa or higher as high-risk AI systems, with compliance timing for Annex I high-risk systems embedded in regulated products extended to August 2, 2028, reinforcing the need for parallel MDR and AI governance programs.
Value Chain Analysis
The value chain spans precision mechatronics and medical-grade manufacturing through software and AI development, clinical validation, regulatory clearance, commercialization, and lifecycle services. Upstream inputs include actuators, sensors, optics and imaging interfaces, semiconductors, sterilizable materials, and safety-critical embedded control. Robot-specific standards (including IEC 80601-2-78 for rehabilitation robots and IEC 80601-2-77 for surgical robots) and ISO quality requirements shape supplier qualification.
Midstream activities focus on system integration (arms, carts, consoles), instrument and accessory manufacturing (single-use and reusables), software and connectivity layers, and validation for specialty workflows. OEMs are increasingly designing for upgradeability as services and software updates take on a larger share of delivered value. Downstream, distribution models mix direct sales, regional distributors, and, in some cases, OEM-owned commercial channels to tighten control over training, uptime, and consumables pull-through. Intuitive Surgical’s March 2026 expansion of direct operations across parts of Southern Europe (via acquisition of distribution businesses from ab medica, Abex, and Excelencia Robotica) illustrates the push to internalize go-to-market and service execution. Contract manufacturing is also gaining strategic importance as volumes expand beyond flagship systems; Microbot Medical’s July 2026 manufacturing agreement with Sanmina for the LIBERTY Endovascular Robotic System shows how specialized contract manufacturers can help scale production while maintaining regulated-process discipline. Across the chain, recurring revenue depends on instruments and accessories plus post-install services, which makes training, predictive maintenance, cybersecurity patching, and parts logistics key differentiators.
Competitive Landscape
The medical robotic systems market remains moderately fragmented. Intuitive Surgical leverages its 7,500-plus installed da Vinci systems and extensive surgeon-training curricula to safeguard share, but newer entrants erode price points. CMR Surgical’s modular Versius robot, cleared in more than 80 countries, offers a smaller footprint and flexible financing, appealing to budget-constrained facilities.
Johnson & Johnson’s Ottava prototype performed its first human surgeries in February 2025, marking the company’s bid to integrate AI vision through its Polyphonic digital ecosystem. Siemens Healthineers expands its robotics scope by integrating imaging, navigation, and automated C-arm positioning to create tightly coupled intraoperative workflows. Stryker maintains leadership in ortho robotics, and Smith+Nephew’s CORI knee platform secures new insert clearances, sustaining application depth.
Strategically, vendors tend to focus on recurring revenue. Hardware innovation alone no longer guarantees differentiation; AI analytics for predictive maintenance, integrated training modules, and cloud-delivered upgrades are key to anchoring customer loyalty. Partnerships with semiconductor and cloud providers accelerate algorithm development, while acquisitions in imaging and navigation fill capability gaps.
Medical Robotic Systems Industry Leaders
-
Intuitive Surgical Inc.
-
Stryker Corporation
-
Medtronic plc
-
Johnson & Johnson Services, Inc.
-
Siemens Healthineers AG
- *Disclaimer: Major Players sorted in no particular order
Medical Robotic Systems Market Companies Covered in this Report
- Intuitive Surgical Inc.
- Stryker Corporation
- Medtronic plc
- Johnson and Johnson (Ethicon/Auris)
- Siemens Healthineers AG (incl. Corindus)
- CMR Surgical Ltd
- Smith and Nephew plc
- Zimmer Biomet Holdings Inc.
- Globus Medical Inc.
- Asensus Surgical Inc.
- Brainlab AG
- Think Surgical Inc.
- PROCEPT BioRobotics Corp.
- Vicarious Surgical Inc.
- Titan Medical Inc.
- Renishaw plc
- MicroPort MedBot
- Accuray Incorporated
- Omnicell Technologies Inc.
- Aethon Inc.
Market Opportunities and Future Outlook
Opportunity is concentrating around regulatory-enabled geographic expansion and broader procedure coverage across multi-specialty platforms. Medicaroid’s Hinotori securing a CE mark in July 2026 (covering urology, general surgery, gynecology, and thoracic surgery) is a concrete example of new systems entering Europe under MDR frameworks, adding competitive options for hospitals balancing capital constraints with minimum-volume and quality requirements. In parallel, specialized robots that target narrow but high-impact workflow problems are moving through U.S. pathways, including Spiro Robotics receiving FDA 510(k) clearance in July 2026 for a handheld robotic system for tracheal intubation, which expands the addressable automation footprint beyond traditional console-based surgery.
A second white-space area is lifecycle-managed AI and data services that turn the installed base into recurring revenue while navigating privacy, cybersecurity, and cross-border data constraints. The EU AI Act timeline, including high-risk AI obligations for embedded regulated products extended to August 2, 2028, sets a window for vendors to harden governance, documentation, and post-market change processes, and to productize on-premise or hybrid analytics where GDPR/HIPAA constraints limit cloud features. Consolidation is also creating portfolio and channel opportunities in adjacent interventional robotics, including Stereotaxis completing its acquisition of Robocath for up to USD 45 million in July 2026, which can accelerate capability aggregation and installed-base cross-selling across catheter-based and procedural robotics ecosystems.
Recent Industry Developments in Medical Robotic Systems Market
- July 2026: Stereotaxis completed its acquisition of French surgical robot maker Robocath for up to USD 45 million. The deal expands Stereotaxis footprint in interventional robotics and strengthens its ability to bundle platforms, service, and consumables across hospital accounts.
- May 2026: Johnson & Johnson released results from the FORTE clinical study for its investigational OTTAVA robotic surgical system, assessing safety and performance in Roux-en-Y gastric bypass across six U.S. sites. The data package supports platform maturation and reinforces competitive pressure in soft-tissue robotics as clinical evidence becomes a purchase gate for hospitals and ambulatory programs.
- February 2026: Stryker initiated a limited market release of Mako RPS (Robotic Power System) for total knee procedures as an expansion of its Mako SmartRobotics ecosystem. The handheld approach targets workflow and adoption friction for orthopedic teams by extending robotic enablement into familiar power-instrument steps.
Medical Robotic Systems Market Report Scope and Research Methodology
Market Definition and Coverage
For this study, the medical robotic systems market is defined as the global revenue generated from robotic platforms used in healthcare settings, along with their related instruments, accessories, software, and service support that enable clinical procedures and care workflows.
Scope exclusions: We exclude general-purpose industrial robots and non-medical automation that is not designed, regulated, or sold for healthcare use.
Segments Covered in This Report
- By Product Type
- Surgical Robotic Systems
- Rehabilitative Robotic Systems
- Non-invasive Radiosurgery Robots
- Hospital and Pharmacy Automation Robots
- Other Product Types
- By Component
- Robotic Systems
- Instruments and Accessories
- Services (Maintenance, Training, Subscription)
- Software and AI Platforms
- By Application
- General Surgery
- Orthopedic Surgery
- Neurosurgery
- Cardiovascular
- Gynecology
- Urology
- Oncology
- Laparoscopy and Thoracoscopy
- Other Applications
- By End User
- Hospitals and Clinics
- Ambulatory Surgery Centers
- Rehabilitation Centers
- Homecare Settings
- By Automation Level
- Tele-operated
- Semi-autonomous
- Autonomous
- Assistive and Collaborative
- By Geography
- North America
- United States
- Canada
- Mexico
- Europe
- United Kingdom
- Germany
- France
- Italy
- Rest of Europe
- Asia-Pacific
- China
- Japan
- India
- South Korea
- Rest of Asia
- Middle East
- Israel
- Saudi Arabia
- United Arab Emirates
- Turkey
- Rest of Middle East
- Africa
- South Africa
- Egypt
- Rest of Africa
- South America
- Brazil
- Argentina
- Rest of South America
- North America
Data Sources, Market Sizing, and Validation
Desk Research
We started by building a clean fact base using procedure volumes, device regulation milestones, and healthcare spending inputs, so the market model is anchored to demand signals rather than product announcements. Public sources such as the US FDA databases, OECD health statistics, the World Bank, the WHO, and peer reviewed clinical journals were used to understand adoption conditions, safety milestones, and utilization patterns that can move robotic demand up or down.
To translate those signals into revenues, we also reviewed company annual reports, investor presentations, earnings call commentary, and reputable press coverage that references hospital capital budgets and installed base updates. In parallel, we used paid subscriptions for company financials and intelligence and for patent databases, so platform refresh timing and pipeline cadence could be reflected in assumptions. These desk sources are illustrative and not exhaustive, and we also relied on other public references for data collection, cross-checking, and clarification.
Primary Interviews and Surveys
Inputs from interviews and surveys were used to test what we saw in public data, especially around system mix, service attach rates, and buying cycles in hospitals and ambulatory surgical centers. We spoke with a mix of manufacturers, distributors, clinical users, and procurement or biomedical engineering teams across major regions, and then we revisited outlier assumptions when responses did not align with observed procedure and installation patterns.
Distribution of primary research fieldwork respondents
| Company type | Respondent position | Region |
|---|---|---|
| Top tier: 26% | CXOs: 16% | APAC: 38% |
| Mid tier: 55% | Functional/Unit leaders: 37% | EMEA: 36% |
| Smaller Players: 19% | Managers: 47% | Americas: 26% |
Market-Sizing & Forecasting
Sizing was built using a top-down and bottom-up blend. On the top-down side, procedure volumes and site level adoption rates were used to reconstruct the addressable demand pool, which was then converted to revenues through average selling price bands, accessory pull-through, and annual service contract behavior. To keep totals realistic, we ran selective bottom-up checks using supplier revenue disclosures, installed base signals, and channel checks, and then adjusted the model when the two views did not reconcile.
A few inputs drove most of the outcome: the split between capital systems and recurring spend, utilization per installed system, replacement and upgrade timing, service attach rates, and regional hospital capacity expansion. For forecasting, we leaned on scenario analysis because adoption depends on capital budget cycles and regulatory or reimbursement momentum, and we tuned scenarios using directional consensus from primary inputs. When bottom-up details were missing for smaller geographies or niche applications, we filled gaps using proxy adoption rates from similar healthcare markets and then normalized results back to macro demand indicators.
Data Validation & Update Cycle
We validated results through multiple checks so the market total remains consistent with external signals such as procedure growth, installed base commentary, and reported revenue mix trends. Any major variance is reviewed by another analyst, and assumptions are re-tested through follow-up outreach when the gap cannot be explained by scope or timing.
The report is refreshed annually, and we also update sooner when there is a material event such as a large regulatory approval, a major platform launch, or a sudden demand shock. Before delivery, a final sweep is completed so the published numbers reflect the latest available public information and the most recent primary feedback.
Mordor Intelligence's Global Medical Robotic Systems Market Size Measured Against Other Published Estimates
Published market values for medical robotic systems can look far apart because each publisher sets its own boundaries for what counts as a system, what recurring revenues are included, and what year is treated as the starting point. Differences in currency timing and the way average selling price changes are handled can also shift the headline number, even when the growth story being described is similar.
Installed base signals, procedure growth checks, and the split between capital equipment and recurring accessories and services are the evidence used to keep Mordor Intelligence's estimate tied to what hospitals and care sites can realistically absorb in 2026. Gaps often come from bundling a wider set of hospital automation robots into the same total, counting distributor markups differently, or relying on a near-term penetration curve that is not re-checked against capital budget cycles.
Benchmark comparison
| Source | Market Size | Gaps in Research Methodology |
|---|---|---|
| Mordor Intelligence | USD 17.92 B (2026) | |
| Global Consultancy A | USD 30.50 B (2024) | Uses an earlier base year and appears to apply a broader revenue basket, which can lift totals when more robotics categories and related revenues are grouped together. |
| Regional Consultancy B | USD 29.84 B (2024) | Starts from 2024 and seems to include a wider definition of medical robotics and service lines, which can inflate the market compared with a tighter clinical robotic systems boundary. |
Overall, the spread is mainly explained by year alignment and what gets counted beyond core clinical robotic platforms, especially recurring services and adjacent hospital automation. By keeping inputs traceable to procedure and site adoption signals and then reconciling the math with supplier and channel checks, the estimate remains easier to reproduce and update when the market shifts.
Key Questions Answered in the Report
What is the current value of the medical robotic systems market?
The medical robotic systems market is valued at USD 17.92 billion in 2026 and is projected to reach USD 37.44 billion by 2031, reflecting a 15.88% CAGR.
Which product category dominates medical robotics installations?
Surgical robotic systems hold leadership with 26.35% of 2025 revenue, anchored by broad specialty coverage and established reimbursement frameworks.
Why are ambulatory surgery centers important for future growth?
ASCs deliver 30–40% cost savings over inpatient settings and post a 18.05% CAGR through 2031, making them pivotal in expanding robotic procedure volumes.
What regions present the highest growth potential?
Asia-Pacific records the fastest 17.6% CAGR, driven by public funding in China, Japan, and South Korea as well as rising insurance penetration across emerging economies.
How are vendors addressing high capital costs for hospitals?
Manufacturers and finance companies are rolling out subscription and leasing models that convert upfront CAPEX into predictable operating expenses, accelerating adoption in middle-income markets.
What role does artificial intelligence play in medical robotics?
AI enhances intra-operative imaging, guides instrument trajectories, and supports predictive maintenance, collectively improving surgical precision and system uptime while forming a new layer of differentiation for vendors.