
Maritime Freight Transport Market Size and Share
Market Overview
| Study Period | 2020 - 2031 |
|---|---|
| Market Size (2026) | USD 632.36 Billion |
| Market Size (2031) | USD 823.57 Billion |
| Growth Rate (2026 - 2031) | 5.43 % |
| Fastest Growing Market | Asia Pacific |
| Largest Market | Asia Pacific |
| Market Concentration | Medium |
Major Players *Disclaimer: Major Players sorted in no particular order Image © Mordor Intelligence. Reuse requires attribution under CC BY 4.0. | |
Maritime Freight Transport Market Analysis by Mordor Intelligence
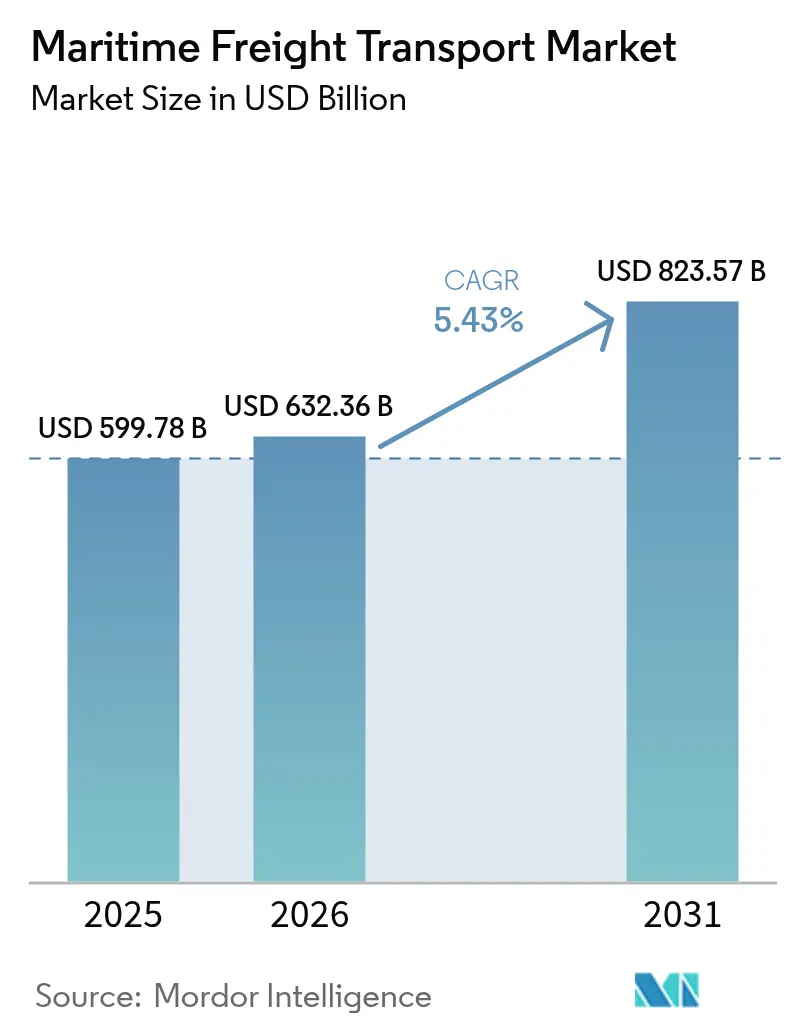
The Maritime Freight Transport Market size was valued at USD 599.78 billion in 2025 and estimated to grow from USD 632.36 billion in 2026 to reach USD 823.57 billion by 2031, at a CAGR of 5.43% during the forecast period (2026-2031).
Sustained expansion springs from resilient global trade volumes, the rerouting of vessels around congestion and conflict zones that inflates ton-mile demand, and the accelerating shift of cargo toward South-South corridors that intensify intra-Asian flows[1]“China’s Pinglu Canal Investment,” Carnegie Endowment, carnegieendowment.org. Compliance with the EU Emissions Trading System (EU ETS) adds USD 206 per metric ton to operating costs in 2025 but simultaneously accelerates fleet renewal toward low-carbon tonnage, supporting long-run competitiveness[2]“Compliance Costs of Alternative Fuels,” Sustainable Ships, sustainable-ships.org. Alliance realignments such as the Gemini Cooperation between Maersk and Hapag-Lloyd recalibrate slot allocation across East-West lanes, raising schedule reliability targets to 90% and sharpening service differentiation. Digital freight platforms that now govern more than 80% of container transactions provide real-time capacity balancing, cut average dwell time by 12%, and help carriers monetize empty repositioning legs.
Key Report Takeaways
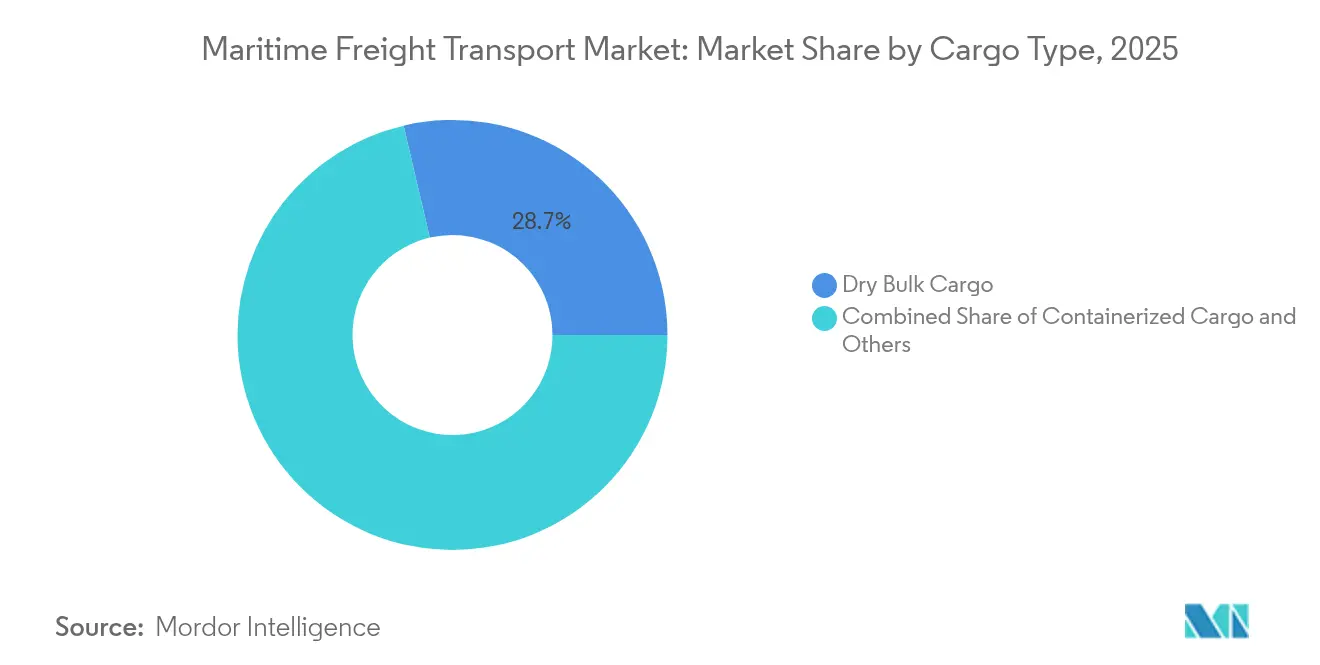
- By cargo type, dry bulk captured 28.65% of the Maritime freight transport market share in 2025, while liquid bulk is advancing at a 4.02% CAGR through 2031.
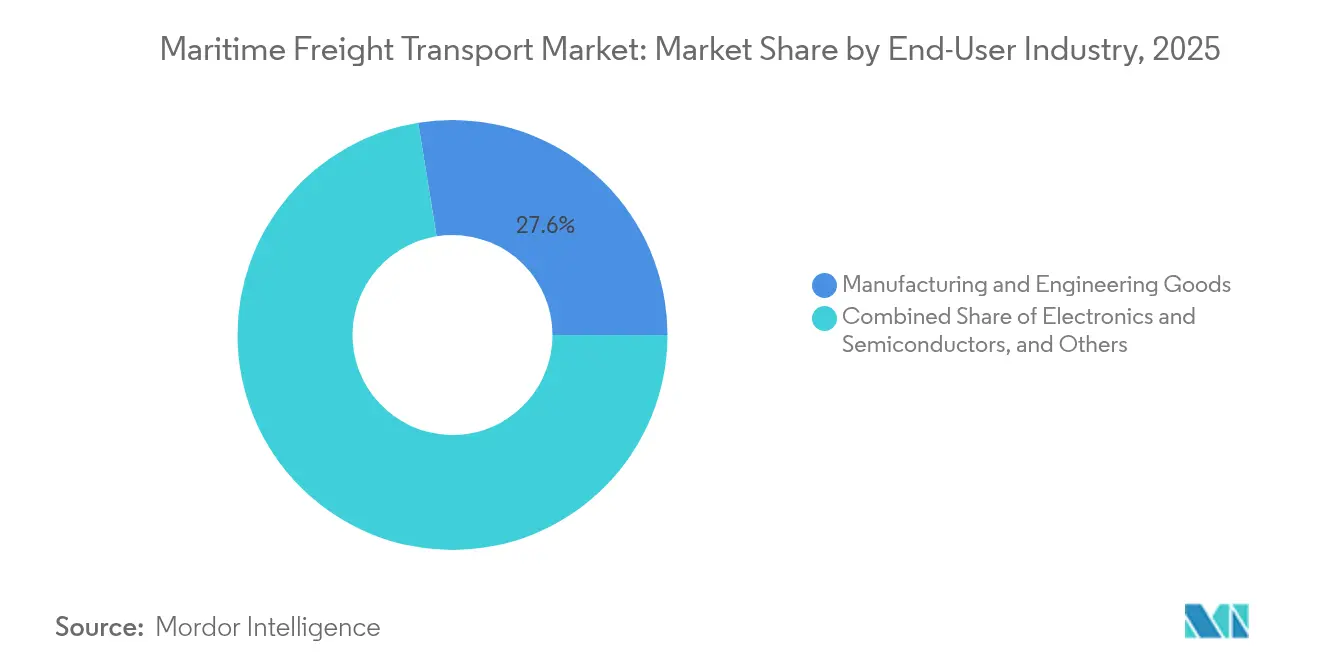
- By end-user industry, manufacturing & consumer goods held 27.55% of the Maritime freight transport market size in 2025, whereas pharmaceuticals & healthcare are expanding at a 5.49% CAGR to 2031.
- By geography, Asia-Pacific commanded a 37.65% revenue share of the Maritime freight transport market in 2025 and is forecast to post a 5.02% CAGR to 2031.
Note: Market size and forecast figures in this report are generated using Mordor Intelligence’s proprietary estimation framework, updated with the latest available data and insights as of 2026.
Market Trends and Insights
Drivers Impact Analysis of Maritime Freight Transport Market*
| Driver | % Impact on CAGR Forecast | Geographic Relevance | Impact Timeline |
|---|---|---|---|
| Surge in South-South intra-Asian trade corridors | +1.2% | Asia-Pacific core, spill-over to Middle East | Medium term (2-4 years) |
| Near-shoring drives short-sea feeder demand | +0.8% | North America & EU, regional corridors | Short term (≤ 2 years) |
| EU-ETS on maritime emissions reshapes fleet economics | +0.6% | Europe & EU waters, global fleet impact | Long term (≥ 4 years) |
| Digital freight platforms enable real-time capacity matching | +0.4% | Global, concentrated in major trade lanes | Medium term (2-4 years) |
| Alternative fuels adoption lowers long-term OPEX | +0.3% | Global, early adoption in Europe & Japan | Long term (≥ 4 years) |
| Suez diversions & Panama expansion boost ton-miles | +0.9% | Global, particularly Asia-Europe routes | Short term (≤ 2 years) |
| Source: Mordor Intelligence | |||
Surge in South-South Intra-Asian Trade Corridors
ASEAN surpassed the European Union as China’s top trading partner in 2023 at USD 468.8 billion, a 10.5% jump that cements intra-Asian cargo loops as the new growth engine. Progressive tariff eliminations under ACFTA streamline flows that bypass Western transshipment hubs, while China’s 84-mile Pinglu Canal slated for 2026 will move 89 million tons annually and slice USD 725 million from supply-chain costs[3]“Maritime Cybersecurity Review,” ArXiv, arxiv.org. Manufacturing migration toward Southeast Asia reinforces near-port industrial clusters, amplifying feeder demand to secondary gateways. The resulting cargo density underpins scale investments in 15,000 TEU workhorses optimized for shorter hauls yet higher turn-round frequencies. Collectively, these dynamics contribute an estimated 1.2 percentage-points to the Maritime freight transport market CAGR forecast period.
Near-shoring Drives Short-Sea Feeder Demand
U.S.-Mexico truck crossings hit record levels in 2024, validating near-shoring’s spillover into Gulf and Caribbean feeder loops. Mainline carriers now skip smaller Gulf ports, contracting regional specialists for hub-and-spoke shuttles that compress door-to-door cycles by two to four days. X-Press Feeders’ pact with six European ports to create green corridors exemplifies operators capturing rising short-sea volumes while satisfying Scope 3 emission objectives. Executives cite logistics cost reduction as the single largest incentive, with 41% prioritizing proximity over global scale. Elevated demand lifts vessel utilization and daily charter rates for 1,500-2,000 TEU ships, translating into a 0.8 percentage-point uptick in the Maritime freight transport market growth trajectory.
EU-ETS on Maritime Emissions Reshapes Fleet Economics
The maritime extension of the EU ETS could saddle ship-owners with EUR 10 billion in annual compliance costs, fundamentally redefining route economics for intra-European services. CMA CGM, Hapag-Lloyd, and COSCO collectively face USD 34.4 billion in liabilities through 2050, accelerating the payback of dual-fuel retrofits. Bio-methanol attains cost parity at EUR 90-100 per tCO₂, making methanol-ready newbuilds a strategic hedge against future allowance spikes. Carbon-optimized network design triggers port-pair substitutions favoring longer yet ETS-exempt legs, modestly widening ton-mile demand. Such shifts inject 0.6 percentage-points into the Maritime freight transport market CAGR by 2030.
Digital Freight Platforms Enable Real-Time Capacity Matching
E-booking platforms now orchestrate over 80% of container bookings, giving shippers spot-rate transparency and carriers algorithmic allocation of empty repositioning. Predictive analytics trims fuel burn by optimizing speed curves, while IoT-driven asset telemetry curbs average container dwell time by 12%. CMA CGM’s AI-enriched platform elevates quote-to-book cycle speed, translating into higher load factors and revenue quality. Digital twins replicate terminal operations, allowing operators to pre-empt congestion and redeploy yard assets. The technology stack adds 0.4 percentage-points to the Maritime freight transport market growth rate through operational efficiency gains.
Restraints Impact Analysis of Maritime Freight Transport Market*
| Restraint | % Impact on CAGR Forecast | Geographic Relevance | Impact Timeline |
|---|---|---|---|
| Chronic port-side infrastructure bottlenecks | -1.1% | Global, concentrated in Asia-Pacific hubs | Medium term (2-4 years) |
| Oversupply risk from record container-ship orderbook 2023-26 | -0.9% | Global container shipping capacity | Short term (≤ 2 years) |
| Escalating maritime cyber-security threats | -0.4% | Global, critical in digitalized operations | Long term (≥ 4 years) |
| Inflation-driven bunker price volatility | -0.6% | Global, acute in fuel-intensive routes | Short term (≤ 2 years) |
| Source: Mordor Intelligence | |||
Chronic Port-Side Infrastructure Bottlenecks
Congestion peaked in 2025 as Singapore and Colombo absorbed Cape-routed vessels, causing yard utilization to exceed 90% and average berth wait times to triple. Shanghai processed a record 5 million TEU in January 2025 ahead of U.S. tariff enactments, stressing yard equipment even after adding 18 fully automated terminals. Los Angeles and Long Beach struggle with chassis shortages, while the Malacca Strait faces geopolitical disruptions and climate-driven draft limitations. Investment lags in gate automation and hinterland rail links hamper cargo velocity, subtracting 1.1 percentage-points from the Maritime freight transport market’s long-run CAGR.
Oversupply Risk from Record Container-Ship Orderbook 2023-26
Delivery of 3.1 million TEU across 478 ships in 2024 pushes total fleet capacity beyond 30 million TEU, dwarfing projected demand gains of 3-4%. MSC’s orderbook alone exceeds 2 million TEU, intensifying competitive pressure even after widespread slow-steaming cut average speeds to 13.9 knots. A flood of large vessels forces cascading of older Panamax units into secondary trades, suppressing rate benchmarks and eroding operator margins. Carriers counteract by scrapping younger tonnage and blank-sailing deployments, yet the imbalance still trims 0.9 percentage-points from the Maritime freight transport market CAGR outlook.
*Our forecasts treat driver/restraint impacts as directional, not additive. The impact forecasts reflect baseline growth, mix effects, and variable interactions.
Maritime Freight Transport Market Segment Analysis
By Cargo Type:
Bulk Leadership Sustains While Liquid AcceleratesDry bulk holds the lion’s share, accounting for 28.65% of Maritime freight transport market size in 2025 on the back of China’s 165 million-ton iron-ore and coal restocking drive. However, a 36 million dwt delivery slate scheduled for 2025 risks dampening TCE rates despite robust tonnage demand growth. Operators therefore pivot to index-linked charters to mitigate downside exposure. Overcapacity fears spur early scrapping of Handysize vessels, constraining supply in niche routes and moderating rate compression.
Liquid bulk is the standout growth engine, posting a 4.02% CAGR through 2031 as LNG liquefaction volumes scale and chemicals trades diversify. Spot VLCC earnings are forecast at USD 51,600 per day for 2025, stimulating time-charter interest among energy majors. Tanker owners install dual-fuel capability to capture green-premium cargoes, while port operators invest in cryogenic export arms to service ammonia-ready tonnage. The strengthening liquid bulk trajectory adds needed diversity to the Maritime freight transport market, cushioning volatility in other cargo streams.


By End-User Industry:
Manufacturing Dominance with Healthcare MomentumManufacturing & consumer goods contributed 27.55% of the Maritime freight transport market size in 2025, reinforcing maritime’s role in global production networks. Electronics & semiconductors remain exposed to supply-chain fragility, prompting the United States to allocate USD 52.7 billion for reshoring, which may shift cargo patterns toward U.S. West Coast ports. Chemical & petrochemical cargoes exploit tight tanker capacity, with fleet growth surpassing 5% to 5,838 ships.
Pharmaceuticals & healthcare clock the fastest 5.49% CAGR through 2031 as shippers shift high-value biologics to ocean modes, leveraging superior temperature stability that now covers 35% of global drug logistics. Reefer container retrofits featuring controlled-atmosphere technology extend shelf life, making ocean a viable substitute for airfreight. Carriers capitalize by launching direct West Europe-U.S. Gulf pharma corridors with strict lane-integrity protocols, reinforcing the Maritime freight transport market as a critical facilitator of healthcare supply chains.
Geography Analysis
APAC Maritime Freight Transport Market
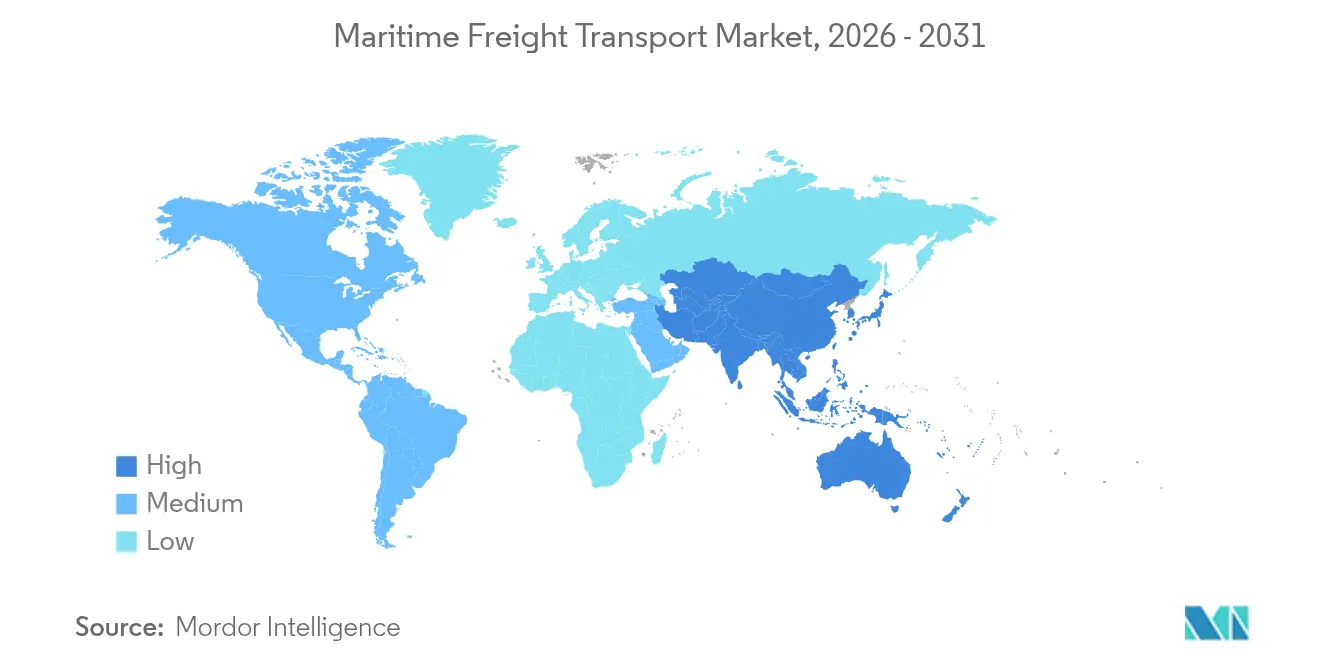
Asia-Pacific commands 37.65% of Maritime freight transport market share in 2025 and is set to expand at a 5.02% CAGR to 2031, buoyed by 57% intra-regional trade dependence that diversifies growth away from Western demand cycles. Shanghai’s automation blueprint-18 fully unmanned terminals—cuts crane moves per hour variance and sets new benchmarks for berth productivity. China’s Pinglu Canal, capable of handling 89 million tons a year by 2026, will reduce inland transit bottlenecks and save USD 725 million annually.
North America and Europe Maritime Freight Transport Market
North America confronts a rare 1% contraction in container throughput as tariff realignments and Section 301 levies raise costs on Chinese-built vessels beginning October 2025. Yet Mexico’s trade renaissance offers partial offset, with near-shoring catalyzing Gulf feeder services and inland rail upgrades. Europe faces EUR 10 billion (USD 11.03 billion) annual ETS compliance costs that reprioritize corridor routing and bunker strategies. Simultaneously, green-corridor pilots position European ports as early-adoption nodes for alternative-fuel bunkering.
MEA and South America Maritime Freight Transport Market
The Middle East leverages USD 4.5 billion in Saudi port investments to lift regional logistics revenue to USD 38.8 billion by 2026. IMEC promises to shorten Asia-Europe transit times by 40% via integrated rail-port linkages, underscoring the region’s role in multipolar trade flows. South America capitalizes on its neutral stance; Brazilian soybean exports to China expand under disrupted supply chains. Africa’s share gradually rises as Russia-Nigeria services unlock agricultural corridors for BRICS members.

Regulatory Landscape
Global maritime freight transport is shaped by safety and environmental rules developed through the International Maritime Organization (IMO) and implemented through flag states and port state control regimes, alongside regional measures across major trading blocs. A key 2026 compliance inflection comes from multiple IMO instruments entering into force on 1 January 2026, including amendments to SOLAS and the IGC/IGF Codes that affect flashpoint-related requirements and associated verification at the first survey date on or after entry into force.
Environmental compliance is tightening across both global and regional regimes. From 1 March 2026, MARPOL Annex VI amendments designate the Norwegian Sea and the Canadian Arctic as Emission Control Areas (ECAs) for SOx, NOx, and particulate matter, which adds route-specific fuel and engine compliance obligations. In Europe, EU ETS obligations step up in 2026, requiring surrender of allowances for 70% of reported emissions from the 2025 reporting period. On 23 February 2026, the European Commission adopted Implementing Regulation (EU) 2026/394 to set technical specifications and access rights for the FuelEU database, reinforcing monitoring, reporting, and verification workflows for ships calling at EU ports.
Value Chain Analysis
The maritime freight transport value chain extends from cargo owners and freight forwarders to digital booking and documentation, ocean carriers and vessel operators, and then to port and terminal operations, hinterland connections (rail, road, inland depots), and customs and compliance services. In container shipping, carrier networks and alliance or slot arrangements influence capacity deployment and schedule design, while e-booking and documentation increasingly affect quote-to-book speed, container release, and dwell times. Operational disruptions in 2024-2025, including reroutings around the Cape of Good Hope and canal constraints, also showed how fast upstream voyage decisions can translate into downstream port congestion and equipment imbalances.
Ports and terminals drive value creation through berth productivity, yard operations, and intermodal throughput, supported by marine services (pilots, towage, bunkering) and shipmanagement and maintenance providers. Investment across the chain is shifting toward low-carbon operations and resilience, including LNG bunkering readiness and fleet upgrades such as CMA CGM placing the CMA CGM Notre Dame into service on Asia-Europe in July 2026 as the first of a new series of ultra-large LNG-powered container ships. Consolidation among logistics integrators and forwarding networks also affects bargaining power and service bundling, tightening carrier-forwarder-shipper interoperability needs for data exchange and exception management.
Competitive Landscape
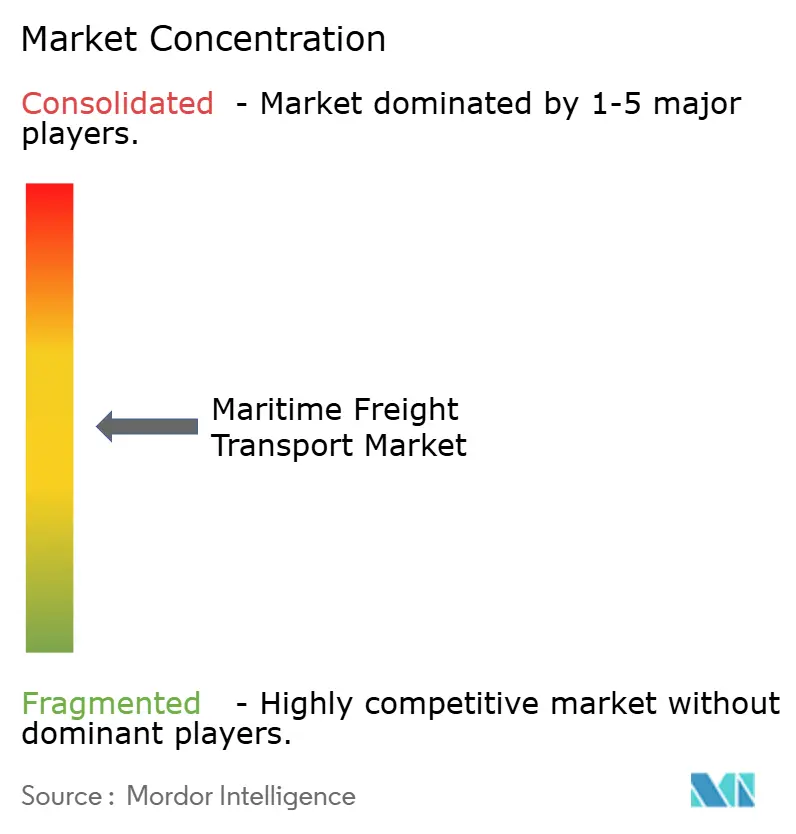
The Maritime freight transport market is moderately fragmented. MSC leads with 6.3 million TEU, growing 67% since 2020. The termination of the 2M Alliance frees MSC to deploy megamax vessels unilaterally, while the Gemini Cooperation between Maersk and Hapag-Lloyd pools 340 ships with a 90% on-time reliability target. ONE, HMM, and Yang Ming form the Premier Alliance, challenging established slot-sharing norms and injecting fresh competition.
Strategic differentiation gravitates toward sustainability. Hapag-Lloyd’s USD 4 billion order for 24 methanol-ready ships capable of 95% CO₂e cuts underpins its “Strategy 2030” goal. Maersk pursues net-zero by 2040 through 800,000 TEU of methanol dual-fuel newbuilds, supported by green-methanol procurement partnerships. Mitsui O.S.K. Lines’ USD 1.715 billion buyout of LBC Tank Terminals diversifies revenue into chemical storage, insulating against pure freight-rate cyclicality.
Digital and cyber capabilities become decisive. CMA CGM invests USD 20 billion in U.S. logistics, rolling out AI-driven platforms that compress booking lead times. Hapag-Lloyd pilots blockchain to guarantee document integrity, reinforcing customer trust. Heightened cyber-risk pushes carriers to adopt ISO 27001 frameworks, adding compliance costs yet also raising competitive barriers. Regional specialists exploit white-space in high-growth niches; X-Press Feeders scales LNG-powered, 1,700 TEU tonnage for Baltic short-sea lanes, underscoring the agility advantages of smaller operators.
Maritime Freight Transport Industry Leaders
Mediterranean Shipping Company (MSC)
A.P. Moller-Maersk
COSCO Shipping Lines
Hapag-Lloyd
Ocean Network Express (ONE)
- *Disclaimer: Major Players sorted in no particular order
Maritime Freight Transport Market Companies Covered in this Report
- Mediterranean Shipping Company (MSC)
- A.P. Moller-Maersk
- COSCO Shipping Lines
- Hapag-Lloyd
- Ocean Network Express (ONE)
- Evergreen Marine Corp.
- HMM Co., Ltd.
- Yang Ming Marine Transport
- ZIM Integrated Shipping
- Pacific International Lines (PIL)
- SITC International
- X-Press Feeders
- Matson Inc.
- Swire Shipping
- NYK Line
- K Line
- MOL Logistics
- CMA CGM
- Wan Hai Lines
- Emirates Shipping Line

Market Opportunities and Future Outlook
Decarbonization-driven compliance creates an implementation runway for alternative-fuel readiness, emissions measurement, and fuel-management integration across fleets and port calls. By 2026, this includes the expansion of ECAs under MARPOL Annex VI (Norwegian Sea and Canadian Arctic, effective 1 March 2026) and the EU’s higher ETS surrender requirement in 2026, which increases the value of route optimization, bunker strategy, and retrofit planning. The IMO Net-Zero Framework workstream, with measures scheduled for entry into force in 2027, further supports demand for scalable solutions across onboard energy management, fuel supply contracting, and verifiable well-to-wake reporting that aligns with port-state requirements.
Port and corridor capacity expansions, along with digital standardization, are creating whitespace for carriers, terminals, and intermediaries that can bundle dependable capacity with interoperable documentation. Investment-led opportunity is visible in MARAD’s nearly USD 488.6 million in Port Infrastructure Development Program grants announced in March 2026, the Port of Vancouver selecting the TerraMarine consortium in July 2026 for the Roberts Bank Terminal 2 project (adding 2.4 million TEUs of capacity), and Poland starting construction in 2026 on the EUR 2.3 billion Baltic container hub at Swinoujscie (2 million TEU capacity with shore power and zero-emission handling). On the process side, industry bodies are moving from standards definition toward deployment: DCSA’s 2026 standards roadmap and the June 2026 adoption of the DCSA Platform Interoperability (PINT) standard by five eBL platforms support cross-platform document exchange, which can shorten release cycles and reduce manual handoffs across the container journey.
Recent Industry Developments in Maritime Freight Transport Market
- July 2026: The Vancouver Fraser Port Authority selected the TerraMarine consortium as the preferred proponent for the Roberts Bank Terminal 2 project. The expansion targets an additional 2.4 million TEUs of container capacity, strengthening gateway throughput and raising the bar for integrated terminal, rail, and environmental execution.
- October 2025: A strategic memorandum of understanding between Maersk and CATL focuses on supply chain electrification and logistics collaboration. The partnership connects maritime logistics with battery and electrification capabilities, supporting decarbonization programs that increasingly influence shipper procurement and network design.
- July 2024: MSC, via MEDLOG, broke ground on the Inland Terminal Paris-Bruyeres multimodal platform near Paris. The inland terminal investment extends MSC’s control over hinterland capacity and intermodal connectivity, improving end-to-end service reliability beyond the seaport interface.


Maritime Freight Transport Market Report Scope and Research Methodology
Market Definition and Coverage
In this report, the maritime freight transport market is counted as revenue earned from moving cargo by sea across domestic and international routes, covering the main shipping service types used to carry bulk and unitized freight.
Scope exclusions: inland waterway and river barge freight is excluded from this market sizing unless it is clearly contracted as an ocean-leg shipment.
Segments Covered in This Report
- By Cargo Type
- Containerized Cargo
- Dry
- Reefer
- Dry Bulk Cargo
- Liquid Bulk Cargo
- General Cargo
- Roll-On/Roll-Off Cargo
- Containerized Cargo
- By End-User Industry
- Electronics & Semiconductors
- Chemicals & Petrochemicals
- Food & Beverage
- Pharmaceuticals & Healthcare
- Retail & E-commerce
- Others
- By Geography
- North America
- United States
- Canada
- Mexico
- South America
- Brazil
- Peru
- Chile
- Argentina
- Rest of South America
- Asia-Pacific
- India
- China
- Japan
- Australia
- South Korea
- South East Asia (Singapore, Malaysia, Thailand, Indonesia, Vietnam, and Philippines)
- Rest of Asia-Pacific
- Europe
- United Kingdom
- Germany
- France
- Spain
- Italy
- BENELUX (Belgium, Netherlands, and Luxembourg)
- NORDICS (Denmark, Finland, Iceland, Norway, and Sweden)
- Rest of Europe
- Middle East and Africa
- United Arab of Emirates
- Saudi Arabia
- South Africa
- Nigeria
- Rest of Middle East And Africa
- North America
Data Sources, Market Sizing, and Validation
Desk Research
Desk work starts by mapping the real demand pool for sea cargo movement, and then anchoring it to public trade, fleet, and port indicators. We refer to sources such as UNCTAD (Review of Maritime Transport), International Maritime Organization publications on shipping and emissions, World Bank logistics and trade datasets, OECD trade and transport indicators, and port authority annual statistics where those are publicly shared.
To turn these signals into a usable model, we also review carrier and logistics company filings and investor presentations, along with association websites and reputable shipping press to understand rate-cycle context. In parallel, we use paid subscriptions for company financials and news, and for import and export shipment-level checks where trade-lane visibility helps validate assumptions. The sources listed here are illustrative only, and many other public references were used to collect data, confirm ranges, and resolve definition questions.
Primary Interviews and Surveys
Primary work is used to test what desk indicators cannot fully explain, especially the mix between containerized and non-containerized revenue and how pricing is being realized by route and cargo type. We speak with shipping service providers, freight buyers, and port and terminal stakeholders, plus industry experts across the main trade corridors, so assumptions on utilization, rate pass-through, and contract coverage can be adjusted to what is actually happening.
children is left empty in the payload as the respondent mix is captured in the table below.
Distribution of primary research fieldwork respondents
| Company type | Respondent position | Region |
|---|---|---|
| Top tier: 38% | CXOs: 17% | APAC: 46% |
| Mid tier: 42% | Functional/Unit leaders: 35% | EMEA: 34% |
| Smaller Players: 20% | Managers: 48% | Americas: 20% |
Market-Sizing & Forecasting
Sizing is built by first reconstructing the demand pool from seaborne trade activity and shipping supply, and then translating that into revenue using observed pricing behavior for key cargo groups. We state the top-down view using trade flows, port throughput, and fleet capacity signals, which are then stress-checked with selective bottom-up approximations like sampled carrier revenue roll-ups, route-level channel checks, and a volume multiplied by average rate build for a limited set of trade lanes.
A few inputs that matter a lot in this market are container throughput (TEU trends), dry bulk and liquid bulk volumes, fleet capacity and utilization patterns, spot versus contract rate direction, and port congestion or rerouting effects that change sailing distance and time. For forecasting, we typically rely on scenario analysis, because macro trade growth and freight rates do not move in a straight line, and expert feedback helps set realistic paths for normalization after disruption years. Where bottom-up checks have gaps, the missing pieces are filled using ratio-based extrapolations from similar lanes or cargo groups, and then normalized so the final totals remain consistent with observed trade and capacity constraints.
Data Validation & Update Cycle
Outputs are validated through cross-checks against independent signals, such as seaborne trade growth, capacity additions, and port throughput direction, before the final numbers are signed off. We review outliers by segment and region, and if variances look large, assumptions are revisited and experts are re-contacted so the model does not drift from real market behavior.
The report is refreshed annually, and interim updates are made when material events shift rates or volumes in a meaningful way. Before delivery, we run a fresh final pass on key inputs like currency conversion timing, rate trend direction, and major trade-lane disruptions, so readers receive the most current view available at that time.
Mordor Intelligence's Global Maritime Freight Transport Market Sizing Compared With Other Published Estimates
Published market sizes for maritime freight transport can look far apart because the market can be defined in more than one practical way, and because rate cycles make the same volume base translate into very different revenues. We keep the discussion simple by checking what is being counted as freight revenue, which year is being used, and whether the estimate is built on trade and capacity signals or on a broad logistics spend pool.
In particular, terminal handling and port service charges can be included by some sources, and that alone can inflate a value-based market number even when seaborne volumes are steady. Another common driver is how average freight rates are treated, since some models blend peak-year rates into later years and then apply one blended ASP across cargo types that do not behave the same way.
Benchmark comparison
| Source | Market Size | Gaps in Research Methodology |
|---|---|---|
| Mordor Intelligence | USD 632.36 B (2026) | |
| Trade Journal A | USD 632.40 B (2025) | Uses a broader ocean freight shipping pool and anchors the year to 2025, which can shift value when freight rates are changing quickly, and it does not clearly separate cargo group pricing. |
| Industry Report B | USD 392.06 B (2025) | Focuses on a narrower revenue capture that appears closer to carrier freight charges only, which can exclude parts of the commercial shipping service stack and understate total market value versus a full transport view. |
Terminal handling and related port service revenue sits outside Mordor Intelligence's scope, which keeps the value tied to sea transport service earnings rather than a wider port and documentation bill. When readers align the year, the pricing base, and which fees are included, the spread in published figures becomes easier to reconcile and the estimate can be repeated with the same demand signals.


Key Questions Answered in the Report
How big is the maritime freight transport market in 2026?
It is valued at USD 632.36 billion and is forecast to grow to USD 823.57 billion by 2031.
What is the projected CAGR for maritime freight transport through 2031?
The compound annual growth rate is 5.43%.
Which cargo type leads seaborne volumes?
Dry bulk holds 28.65% share, led by iron ore and coal flows into China.
Which region contributes the largest share of maritime trade?
Asia-Pacific accounts for 37.65% of 2025 revenue and remains the fastest-growing region.
What is driving growth in pharmaceuticals shipping by sea?
Temperature-controlled reefer technology makes ocean transport cost-effective for sensitive biologics, lifting the segment at a 5.49% CAGR.
How is regulation affecting fleet investment?
EU ETS compliance pushes owners toward dual-fuel newbuilds, accelerating green fleet renewal across major trades.
Page last updated on:


 Your data is secure and never sold or shared.


