
Market Overview
| Study Period | 2020 - 2031 |
|---|---|
| Market Size (2026) | USD 430.56 Billion |
| Market Size (2031) | USD 704.20 Billion |
| Growth Rate (2026 - 2031) | 10.34 % |
| Fastest Growing Market | Asia-Pacific |
| Largest Market | North America |
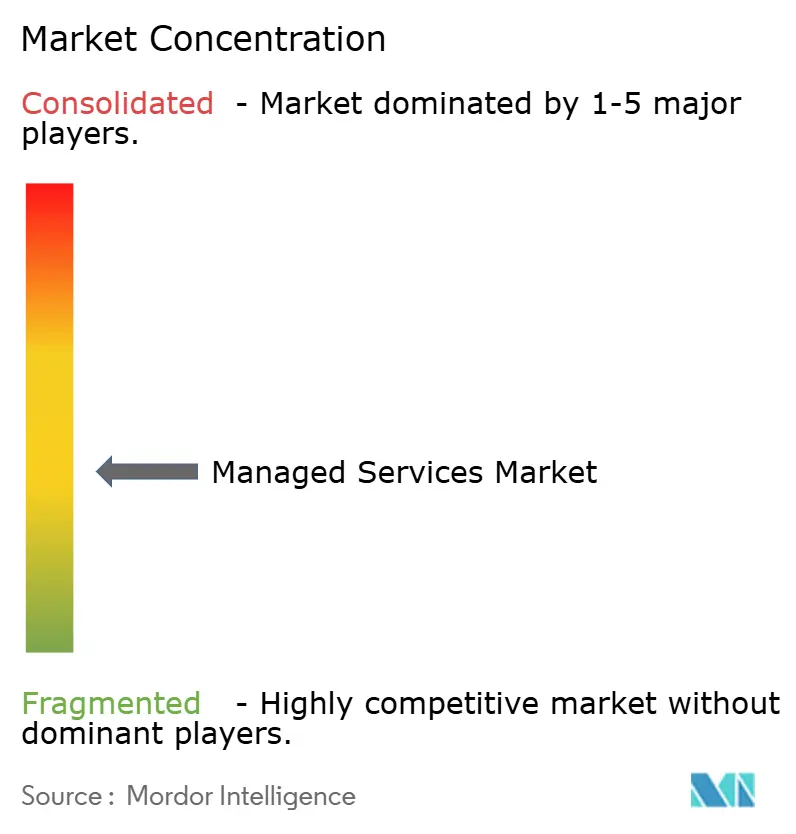
| Market Concentration | Medium |
Major Players *Disclaimer: Major Players sorted in no particular order Image © Mordor Intelligence. Reuse requires attribution under CC BY 4.0. | |
Managed Services Market Analysis by Mordor Intelligence
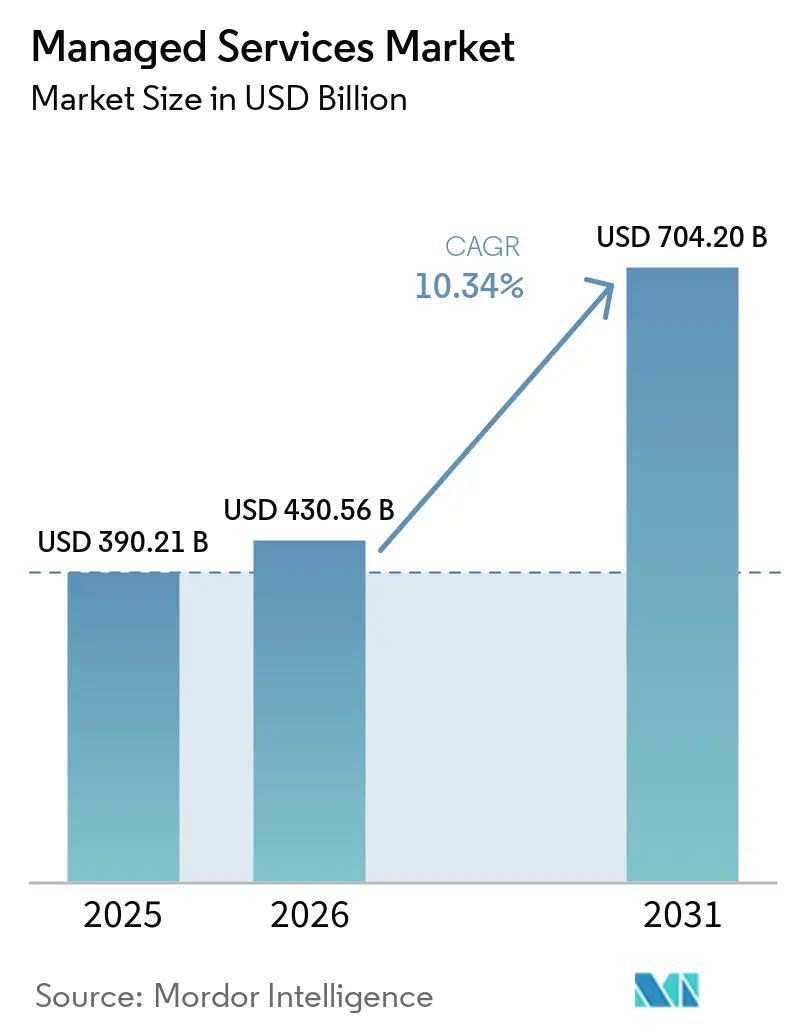
Managed services market size in 2026 is estimated at USD 430.56 billion, growing from 2025 value of USD 390.21 billion with 2031 projections showing USD 704.2 billion, growing at 10.34% CAGR over 2026-2031. The strong growth reflects enterprises’ pivot toward outsourced IT operations as they juggle hybrid-cloud complexity, rising cyber threats, and ongoing budget scrutiny. Cloud-centric delivery models, wider AI adoption, and regulatory pressures are reshaping provider offerings, while competitive differentiation now hinges on intelligent automation and vertical expertise. Strategic outsourcing has shifted from pure cost reduction to a core pillar of digital transformation, accelerating provider investments in security operations centers, multi-cloud orchestration tools, and edge management platforms. M&A activity underscores the appeal of scale, with providers pursuing inorganic growth to fill technology gaps and expand geographic reach.
Key Report Takeaways
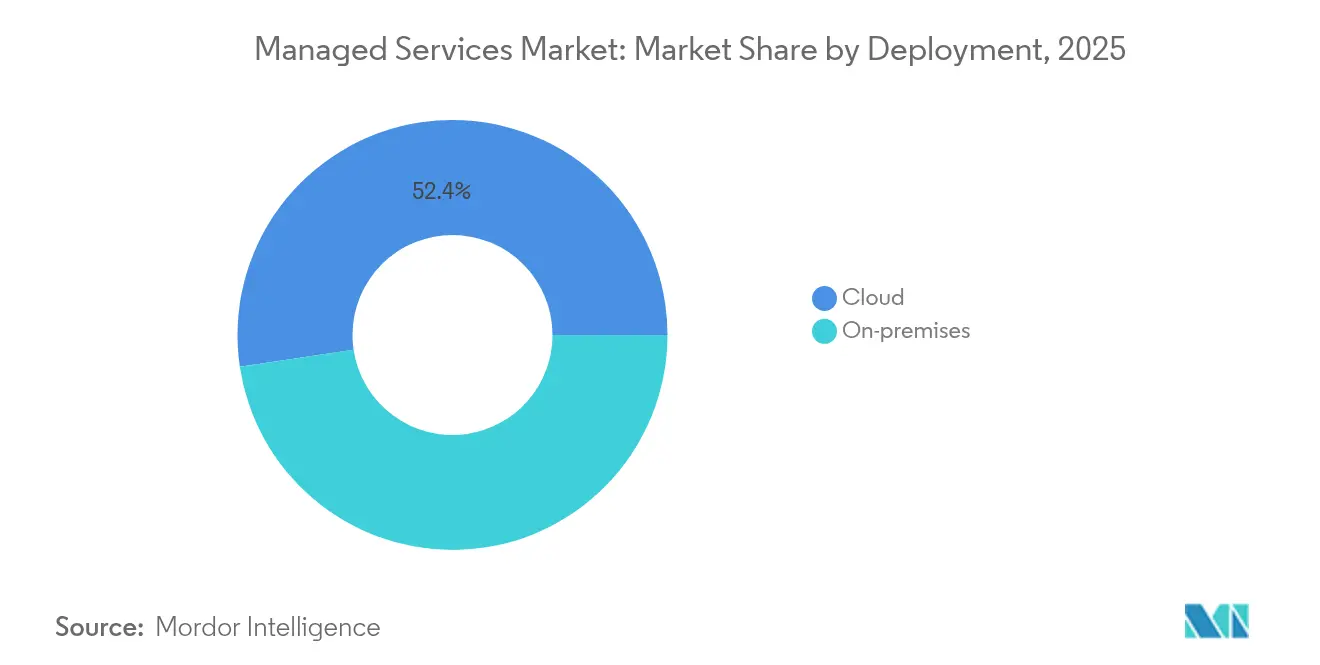
- By deployment, cloud models led with 52.35% revenue share in 2025, while hybrid cloud is projected to log a 11.92% CAGR through 2031.
- By service type, managed infrastructure services accounted for 38.40% of the managed services market share in 2025, whereas managed security services are advancing at an 12.33% CAGR to 2031.
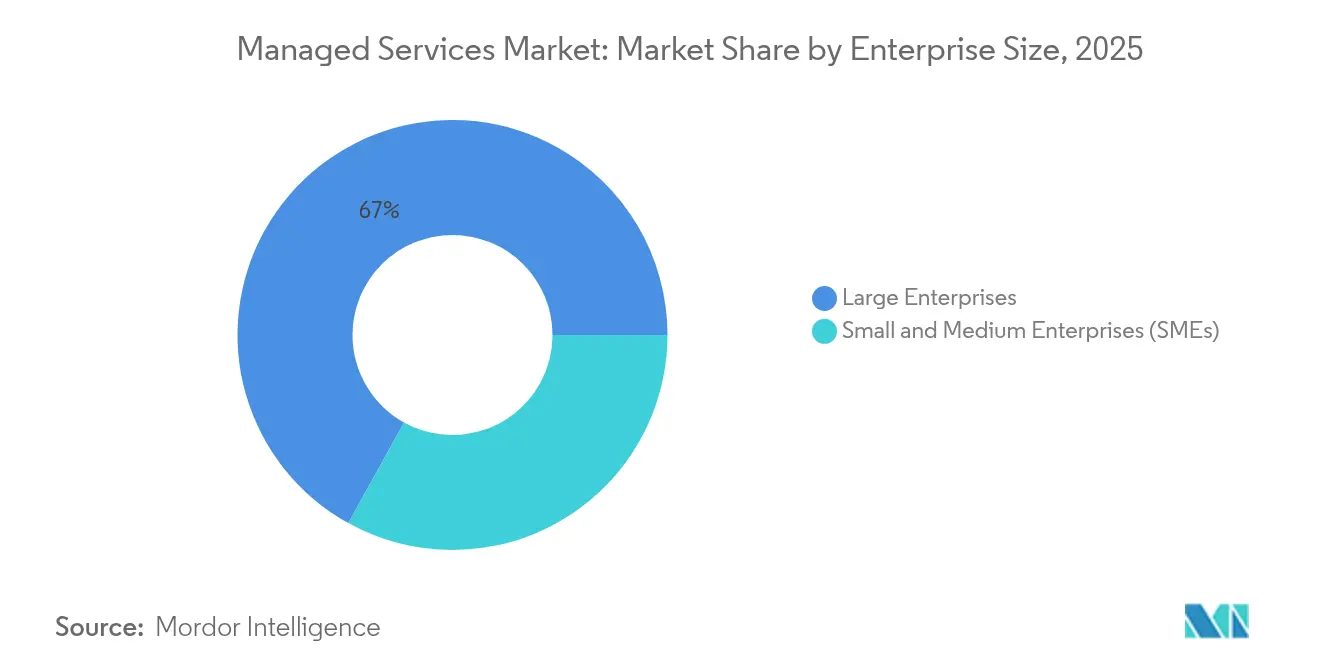
- By enterprise size, large enterprises held 66.95% share of the managed services market size in 2025, but small and medium enterprises are expected to grow at a 10.41% CAGR between 2026-2031.
- By end-user vertical, BFSI captured 34.10% revenue share in 2025; healthcare is forecast to expand at an 11.03% CAGR through 2031.
- By geography, North America led with 32.40% revenue share in 2025, while Asia-Pacific is set to post an 11.28% CAGR during the forecast period.
Note: Market size and forecast figures in this report are generated using Mordor Intelligence’s proprietary estimation framework, updated with the latest available data and insights as of 2026.
Global Managed Services Market Trends and Insights
Drivers Impact Analysis*
| Driver | (~) % Impact on CAGR Forecast | Geographic Relevance | Impact Timeline |
|---|---|---|---|
| Shift to hybrid-cloud operating models | +2.8% | Global, with concentration in North America and Europe | Medium term (2-4 years) |
| Cost-optimization pressure on enterprise IT budgets | +2.1% | Global, particularly acute in Asia-Pacific and emerging markets | Short term (≤ 2 years) |
| Rising cyber-threat volume and compliance mandates | +1.9% | Global, with heightened impact in BFSI and healthcare | Long term (≥ 4 years) |
| Edge-computing roll-outs demanding remote managed services | +1.4% | Asia-Pacific core, spill-over to MEA and Latin America | Medium term (2-4 years) |
| Cyber-insurance prerequisites for 24/7 managed detection and response | +1.2% | North America and EU, expanding to Asia-Pacific | Short term (≤ 2 years) |
| Sustainability and green-IT regulations driving managed power/cooling | +0.8% | EU leading, with adoption in North America and Asia-Pacific | Long term (≥ 4 years) |
| Source: Mordor Intelligence | |||


Hybrid-cloud complexity drives managed services adoption
Hybrid-cloud architectures combine on-premises, private, and multiple public clouds, elevating operational complexity that internal teams struggle to master. Regulatory initiatives such as the Microsoft EU Data Boundary require localized data handling, pushing enterprises toward providers that can guarantee compliance, portability, and unified security policies.[1]Microsoft, “EU Data Boundary Now Available,” microsoft.comSeamless workload portability and real-time policy enforcement across distributed environments cement long-term demand for managed infrastructure and security offerings.
Cost optimization pressures accelerate outsourcing decisions
Persistent margin pressure turns fixed IT overhead into a variable line item through managed services. Large transformation deals such as Accenture’s USD 1.6 billion Cloud One contract with the U.S. Air Force illustrate how enterprises view outsourcing as strategic, not merely tactical.[2]Accenture, “Accenture Federal Services Wins USD 1.6 Billion Cloud One Task Order,” accenture.com Providers bundle automation, AI tooling, and certified talent pools, allowing buyers to avoid up-front capital outlays while still accessing emerging capabilities.
Cybersecurity threat evolution demands specialized response capabilities
Advanced persistent threats, ransomware variants, and strict disclosure mandates require 24/7 monitoring, threat intelligence, and rapid containment actions. Providers with dedicated security operations centers and AI-driven analytics attract enterprises that now face cyber-insurance clauses mandating managed detection and response. The shift underscores why managed security services are the fastest-growing segment of the managed services market.
Edge computing expansion creates remote management requirements
Manufacturing, retail, and telecom firms deploy edge nodes far from data-center hubs. Dell’s alliances with Ericsson and Nokia illustrate how providers package remote monitoring, over-the-air updates, and predictive maintenance to keep dispersed assets online.[3]Dell Technologies, “Dell, Ericsson, Nokia Partner on Edge Innovation,” delltechnologies.com The trend increases demand for managed services that can monitor thousands of micro-sites without local staff.
Restraints Impact Analysis*
| Restraint | (~) % Impact on CAGR Forecast | Geographic Relevance | Impact Timeline |
|---|---|---|---|
| Persistent data-sovereignty and privacy regulations | -1.8% | EU leading, expanding globally | Long term (≥ 4 years) |
| Multi-vendor integration and legacy interoperability challenges | -1.4% | Global, particularly acute in large enterprises | Medium term (2-4 years) |
| Vendor lock-in risk and high exit costs of long-term MSP contracts | -1.1% | Global, with heightened concern in North America | Short term (≤ 2 years) |
| Talent shortages within MSPs limiting service-quality scalability | -0.9% | Global, most severe in Asia-Pacific and emerging markets | Long term (≥ 4 years) |
| Source: Mordor Intelligence | |||
Data-sovereignty regulations constrain service delivery models
Mandates requiring localized processing force providers to duplicate infrastructure in each jurisdiction, reducing economies of scale and complicating global delivery. Microsoft’s EU Data Boundary illustrates the additional capital and operational overhead that providers must absorb to serve multi-region clients.
Vendor lock-in concerns limit long-term commitments
Enterprises fear switching costs tied to proprietary tooling and custom workflows housed within long contracts. Buyers increasingly demand modular service catalogs, open APIs, and termination flexibility, pressuring providers to rethink pricing and contract terms.
*Our forecasts treat driver/restraint impacts as directional, not additive. The impact forecasts reflect baseline growth, mix effects, and variable interactions.
Segment Analysis
By Deployment: Cloud Models Drive Market Evolution
Cloud deployment held 52.35% share of the managed services market in 2025 and is widening its lead as hybrid cloud posts a 11.92% CAGR through 2031. The ability to spin up resources on demand, comply with data regulations, and integrate edge workloads explains why enterprises migrate from on-premises models. Hyperscaler alliances, like Accenture’s engagement on Cloud One, show how co-innovation can unlock large multiyear deals.
The managed services market benefits as cloud deployment allows providers to pool infrastructure, automate patches, and roll out AI-driven cost-optimization at scale. Private cloud remains relevant for data-sensitive sectors, while on-premises services persist for legacy workloads that cannot be refactored easily. Providers that master multi-cloud orchestration and FinOps reporting are best positioned to capture new spend.


By Service Type: Infrastructure and Security Lead Growth
Managed infrastructure services owned 38.40% revenue in 2025, reflecting the baseline need to keep heterogeneous estates running. Yet managed security services lead growth with an 12.33% CAGR, mirroring board-level concern over ransomware and compliance fines. AI-enabled threat hunting, zero-trust rollouts, and automated incident containment set market winners apart.
The managed services market size for security offerings is expected to accelerate as cyber-insurance carriers tighten underwriting criteria. Providers are bundling SOC-as-a-service with compliance reporting and tabletop exercises, creating high-margin recurring revenue. Network and communication services gain from 5G roll-outs, while data-center energy management products ride sustainability mandates.
By Enterprise Size: SME Adoption Accelerates
Large enterprises accounted for 66.95% of 2025 revenue, but SME uptake is growing faster at 10.41% CAGR as packaged offerings hit price points from USD 99 to USD 250 per user per month. Standardized bundles covering endpoint management, backup, and SOC access remove entry barriers.
The managed services market is turning into a volume play, with providers investing in self-service portals and AI chatbots to support thousands of smaller customers efficiently. SME buyers value predictable monthly costs and turnkey compliance over bespoke customization, rewarding providers that can deliver scale without sacrificing service quality.
By End-user Vertical: BFSI Leadership with Healthcare Acceleration
BFSI held 34.10% of revenue in 2025, underpinned by stringent data protection laws and real-time payment platforms. The sector’s focus on zero-downtime operations drives demand for advanced resiliency and risk reporting. Healthcare, however, shows an 11.03% CAGR as telehealth, electronic health records, and device security create acute expertise gaps.
The managed services market share in healthcare is poised to rise as governments fund digital hospital programs and mandate strict breach disclosures. Providers offering HIPAA-aligned architectures, clinical IoT monitoring, managed information services, and patient-data analytics gain a competitive edge. Manufacturing and retail also accelerate adoption to support Industry 4.0 and unified commerce initiatives, increasing the IoT managed services market share as connected devices and edge infrastructure become more widespread.
Geography Analysis
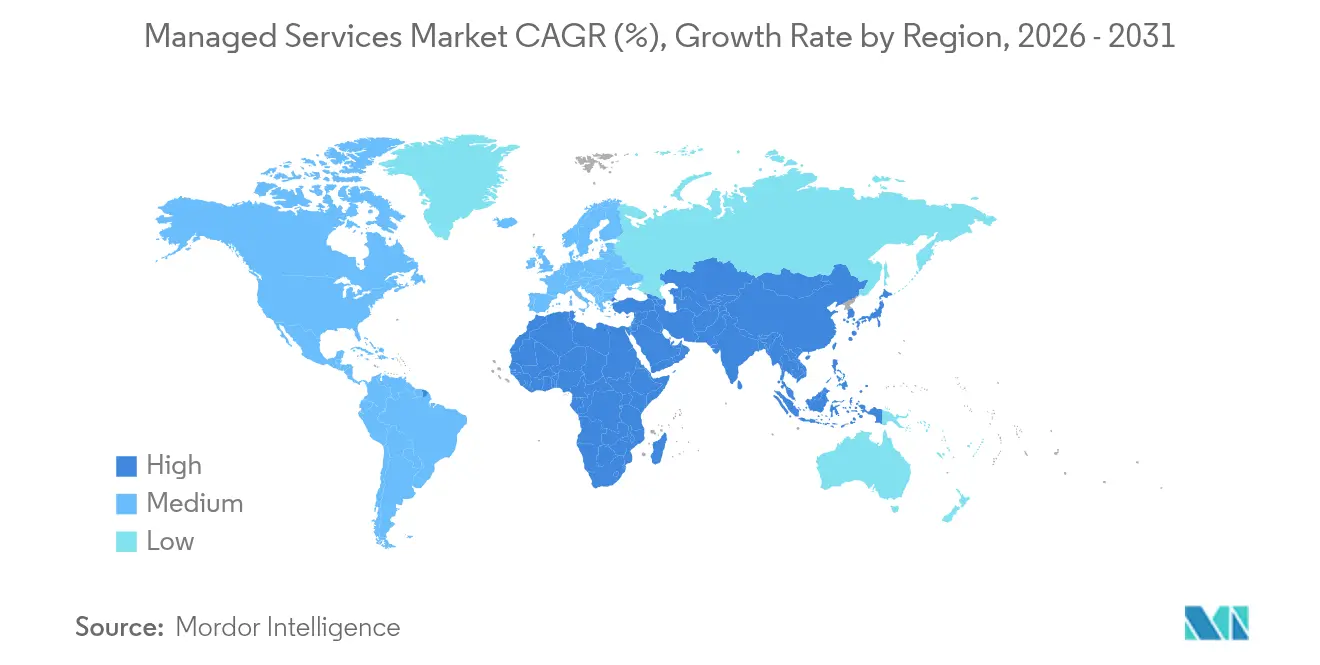
North America retained 32.40% revenue share in 2025, buoyed by early cloud migration, cyber regulations, and high IT spend. Federal programs such as the U.S. Air Force Cloud One create visibility for large managed services contracts. BFSI and healthcare customers continue to anchor demand, and providers use the region as a launchpad for AI and edge pilots.
Asia-Pacific is the fastest-growing region at 11.28% CAGR to 2031. China’s manufacturing upgrades, India’s digital-public-infrastructure push, and Japan’s aging plant modernization funnel spend toward providers capable of bridging legacy and cloud workloads. Hyperscalers team with local MSPs to address sovereign-cloud requirements, while ASEAN governments adopt cloud-first mandates that shorten sales cycles.
Europe shows steady expansion as GDPR, Digital Operational Resilience Act, and sustainability rules heighten compliance complexity. Germany drives Industry 4.0 managed services, the United Kingdom leans on MSPs for post-Brexit financial regulation, and France emphasizes sovereign-cloud frameworks. Providers differentiate through localized data centers and green-energy sourcing to meet environmental targets. The Middle East and Africa remain nascent but grow quickly on smart-city and e-government projects.

Regulatory Landscape
Managed services delivery is increasingly shaped by cybersecurity disclosure, operational-resilience, and data-sovereignty requirements that push buyers to demand auditable controls and tighter third-party oversight. In the United States, the Securities and Exchange Commission (SEC) cybersecurity disclosure rules in effect for 2024 compliance have increased scrutiny of incident response and reporting chains, reinforcing buyer requirements for 24/7 monitoring, evidence retention, and governance reporting from managed security providers.
In Europe, the Digital Operational Resilience Act (DORA) became applicable in 2025 and formalizes oversight of third-party ICT service providers used by regulated financial entities, tightening expectations around ICT risk management, testing, and contractual rights such as audit and access. Alongside these cross-border frameworks, country-level regimes add authorization and licensing layers for certain managed communications and ICT operations, illustrated by Ghana's National Communications Authority (NCA) draft Electronic Communication Managed Services license (2026), which includes requirements such as maintaining an information security management system aligned with ITU standards.
Competitive Landscape
Competition is intensifying as global SIs, hyperscalers, and pure-play MSPs vie for wallet share. Consolidation hit 182 transactions in Q2 2024, with acquirers seeking AI, security, and industry-vertical depth. Scale matters, yet niche specialists prosper by focusing on high-growth micro-verticals such as renewable-energy monitoring or clinical IoT security.
Technology investment creates moats. Accenture has built a USD 450 million generative-AI pipeline that automates code remediation and policy compliance, improving delivery margins and client outcomes. Dell aligns with Ericsson and Nokia to embed edge orchestration into 5G roll-outs, while IBM unveils renewable-energy monitoring suites that merge OT and IT data for sustainability governance.
Partner ecosystems influence share gains. Providers with strong hyperscaler certifications secure co-sell opportunities and preferential funding. Others bet on open-source automation and FinOps tooling to cut operating costs and pass savings to clients. Talent wars persist, pushing vendors to invest in learning academies and global delivery centers to ensure scalable, 24/7 support.
Managed Services Industry Leaders
Fujitsu Ltd
Cisco Systems Inc.
IBM Corporation
AT&T Inc.
HP Development Company LP
- *Disclaimer: Major Players sorted in no particular order

Market Opportunities and Future Outlook
AI operations has become a visible whitespace area for managed services portfolios as enterprises shift from discrete IT outsourcing toward full-stack operating models that combine infrastructure, data platforms, security, and governance for AI-ready workloads. In July 2026, HCLTech announced an investment of up to INR 3,500 crore to build an AI-ready data center business targeting 50 MW capacity, signaling provider moves to secure compute and facilities alongside managed-service delivery for enterprise and government customers.
Regulated and sovereign-data contexts continue to create room for in-country, compliance-aligned managed services that bundle cyber monitoring, risk reporting, and hybrid-cloud controls under tighter third-party oversight regimes. With SEC incident-disclosure requirements and EU DORA-driven oversight increasing the cost of non-compliance, buyers are translating governance needs into contract terms (auditability, transparency, concentration-risk management), expanding opportunities for providers that standardize evidence-led operations, automated compliance reporting, and secure-by-design managed AI and hybrid-cloud run services.
Recent Industry Developments
- July 2026: Fujitsu launched an AI-driven modernization service aimed at accelerating legacy system transformation. The release aligns modernization delivery with AI-enabled automation, strengthening managed-service positioning for enterprises migrating mainframe and other legacy estates into hybrid environments.
- April 2025: Accenture Federal Services won a USD 1.6 billion task order to enhance the U.S. Air Force Cloud One environment, including automated financial governance capabilities. The award underscores continued demand for hyperscaler-aligned managed cloud operations, with FinOps-style governance increasingly embedded into large managed services contracts.
- November 2024: Dell expanded 5G and edge collaborations with Ericsson and Nokia to bolster edge-management services. These partnerships support remote monitoring, orchestration, and lifecycle operations across distributed edge nodes, reinforcing managed services demand tied to telecom and enterprise edge roll-outs.


Research Methodology Framework and Report Scope
Market Definition and Coverage
For this report, the managed services market is defined as third-party, ongoing management of IT functions that customers outsource to improve uptime, service quality, and cost efficiency, with revenues captured from contracted managed service delivery across regions.
Scope exclusions: We do not count one-time consulting projects, pure hardware resale, or unmanaged cloud consumption that is not tied to a managed services contract.
Segmentation Overview
- By Deployment
- On-premise
- Cloud
- Public Cloud
- Private Cloud
- Hybrid Cloud
- By Service Type
- Managed Data Center
- Managed Security
- Managed Communications
- Managed Network
- Managed Infrastructure
- Managed Mobility
- Others
- By Enterprise Size
- Small and Medium Enterprises (SMEs)
- Large Enterprises
- By End-user Vertical
- BFSI
- IT and Telecommunication
- Healthcare and Life Sciences
- Manufacturing
- Retail and E-commerce
- Government and Public Sector
- Energy and Utilities
- Media and Entertainment
- Others (Education, Non-Profit)
- By Geography
- North America
- United States
- Canada
- Mexico
- South America
- Brazil
- Argentina
- Rest of South America
- Europe
- Germany
- United Kingdom
- France
- Italy
- Spain
- Rest of Europe
- Asia-Pacific
- China
- Japan
- India
- South Korea
- Southeast Asia
- Rest of Asia-Pacific
- Middle East and Africa
- Middle East
- Saudi Arabia
- United Arab Emirates
- Turkey
- Rest of Middle East
- Africa
- South Africa
- Nigeria
- Egypt
- Rest of Africa
- Middle East
- North America
Data Sources, Market Sizing, and Validation
Desk Research
Desk work started by mapping the service universe and demand signals that can be checked publicly, then aligning them to how managed service contracts are typically priced and renewed. We leaned on non paywalled sources such as the International Telecommunication Union, the World Bank, OECD ICT indicators, national telecom regulators, and cybersecurity publications from bodies like NIST to frame connectivity and risk priorities that influence outsourcing decisions.
To ground the model, we also reviewed annual reports and investor decks of listed service providers, procurement notices, and reputable press coverage on contract wins and delivery footprints. In parallel, paid subscriptions were used for company financials and intelligence, news and financials, and patent databases to speed up revenue mapping and identify fast shifting service themes. The sources named above are illustrative only, and additional references were also consulted for data collection, validation, and research clarification.
Primary Interviews and Surveys
Primary work focused on validating how managed services revenue is recognized, which parts of a contract are bundled, and how pricing changes with cloud migration and security requirements. We spoke with a mix of service providers, channel partners, and enterprise buyers across APAC, EMEA, and the Americas, so desk assumptions could be corrected when contract structures and adoption timing differed by region.
Distribution of primary research fieldwork respondents
| Company type | Respondent position | Region |
|---|---|---|
| Top tier: 37% | CXOs: 13% | APAC: 43% |
| Mid tier: 49% | Functional/Unit leaders: 28% | EMEA: 34% |
| Smaller Players: 14% | Managers: 59% | Americas: 23% |
Market-Sizing & Forecasting
Sizing was built using a top-down and bottom-up mix, where global IT and telecom spend signals were reconstructed into an addressable outsourcing pool, then filtered by managed services penetration across major service lines. The top-down path was checked with selective bottom-up approximations based on sampled provider revenue disclosures, deal-size ranges from interviews, and a simple volume-times-ASP logic for common contract types to keep totals realistic.
Key inputs in the model included enterprise IT outsourcing intensity, cloud adoption mix (public, private, hybrid), security service attach rates, typical contract length and renewal patterns, and regional wage inflation that affects service delivery pricing. For forecasting, we applied scenario analysis supported by expert inputs, since adoption speed and pricing are sensitive to macro budgets and security events. Where bottom-up inputs were missing for smaller countries or niche service bundles, we used proxy penetration rates from comparable markets and then re-tested through interviews before finalizing.
Data Validation & Update Cycle
Outputs were cross-checked against independent signals such as reported services revenue trends, large contract announcements, and region-level IT spending direction, then reviewed for unusual jumps by service type and geography. Any variance that could not be explained by a clear driver led to re-checks of assumptions, and when needed we re-contacted industry participants to confirm what changed.
Before publication, the model and logic go through multi-step analyst reviews so calculation choices, currency conversions, and year mapping stay consistent. Reports are refreshed annually, and interim updates are made when major events materially shift demand or pricing. Right before delivery, we run a fresh data pass so clients receive the most current view available.
Mordor Intelligence's Global Managed Services Market Market Size Compared Against Other Published Estimates
Published numbers for managed services do not always match because each publisher draws the line differently on what counts as a managed service, how bundled contracts are treated, and which year and currency timing are used. Differences also show up when one estimate relies more on vendor-led revenue rollups, while another relies more on demand-side adoption signals.
Some external estimates appear to include broader IT service activities adjacent to managed services, such as value-added project work bundled inside transformation programs, which can lift the reported total. For Mordor Intelligence, revenue is counted only when it is tied to an ongoing managed services contract across the defined service types, and one-time engagements or pure resale are kept out. Totals are then sanity-checked using region demand indicators and interview feedback.
Benchmark comparison
| Source | Market Size | Gaps in Research Methodology |
|---|---|---|
| Mordor Intelligence | USD 390.21 B (2025) | |
| Global Consultancy A | USD 401.15 B (2025) | Uses a wider solution lens that can fold in adjacent value-added activities like application testing and consultancy packaged with managed services, which tends to increase the 2025 total. |
| Trade Journal B | USD 393.02 B (2025) | The published figure provides limited detail on contract eligibility and revenue recognition, and the long-range projection suggests a more aggressive growth pathway that can shift how the base year is normalized. |
The side-by-side numbers mainly separate on scope control and on how bundled work is treated inside service contracts. By keeping inclusions tied to recurring managed services revenues and re-checking totals through simple cross-metrics, the final figure stays easier to trace back to clear variables and repeatable steps.


Key Questions Answered in the Report
What is the current size of the managed services market?
The managed services market is valued at USD 430.56 billion in 2026.
How fast is the managed services market expected to grow?
It is projected to reach USD 704.2 billion by 2031, translating to a 10.34% CAGR.
Which deployment model is most popular in managed services?
Cloud deployment models dominate with 52.35% share in 2025, and hybrid cloud shows the fastest growth trajectory.
Why are managed security services growing faster than other service types?
Rising cyber-threat levels and stricter compliance mandates require 24/7 monitoring and specialized expertise that most enterprises lack internally.
Which region offers the highest growth potential for providers?
Asia-Pacific is forecast to expand at an 11.28% CAGR through 2031 thanks to rapid digital transformation across manufacturing, financial services, and public sectors.
Page last updated on:


