
Market Overview
| Study Period | 2020 - 2031 |
|---|---|
| Market Size (2026) | USD 434.68 Billion |
| Market Size (2031) | USD 523.44 Billion |
| Growth Rate (2026 - 2031) | 3.78 % |
| Fastest Growing Market | Asia Pacific |
| Largest Market | North America |
| Market Concentration | Medium |
Major Players *Disclaimer: Major Players sorted in no particular order Image © Mordor Intelligence. Reuse requires attribution under CC BY 4.0. | |
Major Home Appliances Market Analysis by Mordor Intelligence
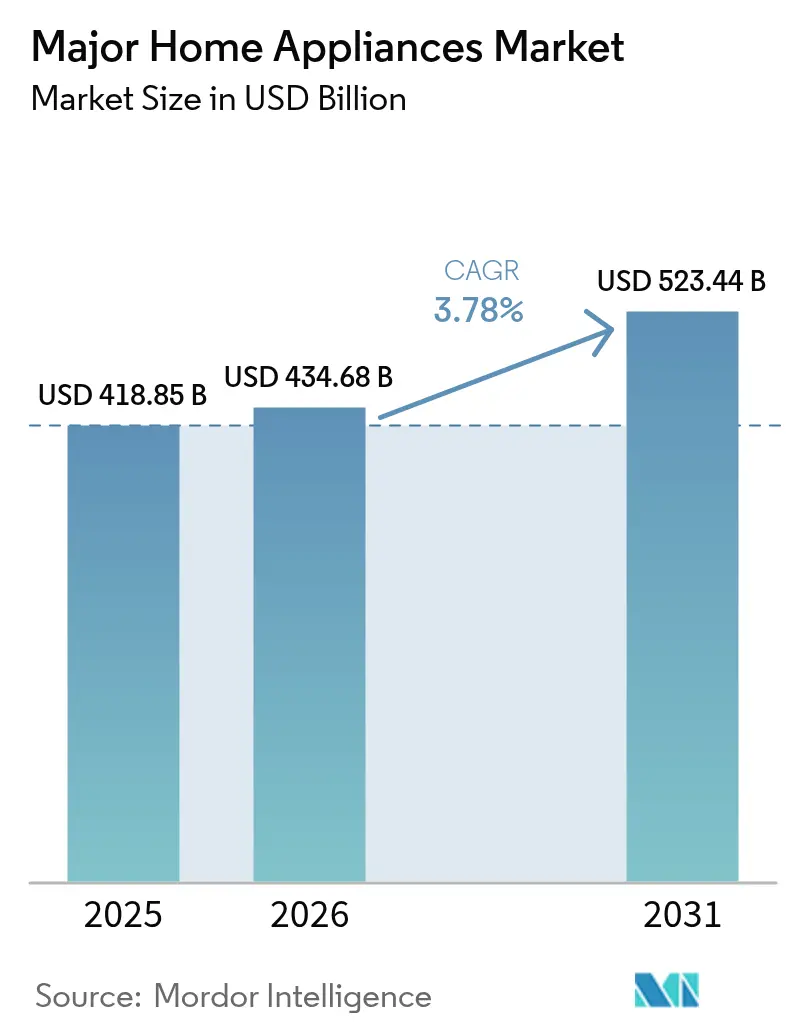
The Major Home Appliances Market size was valued at USD 418.85 billion in 2025 and estimated to grow from USD 434.68 billion in 2026 to reach USD 523.44 billion by 2031, at a CAGR of 3.78% during the forecast period (2026-2031).
Accelerated urban housing completions, stricter energy-efficiency rules, and fast-rising demand for digitally connected products underpin this steady expansion of the major home appliances market. Regulatory tailwinds in North America and the European Union are shortening replacement cycles, while Asia-Pacific manufacturing scale secures cost leadership and export momentum. In parallel, emerging economies in the Middle East & Africa are posting the quickest gains as rising disposable incomes unlock first-time purchases of refrigerators, washing machines, and air conditioners. Competitive intensity is rising because Chinese brands leverage aggressive pricing, rapid innovation, and expanding logistics footprints to challenge established Western incumbents.
Key Report Takeaways
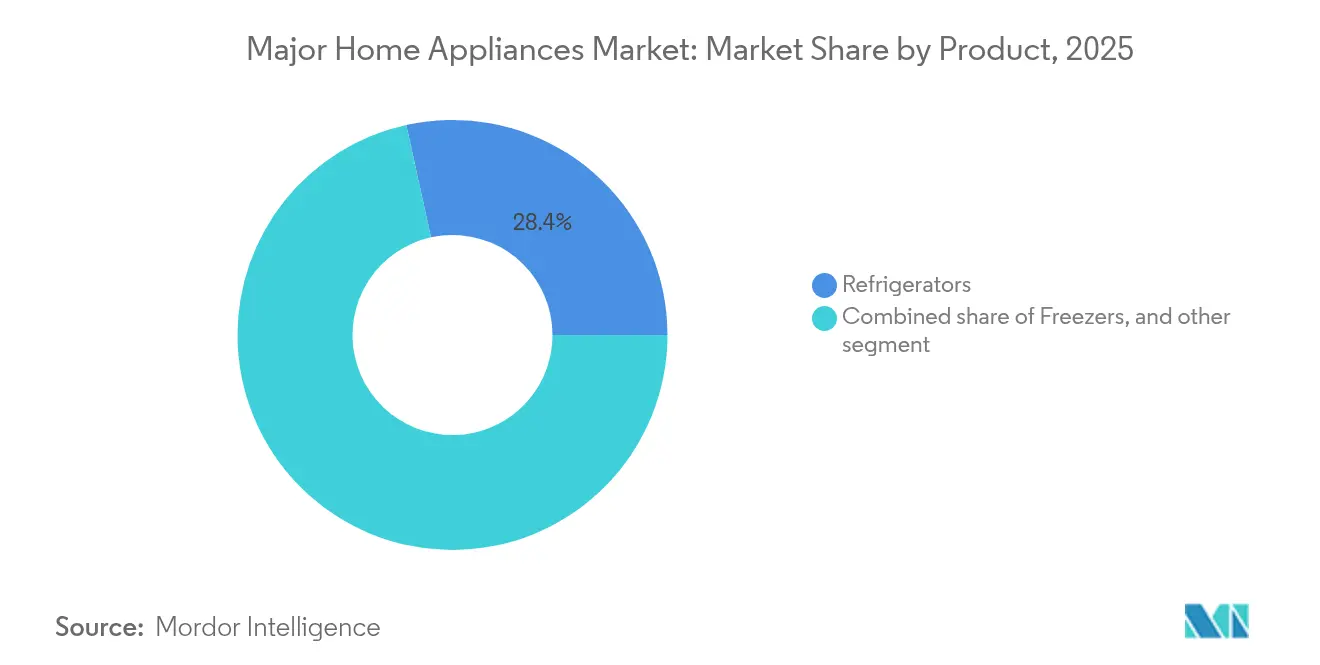
- By product, refrigerators led with 28.45% of the major home appliances market share in 2025, while dishwashers are forecast to expand at a 5.22% CAGR through 2031.
- By distribution channel, multi-brand stores captured 40.93% of the major home appliances market size in 2025, whereas online sales are projected to grow at a 5.76% CAGR to 2031.
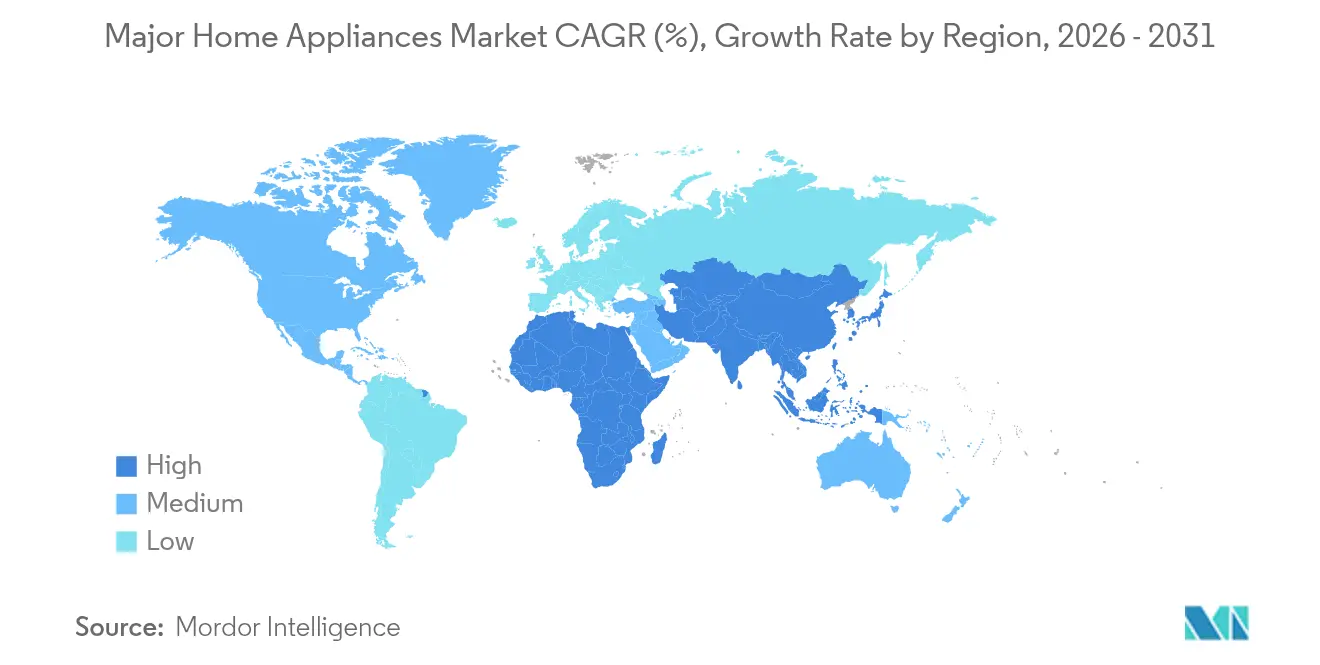
- By geography, Asia-Pacific accounted for a commanding 46.88% share of the major home appliances market in 2025, and the Middle East & Africa is advancing at a 5.38% CAGR through 2031.
Note: Market size and forecast figures in this report are generated using Mordor Intelligence’s proprietary estimation framework, updated with the latest available data and insights as of 2026.
Market Trends and Insights
Drivers Impact Analysis of Major Home Appliances Market*
| Driver | (~) % Impact on CAGR Forecast | Geographic Relevance | Impact Timeline |
|---|---|---|---|
| Rapid urbanization-fuelled housing completions | +0.8% | Global, concentrated in Asia-Pacific and MEA | Medium term (2-4 years) |
| Digitally connected “smart-home ready” demand | +1.2% | North America & EU, expanding to APAC | Short term (≤ 2 years) |
| Energy-efficiency standards push upgrades | +0.9% | Global, led by North America and EU | Long term (≥ 4 years) |
| Rental-first living models in Tier-1 Asia | +0.4% | China, Japan, South Korea | Medium term (2-4 years) |
| EU recycling credits for trade-ins | +0.3% | European Union states | Long term (≥ 4 years) |
| Health-focused hygiene features | +0.5% | Global with early adoption in North America & APAC | Short term (≤ 2 years) |
| Source: Mordor Intelligence | |||
Rapid Urbanization-Fuelled Housing Completions
Large-scale urban construction keeps the major home appliances market on a firm growth path. Government incentives lifted China’s refrigerator retail volumes 5.4% through November 2024, confirming the tight link between new apartments and multi-appliance purchases [1]China Household Electrical Appliances Association, “Three Challenges Facing China’s Refrigerator Industry in 2025,” cheaa.org. Newly built dwellings typically require an entire kitchen and laundry suite, multiplying demand well beyond the headline housing unit numbers. Sharp’s joint venture with Elaraby Group to assemble 500,000 refrigerators annually in Egypt by 2027 underlines how manufacturers localize output close to fast-growing cities to curb freight costs and serve regional buyers. Similar patterns are visible in the United States, where softness in existing-home sales contrasts with a 4% rise in new-home transactions, pivoting appliance demand toward full-fit-out packages that favor high-efficiency models. As utilities in emerging megacities raise tariffs, consumers increasingly select energy-rated refrigerators and air conditioners, strengthening the replacement and first-purchase cycle of the major home appliances market.
Digitally Connected “Smart-Home Ready” Demand Spike
The appetite for networked white goods is moving from early adopters to mainstream buyers in the major home appliances market. LG’s January 2025 pact with Microsoft to embed Copilot AI across appliances signals a pivot from hardware to software-centric value creation. Samsung’s Bespoke AI Laundry Combo, launched in India at INR 319,000 (USD 3,843) offers automated cycle selection and remote diagnostics, proving that advanced features are graduating from luxury to baseline expectations. GE Appliances extends this logic by folding recipe planning and grocery ordering into its SmartHQ app ecosystem. Bundled energy-management suites such as GE’s EcoBalance, co-developed with ABB, further blur boundaries between appliances and household infrastructure. Strong Q1 2025 sales of Haier’s connected water-purification line—up 264% year on year—confirm consumer willingness to pay for integrated digital convenience.
Energy-Efficiency Standards Driving Upgrade Cycles
Fresh regulations are accelerating the upgrade wave within the major home appliances market. The U.S. Department of Energy’s new cooking-product standards, effective 2028, prohibit high-consumption models and promise USD 1.6 billion in household savings over 30 years [2]U.S. Department of Energy, “DOE Finalizes Cost-Saving Efficiency Standards for New Cooking Products,” energy.gov. Canada’s April 2025 rules add stricter verification marks for HVAC, compelling producers to redesign or retire legacy SKUs. Europe’s Ecodesign Regulation broadens the scope to durability, repairability, and recyclability, making long-lasting units with replaceable parts a new norm. Appliances that meet ENERGY STAR Most Efficient 2025 criteria tap premium price tiers while offering measurable utility savings. New York State’s standards are slated to save consumers USD 264 million a year by 2035, demonstrating how sub-federal actions can shape OEM roadmaps [3]Rising smart-home adoption boosts CAGR by an estimated 1.2 percentage points..
Rental-First Living Models in Tier-1 Asian Cities
High housing prices in Beijing, Tokyo, and Seoul spur rental demand, which in turn reshapes consumption in the major home appliances market. Short-lease tenants favor compact, smart, and energy-rated appliances that can be relocated or included in furnished units. Manufacturers tailor lightweight refrigerators and washer-dryers with app-based diagnostics to minimize landlord maintenance visits. Subscription models emerge, allowing property owners to upgrade appliances every three to five years, aligning with rapid technology refresh and stricter energy regulations. Brands that integrate IoT sensors gain usage data, enabling pay-per-use billing or preventive service, thereby diversifying revenue beyond one-time hardware sales.
Restraints Impact Analysis of Major Home Appliances Market*
| Restraint | (~) % Impact on CAGR Forecast | Geographic Relevance | Impact Timeline |
|---|---|---|---|
| Persistent logistics cost inflation | −1.1% | Global, acute in import-dependent markets | Short term (≤ 2 years) |
| Semiconductor supply volatility post-2025 | −0.7% | Global, heavier on smart appliance categories | Medium term (2-4 years) |
| Slower mortgage formation in Europe | −0.4% | EU, notably Germany, France, Italy | Medium term (2-4 years) |
| Low switching propensity in price-sensitive LATAM | −0.3% | Brazil, Argentina, Mexico | Long term (≥ 4 years) |
| Source: Mordor Intelligence | |||
Persistent Logistics Cost Inflation on Bulky Goods
Freight rates for containers leaving China more than doubled between October 2023 and June 2024, pushing landed costs up throughout the major home appliances market [4]Rising smart-home adoption boosts CAGR by an estimated 1.2 percentage points.. Large appliances suffer extra charges because dimensional weight pricing limits container fill optimization. Manufacturers juggle whether to absorb higher ocean freight or pass it through to consumers already wrestling with inflation. Online channels feel the pinch when specialized last-mile crews with two-person delivery teams become scarce and pricey. Small island states, heavily reliant on maritime trade, face disproportionate shelf-price jumps that can blunt first-time appliance uptake. The resulting demand elasticity risks a vicious cycle of lower shipment volumes and even higher per-unit freight.
Semiconductor Supply Volatility Post-2025
The September 2024 shutdown of Spruce Pine’s quartz mines illustrates semiconductor fragility since the site supplies virtually all ultra-high-purity quartz for chipmaking. Appliance makers responded by reallocating scarce chips to essential control boards, sidelining advanced connectivity modules. Production delays swell inventories of older non-smart models, partially diluting the premium shift in the major home appliances market. Geographic chip-production concentration across East Asia amplifies geopolitical risk, nudging OEMs to diversify suppliers or invest in in-house microcontroller design. Such moves require multi-year capital, thereby capping near-term smart-feature penetration.
*Our forecasts treat driver/restraint impacts as directional, not additive. The impact forecasts reflect baseline growth, mix effects, and variable interactions.
Major Home Appliances Market Segment Analysis
By Product:
Refrigerators Retain Primacy as Dishwashers AccelerateRefrigerators dominated 2025 value with a 28.45% slice of the major home appliances market share, driven by their status as household essentials and continued innovation in inverter compressors, multi-door formats, and embedded IoT diagnostics. The major home appliances market size for cooling appliances is projected to expand steadily as manufacturers roll out variable-capacity devices that comply with emerging energy labels. Chinese exporters shipped 4.48 billion units in 2024, highlighting the scale advantage underpinning global price competitiveness. In contrast, dishwashers are slated for the fastest 5.22% CAGR as urban residents in Europe, North America, and increasingly Asia seek time savings and hygiene assurance. Rising water scarcity regulations also position modern dishwashers as resource-efficient alternatives to manual cleaning.
Premium refrigerator sub-segments featuring adaptive temperature zones, air-purification systems, and voice control command higher margins. Smart notification technologies flag door-left-open events, reducing food waste and enhancing user convenience. Luxury dishwashers add steam sanitation and app-based cycle customization, appealing to health-conscious households. Washing machines and air conditioners form a stable middle tier; both benefit from inverter motors and low-GWP refrigerants aligned with global climate policy. Ovens, including microwave-convection hybrids, show balanced yet slower growth, though impending U.S. standards will nudge the category toward high-efficiency replacements. The “other” cluster—water heaters, waste disposers, and integrated home hubs—offers niche opportunities tied to regional building codes and lifestyle shifts.


By Distribution Channel:
Multi-Brand Stores Anchor Sales While Online SurgesMulti-brand outlets maintained 40.93% value share in 2025, using broad assortments and immediate fulfilment to anchor the major home appliances market. Showroom demonstrations and in-store promotions influence big-ticket buying decisions where touch-and-feel remains critical. Retailers increasingly complement physical aisles with click-and-collect services to safeguard traffic against pure-play e-commerce rivals. Exclusive brand stores cultivate loyalty through curated experiences and vertically integrated service packages, yet geographic coverage gaps restrict their reach in rural zones.
E-commerce volumes are poised for a 5.76% CAGR through 2031 as improved last-mile capabilities narrow historic friction points in the major home appliances market. Specialist carriers deploy stair-climbing dollies and two-person crews, elevating delivery reliability. Augmented-reality configurators on retailer websites help buyers visualize products in kitchens and laundry rooms, boosting confidence in online purchases. Warehouse clubs and direct-to-consumer micro-brands capture discount-hungry or niche preference shoppers, rounding out the distribution mosaic. Omnichannel models that merge digital discovery with physical installation are emerging as the default pathway for most appliance makers.
Geography Analysis
APAC Major Home Appliances Market
Asia-Pacific heads the major home appliances market with 46.88% value share in 2025 thanks to enormous domestic demand and unrivaled manufacturing hubs. China remains the central production engine, yet India and Vietnam attract incremental factories as brands diversify risk. Urbanization and growing middle-class incomes sustain refrigerator and washing-machine upgrades, while government energy-label programs encourage premiumization. South Korea and Japan drive smart-home innovation, seeding software platforms subsequently rolled out across Southeast Asia.
North America Major Home Appliances Market
North America retains a sizeable high-value base characterized by frequent replacement cycles and early adoption of connectivity. Energy-efficiency mandates catalyze upgrades, and consumers show a willingness to pay for bespoke designs and bundled energy-management services. However, lingering inflation and higher interest rates moderate volume growth. The United States also houses research centers for AI integration, influencing global product roadmaps within the major home appliances market.
EMEA and South America Major Home Appliances Market
Europe shows divergent patterns: mature Western economies rely on steady replacement demand, whereas Central and Eastern Europe post above-average unit gains from first-time purchases. The region sits at the forefront of circular-economy regulation, pushing manufacturers to develop repair-friendly and recyclable models. Middle East & Africa shines as the fastest-growing region at a 5.38% CAGR through 2031, underpinned by infrastructure investment in the Gulf and accelerating electrification in Sub-Saharan Africa. Rapid housing projects in the UAE and Saudi Arabia translate into bundled appliance sales for new apartments. South America offers mixed prospects: Brazil exhibits sizable scale yet faces consumer credit constraints, while Colombia and Peru attract greenfield production aimed at tariff reduction. Collectively, geography continues to shape product mix, price positioning, and go-to-market choices within the major home appliances market.

Regulatory Landscape
In the United States, the Department of Energy updated certification, labeling, and enforcement provisions for consumer products in 2024, with initial certification compliance for many products starting May 7, 2025, tightening the compliance perimeter for manufacturers selling into the national market. The DOE also issued updated standards in 2024 for consumer clothes dryers and conventional cooking products, with compliance dates in 2028, anchoring multi-year redesign and qualification timelines for laundry and cooking platforms. In Europe, the Ecodesign for Sustainable Products Regulation ESPR entered into force on July 19, 2024, expanding focus to durability and circularity tools such as the Digital Product Passport and new aftersales readiness requirements. The European Commission released the first ESPR and Energy Labelling Working Plan for 2025-2030 in April 2025, signaling a structured pipeline of updates touching dishwashers, washing machines, and other laundry appliances while the transition period for legacy categories runs through December 31, 2026. In the United States, standard-setting methodology remains a live policy issue, as seen in the DOE proposals around procurement and rulemaking in 2026 and congressional activity such as H.R. 4626, which debates cost and availability considerations in future standards.
Value Chain Analysis
The major home appliances value chain runs from upstream materials such as steel, plastics, compressors and motors, refrigerants, sensors, and control boards into midstream product engineering and manufacturing by global OEMs and ODMs, and then downstream distribution and lifecycle services. Large brands coordinate multi-tier supplier networks for metal forming, electronics, insulation, and software stacks, with semiconductor and connectivity modules becoming more material for smart-ready refrigerators, laundry, and cooking platforms. Logistics and compliance are embedded across the chain because appliances are bulky, installation-intensive, and subject to energy labeling, certification, and warranty requirements that differ by region. Downstream, sales concentrate in multi-brand retail and growing online channels, but delivery, installation, and repair networks determine customer experience and total cost of ownership, making installers, authorized service partners, and parts distributors strategic complements to product differentiation.
Competitive Landscape
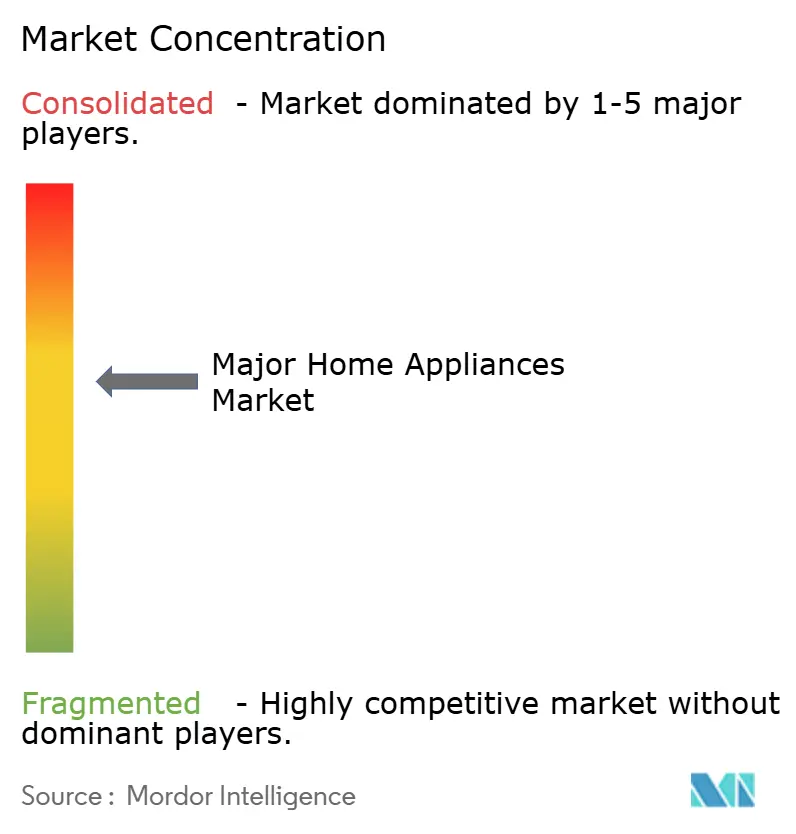
Competition is moderate but intensifying as Chinese challengers erode price points and compress margins across the major home appliances market. Market concentration in refrigeration and laundry remains higher than in emerging smart-appliance niches, where software capabilities create a long tail of entrants. GE Appliances pivots toward energy-ecosystem solutions, bundling cooktops and water heaters with smart panels that help households optimize consumption. Samsung’s Bespoke line emphasizes personalized panels and AI programming to differentiate beyond hardware specs. LG partners with Microsoft to add generative AI, converting appliances into interactive home assistants and drafting an alternative route to stickiness.
Haier leverages overseas acquisitions and localized manufacturing—now accounting for more than 50% of its USD 55.9 billion revenue—to meet regional standards quickly [HAIER.COM]. Midea and Hisense broaden cooperation on AI, advanced manufacturing, and intelligent logistics, seeking cost efficiencies and supply-chain resilience. Whirlpool defends share in South America via tailored products and renewed marketing despite caution over 2025 earnings outlook. Sharp’s Egyptian JV exemplifies how non-Chinese Asian brands invest in proximity production for Africa and the Middle East. Across the board, vendors race to secure semiconductor allocations, invest in repairable designs, and cultivate software ecosystems—all prerequisite capabilities to thrive in the evolving major home appliances market.
Major Home Appliances Industry Leaders
Haier Smart Home Co., Ltd.
Whirlpool Corporation
LG Electronics Inc.
Samsung Electronics Co., Ltd.
Electrolux AB
- *Disclaimer: Major Players sorted in no particular order
Major Home Appliances Market Companies Covered in this Report
- Arçelik A.Ş.
- Bosch-Siemens Hausgeräte GmbH (BSH)
- Electrolux AB
- Fisher & Paykel Appliances Ltd.
- Glen Dimplex Group
- Godrej & Boyce Mfg. Co. Ltd.
- Gree Electric Appliances Inc.
- Haier Smart Home Co., Ltd.
- Hisense Group
- Hitachi Global Life Solutions, Inc.
- LG Electronics Inc.
- Midea Group
- Panasonic Corporation
- Robert Bosch GmbH
- Samsung Electronics Co., Ltd.
- Sharp Corporation
- SMEG S.p.A.
- Sub-Zero Group, Inc.
- TCL Technology
- Whirlpool Corporation

Market Opportunities and Future Outlook
Smart, AI-enabled appliances and interoperable home platforms create whitespace in premium feature sets, service attachment, and partnerships that embed appliances into residential infrastructure. AWE 2026 in Shanghai showcased next-generation AI appliance concepts and roadmaps emphasizing always-connected ecosystems, remote diagnostics, and energy-management modes aligned with tightening efficiency rules in major markets. Regional manufacturing localization and sustainability-linked operations also define near-term opportunity areas, with Middle East and Africa investment activity visible in 2026, including the USD 480 million Elaraby Group investment in New Quesna City, Egypt, to expand production capacity and local content for selected categories. In operations, initiatives such as Coway's 2026 solar facility expansion highlight decarbonization and energy-cost management inside manufacturing footprints, complementing product-side moves like heat-pump drying and inverter motors to meet evolving energy and circularity requirements.
Recent Industry Developments in Major Home Appliances Market
- July 2026: LG Electronics signed an MOU with GS E&C to integrate LG's ThinQ ON AI home hub with the Xi apartment platform. The move links major appliances more tightly with new-build residential ecosystems, supporting default inclusion of connected appliances and accelerating software-led differentiation through developer-led rollouts.
- May 2026: Samsung Electronics announced the 2026 Bespoke AI Laundry Combo, adding upgraded AI cycles and faster wash-to-dry performance in an all-in-one format. It reinforces the market shift toward AI-assisted automation in laundry while tying product value to SmartThings connectivity and energy-management features.
- April 2026: Haier Smart Home unveiled its Seeker Series at AWE 2026, positioning it as an advanced connected appliance ecosystem integrating AI, robotics, and connectivity.


Major Home Appliances Market Report Scope and Research Methodology
Market Definition and Coverage
This market covers revenue earned from selling major home appliances used in households, counted at the point of sale by manufacturers and branded suppliers across major regions and channels.
Scope exclusions: We exclude small domestic appliances, spare parts sold separately, and purely service revenue that is not bundled with an appliance sale.
Segments Covered in This Report
- By Product
- Refrigerators
- Freezers
- Washing Machines
- Dishwashers
- Ovens (Incl. Combi & Microwave)
- Air Conditioners
- Other Major Home Appliances
- By Distribution Channel
- Multi-Brand Stores
- Exclusive Brand Outlets
- Online
- Other Distribution Channels
- By Geography
- North America
- Canada
- United States
- Mexico
- South America
- Brazil
- Peru
- Chile
- Argentina
- Rest of South America
- Europe
- United Kingdom
- Germany
- France
- Spain
- Italy
- BENELUX (Belgium, Netherlands, Luxembourg)
- NORDICS (Denmark, Finland, Iceland, Norway, Sweden)
- Rest of Europe
- Asia-Pacific
- India
- China
- Japan
- Australia
- South Korea
- South-East Asia (Singapore, Malaysia, Thailand, Indonesia, Vietnam, Philippines)
- Rest of Asia-Pacific
- Middle East and Africa
- United Arab Emirates
- Saudi Arabia
- South Africa
- Nigeria
- Rest of Middle East and Africa
- North America
Data Sources, Market Sizing, and Validation
Desk Research
Desk research was used to set the market boundaries and to build the starting demand and pricing assumptions for major appliance categories. We reviewed public statistics and reference series such as UN Comtrade trade flows, World Bank macro indicators, International Energy Agency efficiency and electrification context, and national statistics offices that publish housing, household formation, and durable goods indicators.
To connect market value with real-world volume signals, we also used manufacturer annual reports and investor presentations, customs and port disclosures where available, and reputed press coverage on pricing and promotions. In a few places, paid subscriptions for company financials and news intelligence were used to standardize revenue splits and to check corporate currency translation practices. The desk sources noted above are illustrative, and many other references were also used to collect data, validate assumptions, and clarify gaps.
Primary Interviews and Surveys
Primary work was used to pressure-test category definitions, channel mix, and price movements that are not fully visible in public data. We spoke with manufacturers, distributors, large-format retailers, and repair ecosystem participants across APAC, EMEA, and the Americas. The discussions were used to confirm assumptions on replacement cycles, premiumization, and smart-feature attach rates.
The respondent input was then used to correct unrealistic swings in units, ASPs, and regional shares before the final market totals were locked.
Distribution of primary research fieldwork respondents
| Company type | Respondent position | Region |
|---|---|---|
| Top tier: 33% | CXOs: 13% | APAC: 45% |
| Mid tier: 52% | Functional/Unit leaders: 30% | EMEA: 30% |
| Smaller Players: 15% | Managers: 57% | Americas: 25% |
Market-Sizing & Forecasting
The market is sized using a top-down build that starts from country-level demand pools, where household base, new housing completions, and replacement rates are used to reconstruct annual unit demand by major appliance types. Those unit pools are then converted to value using average selling prices that reflect mix shifts between entry, mid, and premium models, before results are aggregated to regional and global totals.
To keep the totals grounded, we corroborated the outputs with selective bottom-up checks such as sampled supplier revenue roll-ups, channel checks on sell-in versus sell-out timing, and unit-to-value sanity checks for high-volume categories like refrigerators, washing machines, and air conditioners. Key model inputs include household formation and urbanization, penetration of air conditioning and large cooking appliances, replacement cycle length, energy-efficiency policy direction, channel share changes between offline and online, and realized ASP progression after promotional cycles. For forecasting, scenario analysis is applied around housing activity and discretionary spend, and then the chosen path is aligned with expert consensus on replacement demand and mix premiumization.
Data Validation & Update Cycle
Validation is done through a set of cross-checks that compare modeled value with independent signals such as trade intensity, category shipment direction, and macro affordability indicators, followed by targeted rework where the deltas are too wide. When anomalies show up at country or category level, the assumptions are reviewed again, and respondents may be re-contacted to confirm whether a one-off event, channel inventory change, or pricing distortion explains the movement.
Before sign-off, the full model is reviewed in multiple analyst passes so definitions, currency conversions, and year alignment stay consistent. Reports are refreshed annually, and interim updates are made when material events occur. After that, a final pre-delivery review is completed to ensure clients receive the latest updated view.
Mordor Intelligence's Global Major Home Appliances Market Size Versus Other Published Estimates
Published market sizes for major home appliances can vary even for the same year because each publisher draws the scope a bit differently and then applies its own mix of unit, price, and currency assumptions.
The table shows a wide spread for 2025, and in Mordor Intelligence's model the value includes major categories such as air conditioners alongside refrigerators, washing machines, dishwashers, ovens, and other large appliances. Totals can shift when another estimate focuses on a narrower set of white-goods groups or uses a different price timing for the year.
Benchmark comparison
| Source | Market Size | Gaps in Research Methodology |
|---|---|---|
| Mordor Intelligence | USD 418.85 B (2025) | |
| Industry Data Publisher A | USD 298.00 B (2025) | Often presented as major appliances focused on core white-goods and cooking groups, which can exclude air conditioners and other large categories that materially lift total value, and may apply a different treatment of bundled delivery or installation. |
| Global Consultancy B | USD 410.22 B (2025) | May use a product and channel mapping that differs by region, for example how online-only models and smart-feature premiums are reflected in ASPs, which shifts the 2025 value even when the broad appliance set looks similar on paper. |
Looking across the three rows, most of the gap is explained by what gets counted as a major appliance category, plus how ASPs are aligned to the calendar year across regions. When assumptions are tied back to observable demand signals and then rechecked with supplier and channel feedback, the final number becomes easier to replicate and stress-test.


Key Questions Answered in the Report
What is the current value of the major home appliances market?
It is valued at USD 434.68 billion in 2026.
How fast will sales of major home appliances grow by 2031?
Revenue is projected to reach USD 523.44 billion by 2031, reflecting a 3.78% CAGR.
Which product captures the highest share?
Refrigerators hold 28.45% of 2025 global value.
Which channel grows quickest for appliance sales?
Online platforms are forecast to expand at 5.76% CAGR through 2031.
Which region grows fastest after 2026?
Middle East & Africa is advancing at a 5.38% CAGR.
What factor adds most to future demand?
Rising smart-home adoption boosts CAGR by an estimated 1.2 percentage points.
Page last updated on:


 Your data is secure and never sold or shared.


