
Location-Based Entertainment Market Size and Share
Market Overview
| Study Period | 2020 - 2031 |
|---|---|
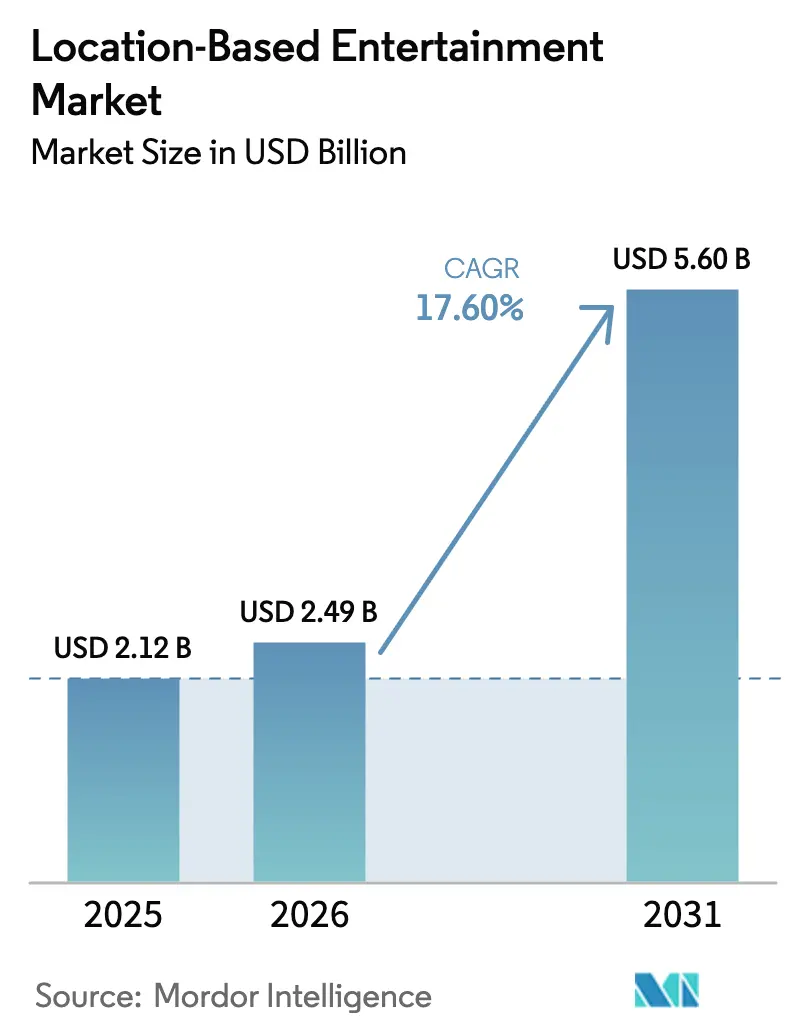
| Market Size (2026) | USD 2.49 Billion |
| Market Size (2031) | USD 5.6 Billion |
| Growth Rate (2026 - 2031) | 17.60 % |
| Fastest Growing Market | Asia-Pacific |
| Largest Market | North America |
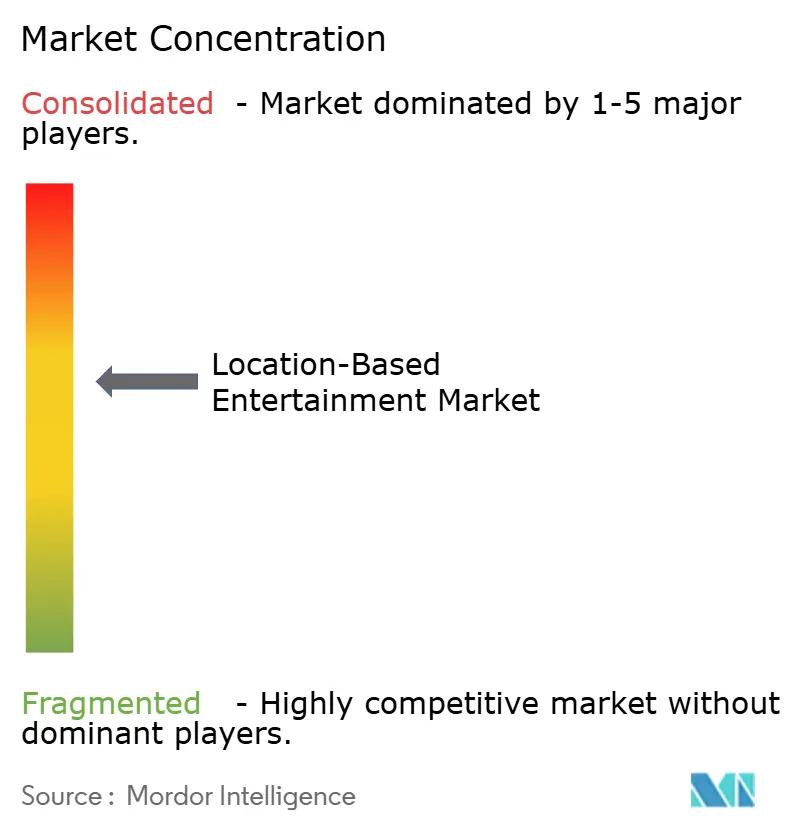
| Market Concentration | Medium |
Major Players
*Disclaimer: Major Players sorted in no particular order Image © Mordor Intelligence. Reuse requires attribution under CC BY 4.0. |
|
Location-Based Entertainment Market Analysis by Mordor Intelligence
The location-based entertainment market size in 2026 is estimated at USD 2.49 billion, growing from 2025 value of USD 2.12 billion with 2031 projections showing USD 5.6 billion, growing at 17.6% CAGR over 2026-2031. Momentum stems from widespread 5G coverage, generative-AI content pipelines, and blockbuster intellectual-property (IP) tie-ins that make premium, in-venue experiences difficult to replicate at home. Operators command higher average spend per visit by bundling merchandise, food, and event programming alongside immersive attractions. Hardware suppliers continue reducing headset weight and cost, smoothing adoption for both consumers and venues. Simultaneously, cloud-rendered content lowers on-site compute needs, unlocking new pop-up formats in shopping districts and travel hubs. Competitive rivalry centers on securing exclusive IP rights and forging edge-compute partnerships that can cut latency to sub-20 milliseconds, a threshold that supports multi-user mixed-reality arenas in compact footprints.
Key Report Takeaways
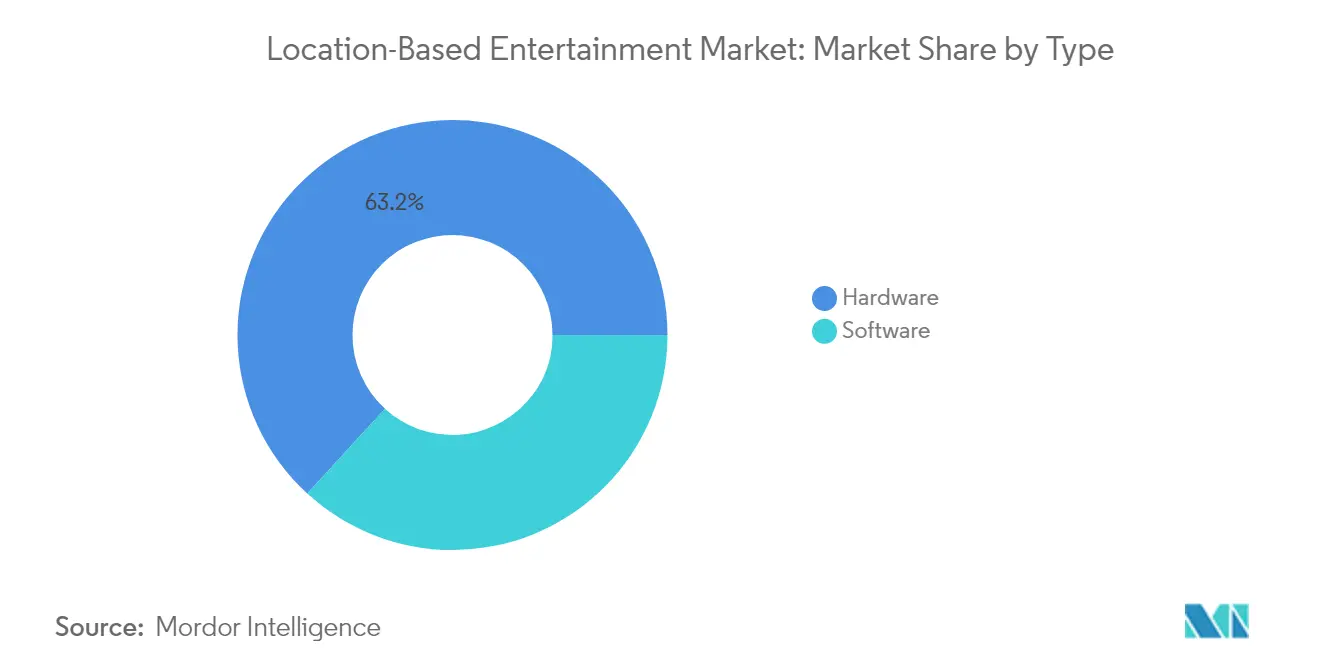
- By type, hardware led with 63.20% of location-based entertainment market share in 2025, while software and platforms are forecast to expand at a 23.10% CAGR through 2031.
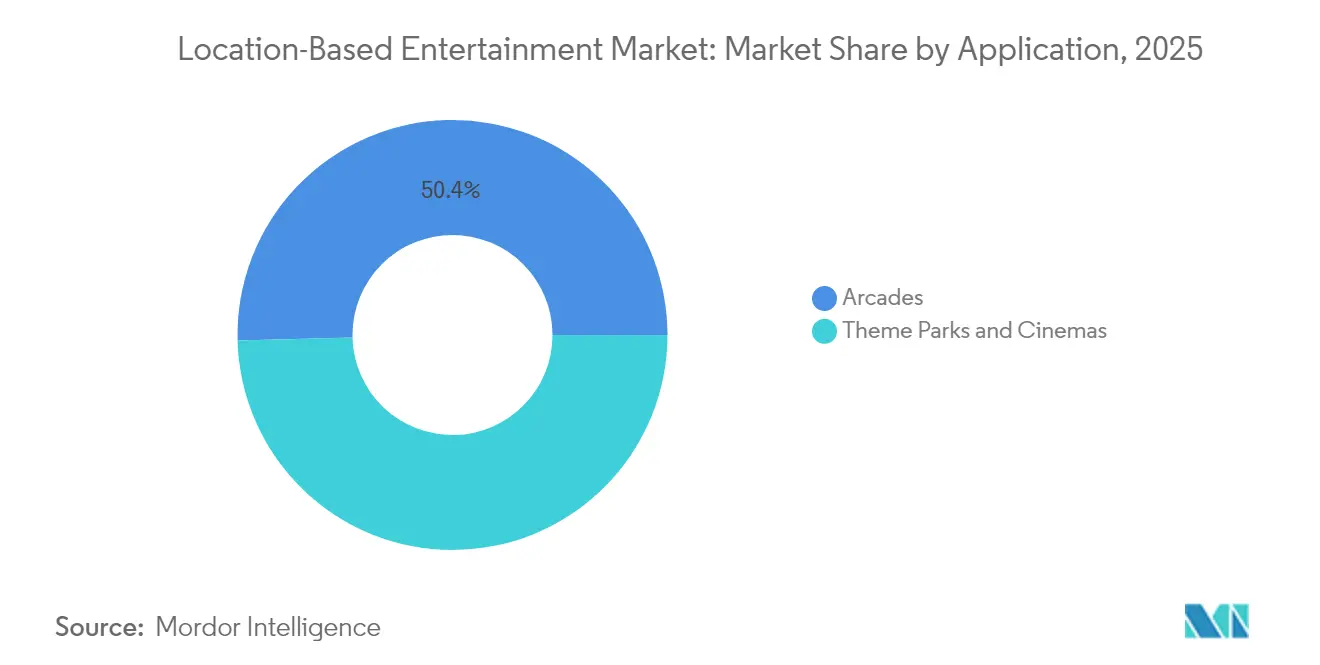
- By application, arcades held 50.40% of the location-based entertainment market share in 2025; theme parks are projected to grow at a 22.40% CAGR to 2031.
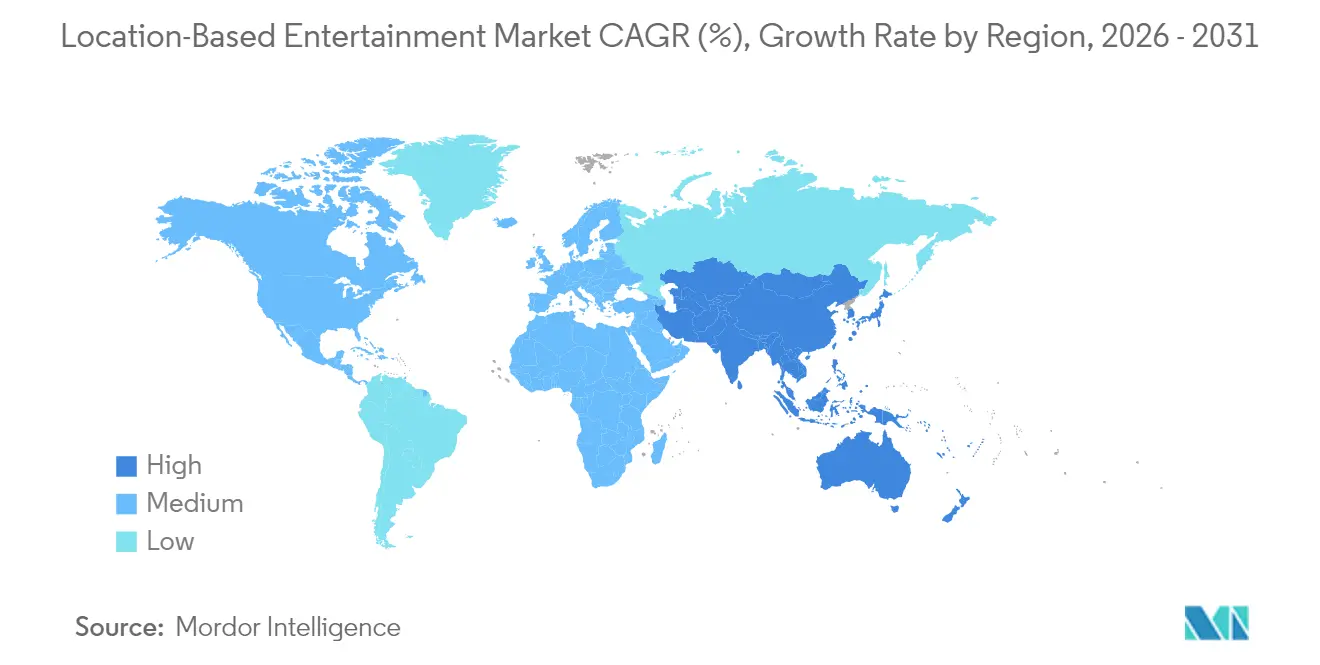
- By geography, the United States accounted for 35.55% of location-based entertainment market share in 2025, whereas China is poised for a 24.00% CAGR between 2026-2031.
Note: Market size and forecast figures in this report are generated using Mordor Intelligence’s proprietary estimation framework, updated with the latest available data and insights as of 2026.
Market Trends and Insights
Drivers Impact Analysis of Location-Based Entertainment Market*
| Driver | (~) % Impact on CAGR Forecast | Geographic Relevance | Impact Timeline |
|---|---|---|---|
| Rising spend per capita at amusement venues | +3.2% | Global; concentrated in North America and Europe | Medium term (2-4 years) |
| Rapid roll-out of turnkey LBVR franchise pods | +4.1% | North America, Europe, expanding to APAC | Short term (≤ 2 years) |
| 5G/edge-compute partnerships | +3.8% | Urban centers worldwide, led by US, China, South Korea | Medium term (2-4 years) |
| Generative-AI tools cutting content costs | +2.9% | Global; early adoption in developed markets | Long term (≥ 4 years) |
| Mixed-reality attractions tied to blockbuster IP | +2.7% | North America, Europe, expanding to China | Medium term (2-4 years) |
| Growing corporate team-building budgets | +1.8% | Developed markets, urban business districts | Short term (≤ 2 years) |
| Source: Mordor Intelligence | |||
Rising spend per capita at amusement venues
Consumers continue to premiumize out-of-home entertainment, paying more for differentiated multi-sensory attractions than for legacy arcade cabinets. Operators boost average transaction values by bundling exclusive merchandise, themed food, and VIP queue access. The trend aligns with younger cohorts prioritizing experiences over goods, sustaining footfall even in macro-economic slowdowns. Flexible pricing algorithms further lift yields during peak evening and weekend slots. As a result, location-based entertainment market revenue per square foot now rivals indoor trampoline parks and boutique cinemas.
Rapid roll-out of turnkey LBVR franchise pods
Standardized “store-in-a-box” packages compress venue launch cycles from months to weeks by bundling motion-tracked headsets, modular play-areas, and evergreen content libraries. Franchisees focus on local marketing and guest throughput, while the franchisor handles firmware, content updates, and remote diagnostics. Sandbox VR expanded from 8 to 25 franchise operators during 2024, targeting 200 active sites by 2027.[1] The model de-risks technology refresh costs for small business owners and drives network effects that attract third-party developers to a unified distribution platform.
5G/edge-compute partnerships enabling heavy-content streaming
Telco alliances with venue chains offload rendering tasks to nearby edge nodes, eliminating backpack PCs and tethered cables. In a joint showcase, Ericsson, AT&T, Dreamscape Immersive, NVIDIA, Qualcomm, and Wevr delivered an untethered, six-player experience with sub-20 ms round-trip latency.[2] Lower in-venue hardware costs open high-footfall sites such as airports and malls, while carriers monetize premium network slices during evening and weekend peaks.
Generative-AI tools cutting content production costs
Procedural world-building, character animation, and sound-design tools shorten concept-to-launch timelines and extend IP life cycles. Meta introduced AI-generated Horizon Worlds templates that convert text prompts into interactive environments within minutes. Independent studios can now refresh storylines quarterly, aligning with consumer demand for novelty and reducing licensing fees for off-the-shelf titles. Cost reductions of 40-60% redirect budget toward marketing and guest services, strengthening venue profitability.
Restraints Impact Analysis of Location-Based Entertainment Market*
| Restraint | (~) % Impact on CAGR Forecast | Geographic Relevance | Impact Timeline |
|---|---|---|---|
| High upfront CAPEX for multi-user arenas | -2.8% | Global; smaller operators disproportionately | Short term (≤ 2 years) |
| Content refresh cycle < 12 months inflating OPEX | -1.9% | Global; intense in competitive urban markets | Medium term (2-4 years) |
| Patchy insurance and safety regulations | -1.2% | Developed markets with strict liability rules | Long term (≥ 4 years) |
| Consumer hygiene concerns with shared HMDs | -0.8% | Global; heightened in health-conscious groups | Short term (≤ 2 years) |
| Source: Mordor Intelligence | |||
High upfront CAPEX for multi-user free-roam arenas
Fully immersive arenas require motion-capture arrays, reinforced flooring, and specialized fire-safety systems that push startup budgets well above USD 500,000. Premium head-mounted displays still cost several hundred dollars each to procure, and micro-OLED screens account for 21% of the Vision Pro bill of materials.[3] These capital hurdles favor franchise chains with franchisor financing or entertainment giants able to amortize costs across wider portfolios, leaving independent entrants to target smaller-scale booth formats.
Content refresh cycle < 12 months inflating OPEX
Frequent experience turnover is now a competitive necessity, yet licensing popular titles can absorb 15-25% of monthly operating spend. The gap between an average six-month consumer appetite for “something new” and the longer development calendars of bespoke experiences forces operators to license larger libraries than optimal. Subscription-based platforms soften the pain, but the lack of standardized royalty structures keeps margins thin. Operators that cannot sustain regular refreshes risk negative word-of-mouth and declining repeat visitation, constraining the location-based entertainment market’s addressable capacity in highly competitive cities.
*Our forecasts treat driver/restraint impacts as directional, not additive. The impact forecasts reflect baseline growth, mix effects, and variable interactions.
Location-Based Entertainment Market Segment Analysis
By Type:
Hardware Dominance Faces Software DisruptionHardware held 63.20% of 2025 revenue, benefiting from continuous display-resolution gains and lighter form-factors that improve guest comfort. At the same time, the segment’s gross margins face headwinds as component prices remain elevated; Vision Pro displays alone cost USD 456 per unit. Hardware makers counter margin compression by bundling maintenance contracts and exclusive content.
Software and platforms are the fastest-growing layer, advancing at a 23.10% CAGR from 2026-2031. Cloud streaming and AI-driven toolsets shift value toward recurring licensing, analytics, and community management fees. The location-based entertainment market size for software providers is projected to reach parity with hardware revenue before 2030, underpinned by demand for cross-venue leaderboards and personalized content playlists. Subscription bundles lower up-front cash burn for venues, while data dashboards optimize session scheduling, raising utilization by as much as 15%.

By Application:
Theme Parks Accelerate Past Arcade LeadersArcades accounted for 50.40% of 2025 revenue thanks to low floor-area requirements and flexible site selection. Franchised concepts average USD 1.7 million annual sales per US location. Nevertheless, arcades face intensifying competition from mall-based pop-ups and cinematic cross-overs.
Theme parks are the fastest-growing application, set for a 22.40% CAGR through 2031. Large operators integrate headline IPs, allowing premium ticket surcharges and multi-hour dwell times. Merlin Entertainments committed USD 110 million to Minecraft-themed attractions opening from 2026. Universal’s Epic Universe anchors its Dark Universe land around classic monster franchises, raising per-capita guest spend via collectible merchandise and themed dining. The location-based entertainment market size for theme parks is forecast to double as blockbuster IPs lure both domestic visitors and international tourists.
Geography Analysis
United States and United Kingdom Location-Based Entertainment Market
The United States remains the largest national market with 35.55% of 2025 revenue. Mature transport links and venture-capital funding enable rapid trials of new formats, while corporate off-sites fill weekday slots. Universal’s proposed Bedfordshire park underscores sustained investor appetite for large-scale projects in high-income regions.
China Location-Based Entertainment Market
China delivers the highest growth, a 24.00% CAGR to 2031, buoyed by government smart-city initiatives and a pipeline of more than 100 large VR complexes launched in 2024.. Aggressive 5G roll-out allows cloud rendering, trimming hardware costs for operators. Domestic studios merge folklore narratives with cutting-edge effects, creating culturally resonant attractions that draw repeat visitation.
Europe, APAC and Middle East Location-Based Entertainment Market
Europe shows steady progress as historic sites deploy immersive overlays to deepen visitor engagement. German operator Karls Erlebnis-Dorf invested EUR 30 million in new adventure zones during 2025.. Meanwhile, Rest-of-World growth clusters in Southeast Asia and the Middle East, where tourism authorities court franchise chains such as Singapore-based Neon Group, posting 20% annual sales gains and announcing new sites in Tokyo, Bangkok, and Paris.
Regulatory Landscape
Regulation for location-based entertainment (LBE) covers product safety, consumer warnings, market-access marking, and data protection obligations tied to in-venue XR deployments. In the European Union, EN IEC 62368-1:2026+A11:2026 provides a clearer safety compliance anchor for commercial VR and arcade machines, with mandatory compliance taking effect from July 16, 2026. That shift increases the need for documented conformity testing and technical files for both imported and locally assembled systems.
In the United States, the Consumer Product Safety Commission (CPSC) issued an updated warning label requirement (CPSC-26-018) effective August 1, 2026, requiring multilingual warning labels for arcade and VR equipment under 16 CFR 1500.121. The update adds packaging, labeling, and distribution checkpoints for operators and equipment suppliers. Cross-border requirements also add complexity for vendors selling into both the EU and the United Kingdom, where dual CE and UKCA marking requirements for arcade and VR machines take effect from October 1, 2026 under joint market-access guidance. Beyond hardware safety, immersive venues continue to face legal exposure related to privacy and biometric data processing under frameworks such as GDPR and CCPA/CPRA when headsets and tracking systems capture movement, eye/hand data, or identity-linked telemetry. This keeps attention on consent design, retention policies, and vendor contracts across multi-site deployments.
Value Chain Analysis
The LBE value chain begins with component and equipment suppliers, including XR headsets, tracking systems, LED walls, audio, and on-site networking. It then moves through software and distribution layers, such as content engines, venue management, and platforms such as HTC VIVERSE, before flowing into integrators and operators that package experiences for end users across arcades, theme parks, cinemas, and pop-up venues. Content creation and adaptation sits midstream across original studios and IP holders, followed by localization and live-ops teams that manage frequent refresh cycles and performance optimization for free-roam, multiplayer use.
Downstream, venue operators handle site build-out, staffing, ticketing, merchandising, and ongoing maintenance, with increasing emphasis on connectivity partners where low-latency delivery affects multi-user sessions. Compliance has become a more explicit step in 2026, with EU Notified Body type testing and technical documentation demands, alongside US-specific labeling configurations that add lead-time and cost before equipment reaches venues. These requirements raise the value of standardized, repeatable certification packages and centralized firmware and content update workflows for franchise and multi-site operators.
Competitive Landscape
Market structure remains moderately fragmented, with hardware builders, content studios, and operators pursuing hybrid strategies to secure wallet share across the value chain. Meta’s Reality Labs lost USD 4.2 billion in Q1 2025 despite USD 412 million in sales, signaling the scale of R&D outlays needed to shape standards. Venue chains such as Sandbox VR sidestep hardware risk, surpassing USD 200 million in lifetime revenue through franchise fees and central content sourcing. Traditional entertainment majors diversify into immersive formats: Disney negotiates to adapt MuppetVision 3D to Apple Vision Pro, while Meow Wolf layers augmented reality onto physical art installations for hybrid engagement.
Strategic alliances focus on edge-compute nodes, consumer-safe headsets, and proprietary IP pipelines. Early-mover advantages accrue to firms controlling both compelling content and the technical stack that delivers it cost-effectively. White-space applications in enterprise training and healthcare therapy attract new entrants, yet customer-acquisition economics still hinge on leisure-segment footfall volumes.
Location-Based Entertainment Industry Leaders
-
Meta
-
HTC
-
Samsung Electronics Co., Ltd.
-
Sony Interactive Entertainment Inc.
-
DPVR
- *Disclaimer: Major Players sorted in no particular order
Location-Based Entertainment Market Companies Covered in this Report
- Meta (Oculus VR)
- HTC Vive Tech
- Sony Interactive Entertainment
- Samsung Electronics
- DPVR
- Varjo
- Neurogaming
- Hologate
- Sandbox VR
- Zero Latency
- Dreamscape Immersive
- The VOID LLC (legacy IP)
- Exit Reality
- Spaces Inc.
- Illusion VR
- IMAX Corp. (IMAX VR)
- DOF Robotics
- Brogent Technologies
- Triotech
- Animax Designs
Market Opportunities and Future Outlook
A clear whitespace is forming around IP-forward, destination-linked XR that blends tourism and entertainment, using recognizable stories and real-world landmarks as the narrative backbone. HTC VIVERSE advanced this model in Japan during 2026 with location-based multiplayer VR tied to The Little Prince and a free-roam experience inside Osaka Castle, indicating that historical sites and cultural institutions can act as LBE distribution points beyond traditional arcades and theme parks. These deployments also show a co-production path for rights holders and local partners to develop experiences that support dwell time and repeat visits without requiring a full theme-park footprint.
Networked LBE formats are another actionable opportunity where telecom and edge partnerships reduce on-site compute and simplify multi-location operations. HTC and NTT DOCOMO BUSINESS announced a collaboration in Japan in June 2025 focused on immersive entertainment that uses advanced connectivity and platform integration, which fits the market shift toward cloud-rendered, centrally managed experiences. On the investment side, Sony Pictures Entertainment led a USD 100 million strategic investment into Cosm in June 2026, reinforcing how major media companies are funding experiential distribution and building capacity for premium, in-venue formats that combine cinematic IP, large-format presentation, and interactive layers.
Recent Industry Developments in Location-Based Entertainment Market
- June 2026: Sony Pictures Entertainment announced a USD 100 million strategic investment in Cosm as lead investor in its Series C financing to advance experiential entertainment. The investment strengthens the funding base for premium, venue-led formats and tightens the linkage between studio IP and physical immersive distribution.
- May 2026: Excape Entertainment and C.H.E. Group formed a strategic partnership to develop immersive, technology-driven location-based entertainment destinations across Australia and New Zealand. The collaboration expands the regional pipeline for tech-enabled venues and supports faster rollouts through a dedicated local development and operations model.
- April 2026: Sandbox VR expanded its partnership with LOL Entertainment to open two additional premium venues in Washington, D.C. and Baltimore. Adding new sites in dense US metro areas increases the installed base for centralized content updates and improves unit economics through higher throughput and repeat visitation.
Location-Based Entertainment Market Report Scope and Research Methodology
Market Definition and Coverage
For this study, the market is defined as revenues generated from paid entertainment experiences that are consumed at a physical venue. The experience must be enabled by dedicated hardware and software used on-site.
Scope exclusions: Excludes purely at-home digital entertainment consumption, even when it uses similar immersive content.
Segments Covered in This Report
-
By Type
- Hardware (Headsets)
- Software / Platforms
-
By Application
- Arcades
- Theme Parks
- Cinemas
-
By Geography
- North America
- Europe
- Asia-Pacific
- Rest of World
Data Sources, Market Sizing, and Validation
Desk Research
Desk research is used to map the real-world demand pool for out-of-home entertainment and to understand how venues earn revenue across ticketing, timed experiences, and on-site add-ons. To keep assumptions grounded, we rely on public references such as national statistics offices (consumer spending and recreation services), tourism boards (visitor arrivals and spend), and customs or trade portals that indicate equipment flows in broad terms.
We also review sources such as regulatory and standards bodies for safety and venue compliance signals, patent databases for activity around immersive systems, and peer-reviewed journals that discuss visitor behavior in interactive environments. Company filings, investor presentations, and reputable press are used to capture expansion plans, new site launches, and pricing signals, which are then normalized into the model. When needed, paid subscriptions for company financials and news intelligence, and patent coverage, are used to cross-check timelines and fill basic financial gaps. This list is illustrative only, and many other public and paid sources were also used for data collection, validation, and clarification.
Primary Interviews and Surveys
Primary work is used to pressure-test desk assumptions on what a typical venue sells, how pricing moves with utilization, and how often content is refreshed. We speak with a mix of operators, technology enablers, distributors, and venue partners across major regions so adoption differences by footfall patterns and entertainment budgets are reflected in the sizing.
Input from these discussions is used to confirm ranges for visitor volumes, average spend per visit, downtime, and the share of revenue coming from major applications, and then to adjust final totals where desk signals are too broad.
Distribution of primary research fieldwork respondents
| Company type | Respondent position | Region |
|---|---|---|
| Top tier: 34% | CXOs: 20% | APAC: 44% |
| Mid tier: 46% | Functional/Unit leaders: 22% | EMEA: 33% |
| Smaller Players: 20% | Managers: 58% | Americas: 23% |
Market-Sizing & Forecasting
Sizing starts from a top-down build where out-of-home entertainment spend and venue footfall signals are used to reconstruct the addressable pool for location-tied, ticketed experiences, which is then filtered through adoption and monetization assumptions. Those assumptions include venue counts by major formats, average visitors per site, average price per session or ticket, utilization by daypart and season, and the mix shift between arcades, theme parks, and cinemas.
To keep totals realistic, results are corroborated with selective bottom-up approximations, such as sampled price lists and capacity checks, plus supplier and channel inputs on how hardware and software revenue attaches to deployed experiences. Where hard revenue data is missing for smaller venues, ranges are applied and then narrowed using primary feedback and public expansion or closure signals.
For forecasting, scenario analysis is used so growth can be tied to variables interviewees referenced consistently, including new venue openings, refresh cycles for immersive content, consumer discretionary spending trends, and local tourism recovery paths. The final forecast is expressed in USD, with currency timing and inflation handling kept consistent across the time series so the trend is readable and comparable.
Data Validation & Update Cycle
Validation is done through step-by-step cross-checks against independent indicators, such as venue opening pipelines, observed pricing bands, and broad leisure spending direction. Large variances are reviewed before final sign-off. When the model produces a result that does not match known demand signals in a region or application, we re-check inputs, revisit the desk source trail, and re-contact relevant interviewees where clarification is needed.
Each report is refreshed annually, and interim updates are made when material events can change the demand environment, such as major venue rollout announcements or sharp shifts in travel activity. Before delivery, an analyst performs a fresh pass on the dataset and assumptions so clients receive the latest updated view.
Mordor Intelligence's Global Location Based Entertainment Market Size Compared Against Other Published Estimates
Published market sizes can look far apart because firms do not always count the same revenue streams, and they also use different base years and pricing assumptions for venue experiences. Differences get larger when some sources blend in broader entertainment categories that are adjacent but not truly location-tied, and then apply aggressive adoption curves.
Consumer VR headsets used mainly at home are not counted here because they sit outside Mordor Intelligence's scope for location-based entertainment, and that single exclusion often explains why some public figures appear much higher. Gaps also come from whether estimates include only ticketed admissions or also bundle food, merchandise, and sponsorships, and whether they use announced capacity targets instead of realized footfall and utilization. Currency conversion timing and refresh cadence matter too, since venue pricing and attendance can change quickly after new attraction launches.
Benchmark comparison
| Source | Market Size | Gaps in Research Methodology |
|---|---|---|
| Mordor Intelligence | USD 2.49 B (2026) | |
| Trade Journal A | USD 3.86 B (2024) | Uses a broader definition that tends to bundle adjacent immersive entertainment revenues and applies high near-term growth without consistent utilization checks. |
| Industry Report B | USD 5.47 B (2024) | Includes a wider set of venue systems and spend items, and may reflect program budgets and installed-base value rather than realized annual venue revenues. |
Overall, the spread is mainly explained by what is counted as in-venue revenue versus adjacent hardware and broader immersive spending. By anchoring the model to venue footfall, average spend, and utilization, and then sanity-checking those inputs through operator interviews, we end up with a total that is easier to trace and repeat year after year.
Key Questions Answered in the Report
What is the current size of the location-based entertainment market?
The market generated USD 2.49 billion in 2026 and is projected to reach USD 5.6 billion by 2031 at an 17.60% CAGR.
Which segment holds the largest location-based entertainment market share?
Hardware accounted for 63.20% of revenue in 2025, reflecting continued demand for high-performance headsets and tracking systems.
Which application is expanding the fastest?
Theme parks are forecast to grow at a 22.40% CAGR from 2026-2031, driven by blockbuster IP integrations and premium guest spending.
Why is China the fastest-growing region?
Government smart-city initiatives, rapid 5G deployment, and the launch of more than 100 large-scale VR projects in 2024 support a 24.00% regional CAGR through 2031.
How are 5G and edge computing affecting the industry?
Low-latency edge nodes eliminate the need for bulky on-site PCs, lowering capital costs and enabling untethered multi-user experiences that raise venue throughput and guest satisfaction.
What challenges limit near-term growth?
High upfront capital requirements for free-roam arenas and the need to refresh content in less than 12 months strain cash flow, especially for independent operators.