| Study Period | 2017 - 2030 |
| Base Year For Estimation | 2024 |
| Forecast Data Period | 2025 - 2030 |
| Market Size (2025) | USD 23.5 Billion |
| Market Size (2030) | USD 31.53 Billion |
| CAGR (2025 - 2030) | 6.05 % |
| Market Concentration | Low |
Major Players*Disclaimer: Major Players sorted in no particular order |

Liquid Fertilizer Market Analysis
The Liquid Fertilizer Market size is estimated at 23.5 billion USD in 2025, and is expected to reach 31.53 billion USD by 2030, growing at a CAGR of 6.05% during the forecast period (2025-2030).
The liquid fertilizers industry is experiencing a significant transformation driven by technological advancements in application methods and a growing emphasis on precision agriculture. The adoption of advanced irrigation systems, particularly in developed regions, has revolutionized liquid fertilizer application techniques, with over 55% of irrigated land in major European countries now equipped with sprinklers or micro-irrigation systems. This technological integration has not only improved nutrient delivery efficiency but has also contributed to more sustainable farming practices through precise application methods and reduced wastage.
The liquid fertilizers market is witnessing a notable shift in nutrient management strategies, with an increasing focus on optimizing nutrient uptake efficiency. In 2022, nitrogen emerged as the primary nutrient in application rates, accounting for 42.18% of average nutrient application at 330.44 kg/ha, while micronutrients like manganese, zinc, and copper showed significant application rates at 9.53 kg/ha, 6.63 kg/ha, and 6.34 kg/ha respectively. This trend reflects the growing understanding of crop-specific nutrient requirements and the importance of balanced fertilization programs.
Environmental sustainability has become a cornerstone of the liquid fertilizers market, with manufacturers and farmers increasingly adopting eco-friendly practices. The industry has seen a remarkable shift towards fertigation and foliar application methods, which have demonstrated superior efficiency in nutrient delivery while minimizing environmental impact. More than 85% of global agricultural land is currently dedicated to field crops, emphasizing the critical need for sustainable fertilization practices that can support large-scale agricultural operations while preserving soil health.
The liquid fertilizer market dynamics are being reshaped by changing agricultural practices and the growing adoption of specialty crops. Fertigation has emerged as a preferred application method, accounting for nearly half of all liquid fertilizer applications, owing to its precision and efficiency in nutrient delivery. This trend is particularly evident in regions with advanced irrigation infrastructure, where governments are actively promoting micro-irrigation systems through various subsidy programs and initiatives, leading to increased adoption of liquid fertilizers through modern application techniques.
Global Liquid Fertilizer Market Trends
The rising pressure on the agriculture industry to meet the increasing demand for food is expected to increase the area under field crop cultivation
- The global agricultural sector is currently facing many challenges. According to the UN, the world population is likely to exceed nine billion by 2050. This population growth may overburden the agricultural industry, which is already experiencing an output loss due to a lack of laborers and the shrinkage of agricultural fields caused by rising urbanization. According to the Food and Agriculture Organization, 70% of the global population is expected to live in cities by 2050. Due to the global loss of arable land, farmers now need to utilize more fertilizers to increase crop yields.
- Asia-Pacific is the world's largest producer of agricultural products. Agriculture is critical to the region's economy, as it employs about 20% of the total available workforce. Field crop cultivation dominates the region, accounting for more than 95% of the total crop area in the region. Rice, wheat, and corn are the major field crops produced in the region, which accounted for about 24.3% of the total crop area in 2022.
- North America is the second-largest arable region of the total agricultural land area in the world. Diverse varieties of crops are grown in North American farms, primarily field crops. As per the USDA, corn, cotton, rice, soybean, and wheat are among the region's dominant field crops. The United States dominated the market by accounting for 46.2% of the total area under crop cultivation during the study period, with field crops covering the majority of the area compared to other crop types. Crop acreage in the country fell significantly between 2017 and 2019, primarily due to unfavorable environmental conditions that resulted in heavy floods in areas such as Texas and Houston.

Understand The Key Trends Shaping This Market
Download PDF
The global average application rate of primary nutrient nitrogen, potassium, and phosphorus in field crops is 164.31 kg/ha
- Corn, rapeseed, cotton, sorghum, rice, wheat, and soybean are some of the major primary nutrient-consuming crops worldwide. The primary nutrient application rates for these field crops are 230.57 kg/ha, 255.75 kg/ha, 172.70 kg/ha, 158.46 kg/ha, 154.49 kg/ha, 135.35 kg/ha, and 120.97 kg/ha, respectively. Primary nutrient fertilizers are crucial for crops because they play an essential role in plant metabolic processes and assist in forming tissues such as cells, cell membranes, and chlorophyll. Phosphorus is essential for growing high-quality crops; potassium activates the enzymes needed for plant growth and development.
- The global average application rate of nitrogen, potassium, and phosphorus in field crops is 164.31 kg/ha. Nitrogen is the most widely used primary nutrient fertilizer in field crops, accounting for an application rate of 224.6 kg/hectare, followed by potassic fertilizers with 150.3 kg/hectare, and phosphorus was the third most consumed fertilizer with an application rate of 117.9 kg/hectare in 2022.
- In 2022, the nitrogen application rate was highest in rapeseed at 347.4 kg/hectare. Similarly, the phosphorus application rate was highest in corn at 156.3 kg/hectare, and the potassium application rate was highest in canola at 248.6 kg/hectare. The global field crop cultivation area is increasing, particularly in South America and Asia-Pacific. These are the potential growing markets for fertilizers. Due to their efficiency, specialty fertilizers are widely used in developed regions such as Europe, North America, and other regions with widespread nutrient deficiencies. These factors are anticipated to drive the primary nutrient fertilizers market between 2023 and 2030.

OTHER KEY INDUSTRY TRENDS COVERED IN THE REPORT
- Fruits and vegetables have higher economic returns and growing demand.
- Micronutrient deficiency can cause several detrimental effects in vegetable crops
- Sulfur is immobile in plants, making it more crucial nutrient for plant yield.
- Technical advancements in irrigation equipment and well water management practices may increase areas under irrigation
- Asia-Pacific accounted for the highest average micronutrient application rate of 5.20 kg/hectare
- Tomatoes have high average nutrient application rate of 386.4 kgs of primary nutrients per hectare
- Magnesium has accounted for the highest average application rate in vegetable crops among the secondary nutrients
Segment Analysis: Type
Straight Fertilizers Segment in Global Liquid Fertilizer Market
Straight fertilizers dominate the global liquid fertilizer market, commanding approximately 51.5% market share in 2024. This segment encompasses various nutrient-specific formulations, including nitrogenous, phosphatic, potassic, and micronutrient fertilizers. The dominance of straight fertilizers can be attributed to their versatility in addressing specific nutrient deficiencies, ease of customization based on crop requirements, and their compatibility with modern liquid fertilizer application methods like fertigation and foliar spraying. Nitrogen-based straight fertilizers, in particular, account for the largest share within this segment due to nitrogen being a crucial nutrient for plant growth and development. The segment's strong position is further reinforced by increasing adoption in precision farming practices and the growing trend toward sustainable agriculture that demands targeted nutrient application.
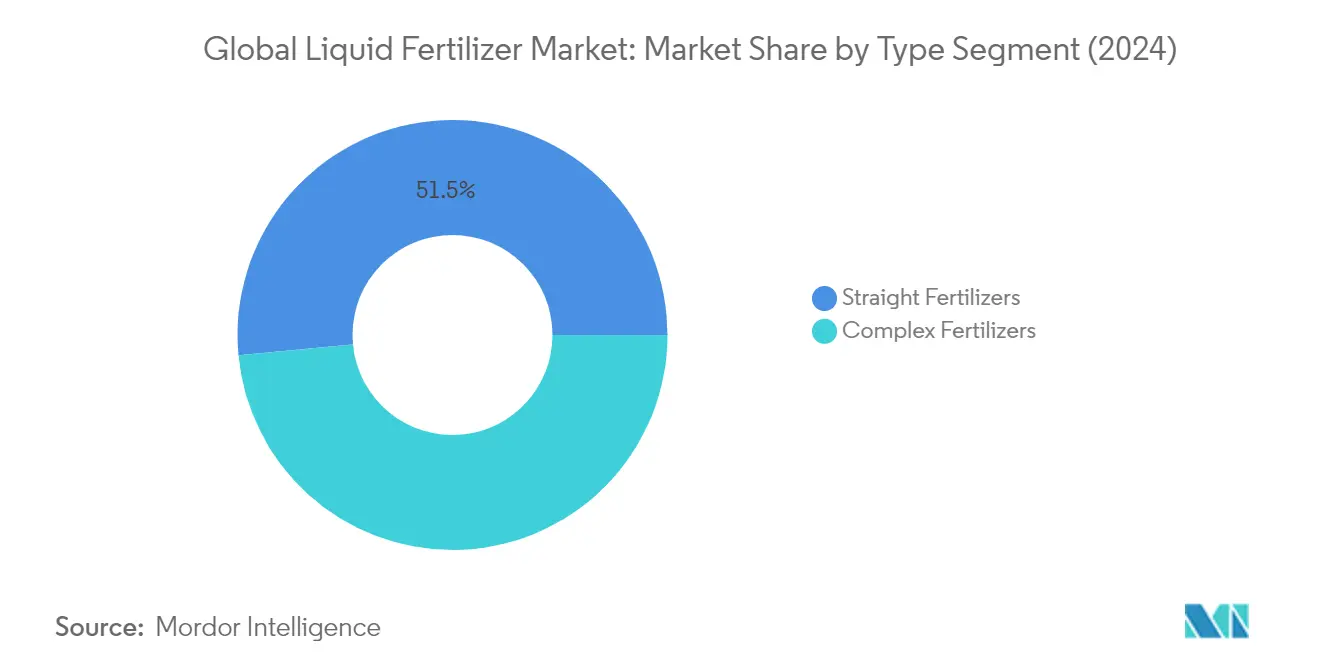
Complex Fertilizers Segment in Global Liquid Fertilizer Market
The complex fertilizers segment is experiencing robust growth in the global liquid fertilizer market, driven by increasing demand for balanced crop nutrition solutions. These multi-nutrient formulations are gaining traction among farmers due to their ability to provide comprehensive plant nutrition in a single application. The segment's growth is supported by technological advancements in manufacturing processes that enable better nutrient combinations and enhanced absorption rates. Complex liquid fertilizers are particularly favored in modern agricultural practices like greenhouse cultivation and hydroponic systems, where precise nutrient management is crucial. The segment's expansion is further bolstered by rising awareness about the benefits of balanced fertilization and the increasing adoption of advanced irrigation systems that facilitate efficient nutrient delivery.
Segment Analysis: Application Mode
Foliar Segment in Global Liquid Fertilizer Market
The foliar application segment has emerged as the dominant method in the global liquid fertilizer market, commanding approximately 50% of the total market share in 2024. This method has gained significant traction due to its superior efficiency in nutrient delivery, where fertilizers are directly applied to plant leaves for rapid absorption. The foliar feeding method plays a particularly crucial role when soil conditions are suboptimal, such as in cases of inappropriate pH levels, nutrient imbalances, or waterlogging conditions. In such scenarios, crops face difficulties in absorbing nutrients through soil application, making foliar application an ideal alternative. The segment's popularity is further enhanced by its compatibility with various crop protection chemicals, enabling single-application sprays that reduce labor costs and improve overall efficiency. Additionally, the method's precision in addressing nutrient deficiencies and its ability to provide quick correction of nutritional shortcomings has made it particularly valuable for high-value crops and during critical growth stages.
Fertigation Segment in Global Liquid Fertilizer Market
The fertigation segment represents a significant portion of the liquid fertilizer market, offering a highly efficient method of nutrient delivery through irrigation systems. This application mode is experiencing substantial growth due to its ability to provide precise nutrient distribution while minimizing waste and optimizing water usage. The increasing adoption of micro-irrigation systems across various regions has been a key driver for this segment's expansion. Fertigation allows farmers to apply fertilizers uniformly throughout the field, ensuring consistent nutrient availability to crops while reducing labor costs and improving nutrient use efficiency. The method's compatibility with various irrigation systems and its ability to maintain optimal nutrient levels throughout the growing season has made it particularly attractive for modern agricultural practices.
Segment Analysis: Crop Type
Field Crops Segment in Liquid Fertilizers Market
Field crops continue to dominate the global liquid fertilizers market, commanding approximately 77% of the total market share in 2024. This segment's prominence is primarily attributed to the extensive area under cultivation, with more than 85% of global agricultural land dedicated to field crops. Major crops like corn, wheat, and rice are the primary consumers of liquid fertilizers in leading agricultural nations such as China, India, the United States, Brazil, and Russia. These countries demonstrate relatively higher fertilizer application rates, averaging above 145 kg/ha, with Brazil notably reaching around 309 kg/ha. The segment's strong position is further reinforced by the ease of application of liquid fertilizer through fertigation and foliar spraying methods, which offer higher nutrient uptake efficiency. The Asia-Pacific and North America regions lead in field crop liquid fertilizer usage, accounting for about 42% and 26% market share respectively, followed by Europe at approximately 16%.
Horticultural Crops Segment in Liquid Fertilizers Market
The horticultural crops segment is emerging as the fastest-growing sector in the liquid fertilizers market, driven by increasing health consciousness and rising demand for high-value crops in the post-pandemic era. This segment is experiencing robust growth, particularly in vegetable crops with high demand such as tomatoes, potatoes, onions, cabbage, and cauliflower, which consume substantial amounts of fertilizers and are cultivated year-round. Foliar liquid fertilizers play a crucial role in fruit crops, as foliar spraying has proven effective in improving fruit quality and yield. The segment's growth is further supported by technological and scientific advancements in crop production, including precision farming, greenhouse farming, and vertical farming techniques that help farmers address productivity and efficiency challenges. The adoption of liquid fertilizers in horticultural crops is particularly strong in regions with widespread nutrient deficiencies, driving the market's expansion through advanced application methods and improved nutrient delivery systems.
Remaining Segments in Crop Type
The turf and ornamental segment, while smaller in market share, plays a significant role in the liquid fertilizers market, particularly in developed regions with extensive landscaping and recreational facilities. This segment caters to specialized applications in golf courses, sports fields, public parks, and ornamental gardens, where precise nutrient management and aesthetic considerations are paramount. The segment's importance is growing with increasing urbanization and rising demand for well-maintained green spaces. The unique requirements of turf and ornamental applications, including the need for consistent appearance and health maintenance throughout the year, drive the adoption of specialized liquid fertilizer formulations. This segment particularly benefits from the precision application capabilities of liquid fertilizers, allowing for exact nutrient delivery and minimal waste in these high-value applications.
Liquid Fertilizer Market Geography Segment Analysis
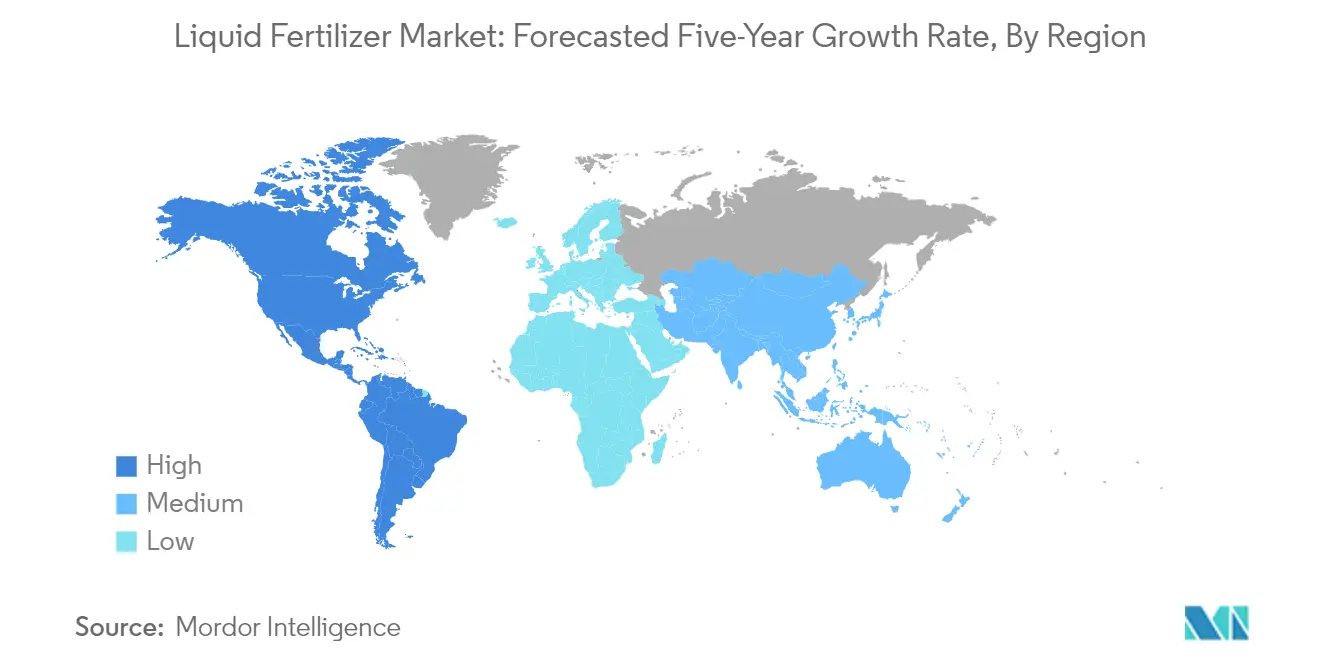
Liquid Fertilizer Market in Asia-Pacific
The Asia-Pacific region stands as a dominant force in the global liquid fertilizer market, driven by increasing awareness among growers about the benefits of liquid fertilizers. The region's agricultural sector is experiencing a significant transformation, with farmers recognizing the advantages of these fertilizers in terms of soil penetration and nutrient absorption. Countries like China, India, Japan, and Australia are leading this transformation through advanced irrigation systems and precision farming techniques. The region's diverse agricultural landscape, ranging from extensive field crops to high-value horticultural products, provides a strong foundation for liquid fertilizer adoption.
Liquid Fertilizer Market in China
China emerges as the powerhouse in the Asia-Pacific liquid fertilizer market, commanding approximately 35% of the regional market share in 2024. The country's dominance is attributed to its vast agricultural land and progressive farming practices. Chinese farmers are increasingly adopting liquid fertilizers as part of their sustainable agriculture initiatives, particularly in regions focusing on high-value crops. The government's emphasis on reducing conventional fertilizer usage while promoting efficient alternatives has created a favorable environment for liquid fertilizer adoption. The country's robust distribution network and growing awareness about precision farming techniques further strengthen its market position.
Liquid Fertilizer Market in India
India represents the most dynamic market in the Asia-Pacific region, with a projected growth rate of approximately 6% during 2024-2029. The country's agricultural sector is undergoing rapid modernization, with farmers increasingly adopting advanced fertilization techniques. The government's push towards sustainable agriculture and efficient nutrient management has created a strong foundation for liquid fertilizer adoption. India's diverse crop pattern, ranging from traditional field crops to high-value horticultural products, provides multiple opportunities for liquid fertilizer applications. The country's expanding irrigation infrastructure and growing awareness about precision farming techniques are expected to drive sustained growth in the liquid fertilizer market.
Liquid Fertilizer Market in Europe
Europe's liquid fertilizer market is characterized by its advanced agricultural practices and strong focus on sustainable farming methods. The region's well-developed infrastructure and high mechanization levels provide an ideal environment for liquid fertilizer adoption. Countries such as Germany, France, Italy, and the United Kingdom are at the forefront of implementing precision agriculture techniques, while Eastern European nations are rapidly modernizing their agricultural sectors. The region's stringent environmental regulations and emphasis on reducing chemical fertilizer usage have created a favorable environment for liquid fertilizer adoption.
Liquid Fertilizer Market in Germany
Germany leads the European liquid fertilizer market, holding approximately 25% of the regional market share in 2024. The country's leadership position is supported by its highly mechanized agricultural sector and strong focus on precision farming techniques. German farmers are early adopters of innovative agricultural solutions, particularly those that offer environmental benefits alongside productivity improvements. The country's well-developed infrastructure and strong research and development capabilities in agricultural technology continue to drive market growth.
Liquid Fertilizer Market in Ukraine
Ukraine demonstrates the highest growth potential in the European liquid fertilizer market, with an expected growth rate of approximately 7% during 2024-2029. The country's vast agricultural land and ongoing modernization of farming practices create significant opportunities for liquid fertilizer adoption. Ukrainian farmers are increasingly recognizing the benefits of liquid fertilizers in improving crop yields and nutrient use efficiency. The country's strategic focus on agricultural development and growing export orientation of its farming sector continue to drive market expansion.
Liquid Fertilizer Market in Middle East & Africa
The Middle East & Africa region presents unique opportunities in the liquid fertilizer market, driven by the need to optimize water usage and improve nutrient efficiency in challenging climatic conditions. The region's agricultural sector is undergoing significant transformation with the adoption of modern irrigation systems and precision farming techniques. Nigeria emerges as the largest market in the region, benefiting from its extensive agricultural land and government support for modern farming practices. Saudi Arabia shows the fastest growth potential, driven by its focus on advanced agricultural technologies and protected farming methods. The region's emphasis on food security and agricultural self-sufficiency continues to drive investment in efficient fertilization solutions.
Liquid Fertilizer Market in North America
North America represents a mature market for liquid fertilizers, characterized by high technology adoption and sophisticated farming practices. The United States leads the regional market as the largest consumer, while Mexico shows the highest growth potential. The region's strong focus on precision agriculture, extensive research and development activities, and well-established distribution networks support market growth. Canadian farmers are increasingly adopting liquid fertilizers as part of their sustainable agriculture practices, while Mexican agriculture is modernizing rapidly with government support for advanced farming technologies.
Liquid Fertilizer Market in South America
South America's liquid fertilizer market is experiencing significant growth, driven by the region's expanding agricultural sector and increasing adoption of modern farming practices. Brazil emerges as both the largest and fastest-growing market in the region, supported by its vast agricultural land and government initiatives promoting sustainable farming practices. Argentina's agricultural sector is also showing strong adoption of liquid fertilizers, particularly in its extensive field crop production. The region's focus on improving agricultural productivity and increasing export competitiveness continues to drive the adoption of efficient fertilization solutions.
Get Analysis on Important Geographic Markets
Download PDF
Liquid Fertilizer Industry Overview
Top Companies in Liquid Fertilizer Market
The liquid fertilizer companies market is characterized by continuous product innovation and strategic expansion initiatives by leading players. Companies are increasingly focusing on developing advanced formulations, including nanotechnology-based products and environmentally sustainable solutions, to meet evolving agricultural needs. Operational agility is demonstrated through investments in smart manufacturing facilities and digital platforms for customer relationship management. Strategic moves predominantly revolve around strengthening distribution networks, particularly in emerging markets, and establishing partnerships with local agricultural cooperatives. Market leaders are expanding their geographical presence through strategic acquisitions and joint ventures while simultaneously investing in research and development capabilities to enhance their product portfolios. The industry also witnesses a growing trend towards vertical integration, with companies establishing control over raw material sources and distribution channels.
Market Dominated by Global Agricultural Conglomerates
The liquid fertilizers market exhibits a moderately consolidated structure, with global agricultural conglomerates holding significant market share through their established brands and extensive distribution networks. These major players leverage their integrated operations, spanning from raw material procurement to end-product distribution, creating substantial entry barriers for new entrants. The market is characterized by a mix of multinational corporations and regional specialists, with the former dominating through their superior technological capabilities and broader product portfolios. The competitive landscape is further shaped by strategic alliances between major players and local distributors, enabling deeper market penetration and enhanced customer service capabilities.
The industry has witnessed significant merger and acquisition activity, primarily driven by larger players seeking to expand their geographical footprint and enhance their technological capabilities. These consolidation efforts are particularly prominent in emerging markets, where established companies are acquiring local players to gain market access and distribution networks. The trend towards consolidation is further accelerated by the need for economies of scale in production and distribution, as well as the increasing importance of research and development capabilities in maintaining competitive advantage. Regional players are increasingly becoming attractive acquisition targets for global companies looking to strengthen their presence in specific markets.
Innovation and Sustainability Drive Future Success
Success in the liquid fertilizers market increasingly depends on companies' ability to innovate while maintaining environmental sustainability. Market leaders are focusing on developing precision agriculture solutions and digital farming technologies to enhance product efficiency and reduce environmental impact. Companies are also investing in sustainable production processes and eco-friendly packaging solutions to align with growing environmental concerns. Building strong relationships with agricultural cooperatives and farming communities has become crucial for market success, as has the ability to provide comprehensive crop nutrition solutions rather than standalone products. The development of customized solutions for specific crops and regions is emerging as a key differentiator in the market.
For contenders looking to gain market share, focusing on niche markets and specialized applications presents a viable strategy. Success factors include developing innovative application technologies, establishing a strong local presence through partnerships, and investing in customer education and technical support. Companies must also navigate increasingly stringent environmental regulations while maintaining cost competitiveness. The ability to adapt to changing weather patterns and climate conditions through flexible product formulations is becoming increasingly important. Future success will largely depend on companies' ability to balance innovation with cost-effectiveness while maintaining strong distribution networks and customer relationships.
Liquid Fertilizer Market Leaders
-
Grupa Azoty S.A. (Compo Expert)
-
ICL Group Ltd
-
Indian Farmers Fertiliser Cooperative Limited
-
Sociedad Quimica y Minera de Chile SA
-
Yara International ASA
- *Disclaimer: Major Players sorted in no particular order

Need More Details on Market Players and Competitors?
Download PDF
Liquid Fertilizer Market News
- May 2022: ICL launched three new NPK formulations of Solinure, a product with increased trace elements to optimize yields.
- May 2022: ICL signed an agreement with customers in India and China to supply 600,000 and 700,000 metric tons of potash, respectively, in 2022 at USD 590 per ton.
- February 2022: ICL introduced lawn care fertilizers containing either urea coated with sulfur and a biodegradable polymer membrane (Poly-S) or resin-coated nitrogen combined with phosphorus and potash (PACE). These fertilizer avoids uncontrolled shock growth, which means less mowing effort, and are considered to be particularly easy and safe to use, and suitable for robotic lawnmowers.
Free With This Report
Along with the report, We also offer a comprehensive and exhaustive data pack with 25+ graphs on area under cultivation and average application rate per hectare. The data pack includes Globe, North America, Europe, Asia-Pacific, South America, and Africa.


Liquid Fertilizer Market Report - Table of Contents
1. EXECUTIVE SUMMARY & KEY FINDINGS
2. REPORT OFFERS
3. INTRODUCTION
- 3.1 Study Assumptions & Market Definition
- 3.2 Scope of the Study
- 3.3 Research Methodology
4. KEY INDUSTRY TRENDS
-
4.1 Acreage Of Major Crop Types
- 4.1.1 Field Crops
- 4.1.2 Horticultural Crops
-
4.2 Average Nutrient Application Rates
- 4.2.1 Micronutrients
- 4.2.1.1 Field Crops
- 4.2.1.2 Horticultural Crops
- 4.2.2 Primary Nutrients
- 4.2.2.1 Field Crops
- 4.2.2.2 Horticultural Crops
- 4.2.3 Secondary Macronutrients
- 4.2.3.1 Field Crops
- 4.2.3.2 Horticultural Crops
- 4.3 Agricultural Land Equipped For Irrigation
- 4.4 Regulatory Framework
- 4.5 Value Chain & Distribution Channel Analysis
5. MARKET SEGMENTATION (includes market size in Value in USD and Volume, Forecasts up to 2030 and analysis of growth prospects)
-
5.1 Type
- 5.1.1 Complex
- 5.1.2 Straight
- 5.1.2.1 By Nutrient
- 5.1.2.1.1 Micronutrients
- 5.1.2.1.2 Nitrogenous
- 5.1.2.1.3 Phosphatic
- 5.1.2.1.4 Potassic
- 5.1.2.1.5 Secondary Macronutrients
-
5.2 Application Mode
- 5.2.1 Fertigation
- 5.2.2 Foliar
-
5.3 Crop Type
- 5.3.1 Field Crops
- 5.3.2 Horticultural Crops
- 5.3.3 Turf & Ornamental
-
5.4 Region
- 5.4.1 Asia-Pacific
- 5.4.1.1 Australia
- 5.4.1.2 Bangladesh
- 5.4.1.3 China
- 5.4.1.4 India
- 5.4.1.5 Indonesia
- 5.4.1.6 Japan
- 5.4.1.7 Pakistan
- 5.4.1.8 Philippines
- 5.4.1.9 Thailand
- 5.4.1.10 Vietnam
- 5.4.1.11 Rest of Asia-Pacific
- 5.4.2 Europe
- 5.4.2.1 France
- 5.4.2.2 Germany
- 5.4.2.3 Italy
- 5.4.2.4 Netherlands
- 5.4.2.5 Russia
- 5.4.2.6 Spain
- 5.4.2.7 Ukraine
- 5.4.2.8 United Kingdom
- 5.4.2.9 Rest of Europe
- 5.4.3 Middle East & Africa
- 5.4.3.1 Nigeria
- 5.4.3.2 Saudi Arabia
- 5.4.3.3 South Africa
- 5.4.3.4 Turkey
- 5.4.3.5 Rest of Middle East & Africa
- 5.4.4 North America
- 5.4.4.1 Canada
- 5.4.4.2 Mexico
- 5.4.4.3 United States
- 5.4.4.4 Rest of North America
- 5.4.5 South America
- 5.4.5.1 Argentina
- 5.4.5.2 Brazil
- 5.4.5.3 Rest of South America
6. COMPETITIVE LANDSCAPE
- 6.1 Key Strategic Moves
- 6.2 Market Share Analysis
- 6.3 Company Landscape
-
6.4 Company Profiles
- 6.4.1 BMS Micro-Nutrients NV
- 6.4.2 Grupa Azoty S.A. (Compo Expert)
- 6.4.3 ICL Group Ltd
- 6.4.4 Indian Farmers Fertiliser Cooperative Limited
- 6.4.5 Nortox
- 6.4.6 Safsulphur
- 6.4.7 Sociedad Quimica y Minera de Chile SA
- 6.4.8 Yara International ASA
- *List Not Exhaustive
7. KEY STRATEGIC QUESTIONS FOR FERTILIZER CEOS
8. APPENDIX
-
8.1 Global Overview
- 8.1.1 Overview
- 8.1.2 Porter’s Five Forces Framework
- 8.1.3 Global Value Chain Analysis
- 8.1.4 Market Dynamics (DROs)
- 8.2 Sources & References
- 8.3 List of Tables & Figures
- 8.4 Primary Insights
- 8.5 Data Pack
- 8.6 Glossary of Terms
You Can Purchase Parts Of This Report. Check Out Prices For Specific Sections
Get Price Break-up Now
List of Tables & Figures
- Figure 1:
- CULTIVATION OF FIELD CROPS IN HECTARE, GLOBAL, 2017 - 2022
- Figure 2:
- CULTIVATION OF HORTICULTURAL CROPS IN HECTARE, GLOBAL, 2017 - 2022
- Figure 3:
- CONSUMPTION OF MICRONUTRIENTS BY FIELD CROPS IN KG/HECTARE, GLOBAL, 2022
- Figure 4:
- CONSUMPTION OF MICRONUTRIENTS BY HORTICULTURAL CROPS IN KG/HECTARE, GLOBAL, 2022
- Figure 5:
- CONSUMPTION OF PRIMARY NUTRIENTS BY FIELD CROPS IN KG/HECTARE, GLOBAL, 2022
- Figure 6:
- CONSUMPTION OF PRIMARY NUTRIENTS BY HORTICULTURAL CROPS IN KG/HECTARE, GLOBAL, 2022
- Figure 7:
- CONSUMPTION OF SECONDARY MACRONUTRIENTS BY FIELD CROPS IN KG/HECTARE, GLOBAL, 2022
- Figure 8:
- CONSUMPTION OF SECONDARY MACRONUTRIENTS BY HORTICULTURAL CROPS IN KG/HECTARE, GLOBAL, 2022
- Figure 9:
- AGRICULTURAL LAND EQUIPPED FOR IRRIGATION IN HECTARE, GLOBAL, 2022
- Figure 10:
- SPECIALITY FERTILIZER CONSUMPTION IN METRIC TON, GLOBAL, 2017 - 2030
- Figure 11:
- SPECIALITY FERTILIZER CONSUMPTION IN USD, GLOBAL, 2017 - 2030
- Figure 12:
- LIQUID FERTILIZER CONSUMPTION BY TYPE IN METRIC TON, GLOBAL, 2017 - 2030
- Figure 13:
- LIQUID FERTILIZER CONSUMPTION BY TYPE IN USD, GLOBAL, 2017 - 2030
- Figure 14:
- LIQUID FERTILIZER CONSUMPTION VOLUME BY TYPE IN %, GLOBAL, 2017 VS 2023 VS 2030
- Figure 15:
- LIQUID FERTILIZER CONSUMPTION VALUE BY TYPE IN %, GLOBAL, 2017 VS 2023 VS 2030
- Figure 16:
- COMPLEX LIQUID FERTILIZER CONSUMPTION IN METRIC TON, GLOBAL, 2017 - 2030
- Figure 17:
- COMPLEX LIQUID FERTILIZER CONSUMPTION IN USD, GLOBAL, 2017 - 2030
- Figure 18:
- COMPLEX FERTILIZER CONSUMPTION VALUE BY CROP TYPE IN %, GLOBAL, 2023 VS 2030
- Figure 19:
- LIQUID FERTILIZER CONSUMPTION BY NUTRIENT IN METRIC TON, GLOBAL, 2017 - 2030
- Figure 20:
- LIQUID FERTILIZER CONSUMPTION BY NUTRIENT IN USD, GLOBAL, 2017 - 2030
- Figure 21:
- LIQUID FERTILIZER FERTILIZER CONSUMPTION VOLUME BY NUTRIENT IN %, GLOBAL, 2017 VS 2023 VS 2030
- Figure 22:
- LIQUID FERTILIZER FERTILIZER CONSUMPTION VALUE BY NUTRIENT IN %, GLOBAL, 2017 VS 2023 VS 2030
- Figure 23:
- LIQUID MICRONUTRIENTS FERTILIZER CONSUMPTION IN METRIC TON, GLOBAL, 2017 - 2030
- Figure 24:
- LIQUID MICRONUTRIENTS FERTILIZER CONSUMPTION IN USD, GLOBAL, 2017 - 2030
- Figure 25:
- LIQUID MICRONUTRIENTS FERTILIZER CONSUMPTION VALUE BY CROP TYPE IN %, GLOBAL, 2023 VS 2030
- Figure 26:
- LIQUID NITROGENOUS FERTILIZER CONSUMPTION IN METRIC TON, GLOBAL, 2017 - 2030
- Figure 27:
- LIQUID NITROGENOUS FERTILIZER CONSUMPTION IN USD, GLOBAL, 2017 - 2030
- Figure 28:
- LIQUID NITROGENOUS FERTILIZER CONSUMPTION VALUE BY CROP TYPE IN %, GLOBAL, 2023 VS 2030
- Figure 29:
- LIQUID PHOSPHATIC FERTILIZER CONSUMPTION IN METRIC TON, GLOBAL, 2017 - 2030
- Figure 30:
- LIQUID PHOSPHATIC FERTILIZER CONSUMPTION IN USD, GLOBAL, 2017 - 2030
- Figure 31:
- LIQUID PHOSPHATIC FERTILIZER CONSUMPTION VALUE BY CROP TYPE IN %, GLOBAL, 2023 VS 2030
- Figure 32:
- LIQUID POTASSIC FERTILIZER CONSUMPTION IN METRIC TON, GLOBAL, 2017 - 2030
- Figure 33:
- LIQUID POTASSIC FERTILIZER CONSUMPTION IN USD, GLOBAL, 2017 - 2030
- Figure 34:
- LIQUID POTASSIC FERTILIZER CONSUMPTION VALUE BY CROP TYPE IN %, GLOBAL, 2023 VS 2030
- Figure 35:
- LIQUID SECONDARY MACRONUTRIENTS FERTILIZER CONSUMPTION IN METRIC TON, GLOBAL, 2017 - 2030
- Figure 36:
- LIQUID SECONDARY MACRONUTRIENTS FERTILIZER CONSUMPTION IN USD, GLOBAL, 2017 - 2030
- Figure 37:
- LIQUID SECONDARY MACRONUTRIENTS FERTILIZER CONSUMPTION VALUE BY CROP TYPE IN %, GLOBAL, 2023 VS 2030
- Figure 38:
- LIQUID FERTILIZER CONSUMPTION BY APPLICATION MODE IN METRIC TON, GLOBAL, 2017 - 2030
- Figure 39:
- LIQUID FERTILIZER CONSUMPTION BY APPLICATION MODE IN USD, GLOBAL, 2017 - 2030
- Figure 40:
- LIQUID FERTILIZER CONSUMPTION VOLUME BY APPLICATION MODE IN %, GLOBAL, 2017 VS 2023 VS 2030
- Figure 41:
- LIQUID FERTILIZER CONSUMPTION VALUE BY APPLICATION MODE IN %, GLOBAL, 2017 VS 2023 VS 2030
- Figure 42:
- FERTIGATION APPLICATION OF LIQUID FERTILIZER IN METRIC TON, GLOBAL, 2017 - 2030
- Figure 43:
- FERTIGATION APPLICATION OF LIQUID FERTILIZER IN USD, GLOBAL, 2017 - 2030
- Figure 44:
- FERTIGATION APPLICATION OF LIQUID FERTILIZER IN VALUE BY CROP TYPE IN %, GLOBAL, 2023 VS 2030
- Figure 45:
- FOLIAR APPLICATION OF LIQUID FERTILIZER IN METRIC TON, GLOBAL, 2017 - 2030
- Figure 46:
- FOLIAR APPLICATION OF LIQUID FERTILIZER IN USD, GLOBAL, 2017 - 2030
- Figure 47:
- FOLIAR APPLICATION OF LIQUID FERTILIZER IN VALUE BY CROP TYPE IN %, GLOBAL, 2023 VS 2030
- Figure 48:
- LIQUID FERTILIZER CONSUMPTION BY CROP TYPE IN METRIC TON, GLOBAL, 2017 - 2030
- Figure 49:
- LIQUID FERTILIZER CONSUMPTION BY CROP TYPE IN USD, GLOBAL, 2017 - 2030
- Figure 50:
- LIQUID FERTILIZER CONSUMPTION VOLUME BY CROP TYPE IN %, GLOBAL, 2017 VS 2023 VS 2030
- Figure 51:
- LIQUID FERTILIZER CONSUMPTION VALUE BY CROP TYPE IN %, GLOBAL, 2017 VS 2023 VS 2030
- Figure 52:
- LIQUID FERTILIZER CONSUMPTION BY FIELD CROPS IN METRIC TON, GLOBAL, 2017 - 2030
- Figure 53:
- LIQUID FERTILIZER CONSUMPTION BY FIELD CROPS IN USD, GLOBAL, 2017 - 2030
- Figure 54:
- LIQUID FERTILIZER CONSUMPTION VALUE BY NUTRIENT IN %, GLOBAL, 2023 VS 2030
- Figure 55:
- LIQUID FERTILIZER CONSUMPTION BY HORTICULTURAL CROPS IN METRIC TON, GLOBAL, 2017 - 2030
- Figure 56:
- LIQUID FERTILIZER CONSUMPTION BY HORTICULTURAL CROPS IN USD, GLOBAL, 2017 - 2030
- Figure 57:
- LIQUID FERTILIZER CONSUMPTION VALUE BY NUTRIENT IN %, GLOBAL, 2023 VS 2030
- Figure 58:
- LIQUID FERTILIZER CONSUMPTION BY TURF & ORNAMENTAL IN METRIC TON, GLOBAL, 2017 - 2030
- Figure 59:
- LIQUID FERTILIZER CONSUMPTION BY TURF & ORNAMENTAL IN USD, GLOBAL, 2017 - 2030
- Figure 60:
- LIQUID FERTILIZER CONSUMPTION VALUE BY NUTRIENT IN %, GLOBAL, 2023 VS 2030
- Figure 61:
- LIQUID FERTILIZER CONSUMPTION BY REGION IN METRIC TON, GLOBAL, 2017 - 2030
- Figure 62:
- LIQUID FERTILIZER CONSUMPTION BY REGION IN USD, GLOBAL, 2017 - 2030
- Figure 63:
- LIQUID FERTILIZER CONSUMPTION VOLUME BY REGION IN %, GLOBAL, 2017 VS 2023 VS 2030
- Figure 64:
- LIQUID FERTILIZER CONSUMPTION VALUE BY REGION IN %, GLOBAL, 2017 VS 2023 VS 2030
- Figure 65:
- LIQUID FERTILIZER CONSUMPTION BY COUNTRY IN METRIC TON, ASIA-PACIFIC, 2017 - 2030
- Figure 66:
- LIQUID FERTILIZER CONSUMPTION BY COUNTRY IN USD, ASIA-PACIFIC, 2017 - 2030
- Figure 67:
- LIQUID FERTILIZER CONSUMPTION VOLUME BY COUNTRY IN %, ASIA-PACIFIC, 2017 VS 2023 VS 2030
- Figure 68:
- LIQUID FERTILIZER CONSUMPTION VALUE BY COUNTRY IN %, ASIA-PACIFIC, 2017 VS 2023 VS 2030
- Figure 69:
- LIQUID FERTILIZER CONSUMPTION IN METRIC TON, AUSTRALIA, 2017 - 2030
- Figure 70:
- LIQUID FERTILIZER CONSUMPTION IN USD, AUSTRALIA, 2017 - 2030
- Figure 71:
- SPECIALITY FERTILIZER CONSUMPTION VALUE BY CROP TYPE IN %, AUSTRALIA, 2023 VS 2030
- Figure 72:
- LIQUID FERTILIZER CONSUMPTION IN METRIC TON, BANGLADESH, 2017 - 2030
- Figure 73:
- LIQUID FERTILIZER CONSUMPTION IN USD, BANGLADESH, 2017 - 2030
- Figure 74:
- SPECIALITY FERTILIZER CONSUMPTION VALUE BY CROP TYPE IN %, BANGLADESH, 2023 VS 2030
- Figure 75:
- LIQUID FERTILIZER CONSUMPTION IN METRIC TON, CHINA, 2017 - 2030
- Figure 76:
- LIQUID FERTILIZER CONSUMPTION IN USD, CHINA, 2017 - 2030
- Figure 77:
- SPECIALITY FERTILIZER CONSUMPTION VALUE BY CROP TYPE IN %, CHINA, 2023 VS 2030
- Figure 78:
- LIQUID FERTILIZER CONSUMPTION IN METRIC TON, INDIA, 2017 - 2030
- Figure 79:
- LIQUID FERTILIZER CONSUMPTION IN USD, INDIA, 2017 - 2030
- Figure 80:
- SPECIALITY FERTILIZER CONSUMPTION VALUE BY CROP TYPE IN %, INDIA, 2023 VS 2030
- Figure 81:
- LIQUID FERTILIZER CONSUMPTION IN METRIC TON, INDONESIA, 2017 - 2030
- Figure 82:
- LIQUID FERTILIZER CONSUMPTION IN USD, INDONESIA, 2017 - 2030
- Figure 83:
- SPECIALITY FERTILIZER CONSUMPTION VALUE BY CROP TYPE IN %, INDONESIA, 2023 VS 2030
- Figure 84:
- LIQUID FERTILIZER CONSUMPTION IN METRIC TON, JAPAN, 2017 - 2030
- Figure 85:
- LIQUID FERTILIZER CONSUMPTION IN USD, JAPAN, 2017 - 2030
- Figure 86:
- SPECIALITY FERTILIZER CONSUMPTION VALUE BY CROP TYPE IN %, JAPAN, 2023 VS 2030
- Figure 87:
- LIQUID FERTILIZER CONSUMPTION IN METRIC TON, PAKISTAN, 2017 - 2030
- Figure 88:
- LIQUID FERTILIZER CONSUMPTION IN USD, PAKISTAN, 2017 - 2030
- Figure 89:
- SPECIALITY FERTILIZER CONSUMPTION VALUE BY CROP TYPE IN %, PAKISTAN, 2023 VS 2030
- Figure 90:
- LIQUID FERTILIZER CONSUMPTION IN METRIC TON, PHILIPPINES, 2017 - 2030
- Figure 91:
- LIQUID FERTILIZER CONSUMPTION IN USD, PHILIPPINES, 2017 - 2030
- Figure 92:
- SPECIALITY FERTILIZER CONSUMPTION VALUE BY CROP TYPE IN %, PHILIPPINES, 2023 VS 2030
- Figure 93:
- LIQUID FERTILIZER CONSUMPTION IN METRIC TON, THAILAND, 2017 - 2030
- Figure 94:
- LIQUID FERTILIZER CONSUMPTION IN USD, THAILAND, 2017 - 2030
- Figure 95:
- SPECIALITY FERTILIZER CONSUMPTION VALUE BY CROP TYPE IN %, THAILAND, 2023 VS 2030
- Figure 96:
- LIQUID FERTILIZER CONSUMPTION IN METRIC TON, VIETNAM, 2017 - 2030
- Figure 97:
- LIQUID FERTILIZER CONSUMPTION IN USD, VIETNAM, 2017 - 2030
- Figure 98:
- SPECIALITY FERTILIZER CONSUMPTION VALUE BY CROP TYPE IN %, VIETNAM, 2023 VS 2030
- Figure 99:
- LIQUID FERTILIZER CONSUMPTION IN METRIC TON, REST OF ASIA-PACIFIC, 2017 - 2030
- Figure 100:
- LIQUID FERTILIZER CONSUMPTION IN USD, REST OF ASIA-PACIFIC, 2017 - 2030
- Figure 101:
- SPECIALITY FERTILIZER CONSUMPTION VALUE BY CROP TYPE IN %, REST OF ASIA-PACIFIC, 2023 VS 2030
- Figure 102:
- LIQUID FERTILIZER CONSUMPTION BY COUNTRY IN METRIC TON, EUROPE, 2017 - 2030
- Figure 103:
- LIQUID FERTILIZER CONSUMPTION BY COUNTRY IN USD, EUROPE, 2017 - 2030
- Figure 104:
- LIQUID FERTILIZER CONSUMPTION VOLUME BY COUNTRY IN %, EUROPE, 2017 VS 2023 VS 2030
- Figure 105:
- LIQUID FERTILIZER CONSUMPTION VALUE BY COUNTRY IN %, EUROPE, 2017 VS 2023 VS 2030
- Figure 106:
- LIQUID FERTILIZER CONSUMPTION IN METRIC TON, FRANCE, 2017 - 2030
- Figure 107:
- LIQUID FERTILIZER CONSUMPTION IN USD, FRANCE, 2017 - 2030
- Figure 108:
- SPECIALITY FERTILIZER CONSUMPTION VALUE BY CROP TYPE IN %, FRANCE, 2023 VS 2030
- Figure 109:
- LIQUID FERTILIZER CONSUMPTION IN METRIC TON, GERMANY, 2017 - 2030
- Figure 110:
- LIQUID FERTILIZER CONSUMPTION IN USD, GERMANY, 2017 - 2030
- Figure 111:
- SPECIALITY FERTILIZER CONSUMPTION VALUE BY CROP TYPE IN %, GERMANY, 2023 VS 2030
- Figure 112:
- LIQUID FERTILIZER CONSUMPTION IN METRIC TON, ITALY, 2017 - 2030
- Figure 113:
- LIQUID FERTILIZER CONSUMPTION IN USD, ITALY, 2017 - 2030
- Figure 114:
- SPECIALITY FERTILIZER CONSUMPTION VALUE BY CROP TYPE IN %, ITALY, 2023 VS 2030
- Figure 115:
- LIQUID FERTILIZER CONSUMPTION IN METRIC TON, NETHERLANDS, 2017 - 2030
- Figure 116:
- LIQUID FERTILIZER CONSUMPTION IN USD, NETHERLANDS, 2017 - 2030
- Figure 117:
- SPECIALITY FERTILIZER CONSUMPTION VALUE BY CROP TYPE IN %, NETHERLANDS, 2023 VS 2030
- Figure 118:
- LIQUID FERTILIZER CONSUMPTION IN METRIC TON, RUSSIA, 2017 - 2030
- Figure 119:
- LIQUID FERTILIZER CONSUMPTION IN USD, RUSSIA, 2017 - 2030
- Figure 120:
- SPECIALITY FERTILIZER CONSUMPTION VALUE BY CROP TYPE IN %, RUSSIA, 2023 VS 2030
- Figure 121:
- LIQUID FERTILIZER CONSUMPTION IN METRIC TON, SPAIN, 2017 - 2030
- Figure 122:
- LIQUID FERTILIZER CONSUMPTION IN USD, SPAIN, 2017 - 2030
- Figure 123:
- SPECIALITY FERTILIZER CONSUMPTION VALUE BY CROP TYPE IN %, SPAIN, 2023 VS 2030
- Figure 124:
- LIQUID FERTILIZER CONSUMPTION IN METRIC TON, UKRAINE, 2017 - 2030
- Figure 125:
- LIQUID FERTILIZER CONSUMPTION IN USD, UKRAINE, 2017 - 2030
- Figure 126:
- SPECIALITY FERTILIZER CONSUMPTION VALUE BY CROP TYPE IN %, UKRAINE, 2023 VS 2030
- Figure 127:
- LIQUID FERTILIZER CONSUMPTION IN METRIC TON, UNITED KINGDOM, 2017 - 2030
- Figure 128:
- LIQUID FERTILIZER CONSUMPTION IN USD, UNITED KINGDOM, 2017 - 2030
- Figure 129:
- SPECIALITY FERTILIZER CONSUMPTION VALUE BY CROP TYPE IN %, UNITED KINGDOM, 2023 VS 2030
- Figure 130:
- LIQUID FERTILIZER CONSUMPTION IN METRIC TON, REST OF EUROPE, 2017 - 2030
- Figure 131:
- LIQUID FERTILIZER CONSUMPTION IN USD, REST OF EUROPE, 2017 - 2030
- Figure 132:
- SPECIALITY FERTILIZER CONSUMPTION VALUE BY CROP TYPE IN %, REST OF EUROPE, 2023 VS 2030
- Figure 133:
- LIQUID FERTILIZER CONSUMPTION BY COUNTRY IN METRIC TON, MIDDLE EAST & AFRICA, 2017 - 2030
- Figure 134:
- LIQUID FERTILIZER CONSUMPTION BY COUNTRY IN USD, MIDDLE EAST & AFRICA, 2017 - 2030
- Figure 135:
- LIQUID FERTILIZER CONSUMPTION VOLUME BY COUNTRY IN %, MIDDLE EAST & AFRICA, 2017 VS 2023 VS 2030
- Figure 136:
- LIQUID FERTILIZER CONSUMPTION VALUE BY COUNTRY IN %, MIDDLE EAST & AFRICA, 2017 VS 2023 VS 2030
- Figure 137:
- LIQUID FERTILIZER CONSUMPTION IN METRIC TON, NIGERIA, 2017 - 2030
- Figure 138:
- LIQUID FERTILIZER CONSUMPTION IN USD, NIGERIA, 2017 - 2030
- Figure 139:
- SPECIALITY FERTILIZER CONSUMPTION VALUE BY CROP TYPE IN %, NIGERIA, 2023 VS 2030
- Figure 140:
- LIQUID FERTILIZER CONSUMPTION IN METRIC TON, SAUDI ARABIA, 2017 - 2030
- Figure 141:
- LIQUID FERTILIZER CONSUMPTION IN USD, SAUDI ARABIA, 2017 - 2030
- Figure 142:
- SPECIALITY FERTILIZER CONSUMPTION VALUE BY CROP TYPE IN %, SAUDI ARABIA, 2023 VS 2030
- Figure 143:
- LIQUID FERTILIZER CONSUMPTION IN METRIC TON, SOUTH AFRICA, 2017 - 2030
- Figure 144:
- LIQUID FERTILIZER CONSUMPTION IN USD, SOUTH AFRICA, 2017 - 2030
- Figure 145:
- SPECIALITY FERTILIZER CONSUMPTION VALUE BY CROP TYPE IN %, SOUTH AFRICA, 2023 VS 2030
- Figure 146:
- LIQUID FERTILIZER CONSUMPTION IN METRIC TON, TURKEY, 2017 - 2030
- Figure 147:
- LIQUID FERTILIZER CONSUMPTION IN USD, TURKEY, 2017 - 2030
- Figure 148:
- SPECIALITY FERTILIZER CONSUMPTION VALUE BY CROP TYPE IN %, TURKEY, 2023 VS 2030
- Figure 149:
- LIQUID FERTILIZER CONSUMPTION IN METRIC TON, REST OF MIDDLE EAST & AFRICA, 2017 - 2030
- Figure 150:
- LIQUID FERTILIZER CONSUMPTION IN USD, REST OF MIDDLE EAST & AFRICA, 2017 - 2030
- Figure 151:
- SPECIALITY FERTILIZER CONSUMPTION VALUE BY CROP TYPE IN %, REST OF MIDDLE EAST & AFRICA, 2023 VS 2030
- Figure 152:
- LIQUID FERTILIZER CONSUMPTION BY COUNTRY IN METRIC TON, NORTH AMERICA, 2017 - 2030
- Figure 153:
- LIQUID FERTILIZER CONSUMPTION BY COUNTRY IN USD, NORTH AMERICA, 2017 - 2030
- Figure 154:
- LIQUID FERTILIZER CONSUMPTION VOLUME BY COUNTRY IN %, NORTH AMERICA, 2017 VS 2023 VS 2030
- Figure 155:
- LIQUID FERTILIZER CONSUMPTION VALUE BY COUNTRY IN %, NORTH AMERICA, 2017 VS 2023 VS 2030
- Figure 156:
- LIQUID FERTILIZER CONSUMPTION IN METRIC TON, CANADA, 2017 - 2030
- Figure 157:
- LIQUID FERTILIZER CONSUMPTION IN USD, CANADA, 2017 - 2030
- Figure 158:
- SPECIALITY FERTILIZER CONSUMPTION VALUE BY CROP TYPE IN %, CANADA, 2023 VS 2030
- Figure 159:
- LIQUID FERTILIZER CONSUMPTION IN METRIC TON, MEXICO, 2017 - 2030
- Figure 160:
- LIQUID FERTILIZER CONSUMPTION IN USD, MEXICO, 2017 - 2030
- Figure 161:
- SPECIALITY FERTILIZER CONSUMPTION VALUE BY CROP TYPE IN %, MEXICO, 2023 VS 2030
- Figure 162:
- LIQUID FERTILIZER CONSUMPTION IN METRIC TON, UNITED STATES, 2017 - 2030
- Figure 163:
- LIQUID FERTILIZER CONSUMPTION IN USD, UNITED STATES, 2017 - 2030
- Figure 164:
- SPECIALITY FERTILIZER CONSUMPTION VALUE BY CROP TYPE IN %, UNITED STATES, 2023 VS 2030
- Figure 165:
- LIQUID FERTILIZER CONSUMPTION IN METRIC TON, REST OF NORTH AMERICA, 2017 - 2030
- Figure 166:
- LIQUID FERTILIZER CONSUMPTION IN USD, REST OF NORTH AMERICA, 2017 - 2030
- Figure 167:
- SPECIALITY FERTILIZER CONSUMPTION VALUE BY CROP TYPE IN %, REST OF NORTH AMERICA, 2023 VS 2030
- Figure 168:
- LIQUID FERTILIZER CONSUMPTION BY COUNTRY IN METRIC TON, SOUTH AMERICA, 2017 - 2030
- Figure 169:
- LIQUID FERTILIZER CONSUMPTION BY COUNTRY IN USD, SOUTH AMERICA, 2017 - 2030
- Figure 170:
- LIQUID FERTILIZER CONSUMPTION VOLUME BY COUNTRY IN %, SOUTH AMERICA, 2017 VS 2023 VS 2030
- Figure 171:
- LIQUID FERTILIZER CONSUMPTION VALUE BY COUNTRY IN %, SOUTH AMERICA, 2017 VS 2023 VS 2030
- Figure 172:
- LIQUID FERTILIZER CONSUMPTION IN METRIC TON, ARGENTINA, 2017 - 2030
- Figure 173:
- LIQUID FERTILIZER CONSUMPTION IN USD, ARGENTINA, 2017 - 2030
- Figure 174:
- SPECIALITY FERTILIZER CONSUMPTION VALUE BY CROP TYPE IN %, ARGENTINA, 2023 VS 2030
- Figure 175:
- LIQUID FERTILIZER CONSUMPTION IN METRIC TON, BRAZIL, 2017 - 2030
- Figure 176:
- LIQUID FERTILIZER CONSUMPTION IN USD, BRAZIL, 2017 - 2030
- Figure 177:
- SPECIALITY FERTILIZER CONSUMPTION VALUE BY CROP TYPE IN %, BRAZIL, 2023 VS 2030
- Figure 178:
- LIQUID FERTILIZER CONSUMPTION IN METRIC TON, REST OF SOUTH AMERICA, 2017 - 2030
- Figure 179:
- LIQUID FERTILIZER CONSUMPTION IN USD, REST OF SOUTH AMERICA, 2017 - 2030
- Figure 180:
- SPECIALITY FERTILIZER CONSUMPTION VALUE BY CROP TYPE IN %, REST OF SOUTH AMERICA, 2023 VS 2030
- Figure 181:
- MOST ACTIVE COMPANIES BY NUMBER OF STRATEGIC MOVES, GLOBAL, 2017 - 2030
- Figure 182:
- GLOBAL LIQUID FERTILIZER MARKET, MOST ADOPTED STRATEGIES, 2018 - 2021
- Figure 183:
- MARKET SHARE OF MAJOR PLAYERS IN %, GLOBAL
Liquid Fertilizer Industry Segmentation
Complex, Straight are covered as segments by Type. Fertigation, Foliar are covered as segments by Application Mode. Field Crops, Horticultural Crops, Turf & Ornamental are covered as segments by Crop Type. Asia-Pacific, Europe, Middle East & Africa, North America, South America are covered as segments by Region.| Type | Complex | |||
| Straight | By Nutrient | Micronutrients | ||
| Nitrogenous | ||||
| Phosphatic | ||||
| Potassic | ||||
| Secondary Macronutrients | ||||
| Application Mode | Fertigation | |||
| Foliar | ||||
| Crop Type | Field Crops | |||
| Horticultural Crops | ||||
| Turf & Ornamental | ||||
| Region | Asia-Pacific | Australia | ||
| Bangladesh | ||||
| China | ||||
| India | ||||
| Indonesia | ||||
| Japan | ||||
| Pakistan | ||||
| Philippines | ||||
| Thailand | ||||
| Vietnam | ||||
| Rest of Asia-Pacific | ||||
| Europe | France | |||
| Germany | ||||
| Italy | ||||
| Netherlands | ||||
| Russia | ||||
| Spain | ||||
| Ukraine | ||||
| United Kingdom | ||||
| Rest of Europe | ||||
| Middle East & Africa | Nigeria | |||
| Saudi Arabia | ||||
| South Africa | ||||
| Turkey | ||||
| Rest of Middle East & Africa | ||||
| North America | Canada | |||
| Mexico | ||||
| United States | ||||
| Rest of North America | ||||
| South America | Argentina | |||
| Brazil | ||||
| Rest of South America | ||||
Need A Different Region or Segment?
Customize Now
Market Definition
- MARKET ESTIMATION LEVEL - Market Estimations for various types of fertilizers has been done at the product-level and not at the nutrient-level.
- NUTRIENT TYPES COVERED - Primary Nutrients: N, P and K, Secondary Macronutrients: Ca, Mg and S, Micronutients: Zn, Mn, Cu, Fe, Mo, B, and Others
- AVERAGE NUTRIENT APPLICATION RATE - This refers to the average volume of nutrient consumed per hectare of farmland in each country.
- CROP TYPES COVERED - Field Crops: Cereals, Pulses, Oilseeds, and Fiber Crops Horticulture: Fruits, Vegetables, Plantation Crops and Spices, Turf Grass and Ornamentals
| Keyword | Definition |
|---|---|
| Fertilizer | Chemical substance applied to crops to ensure nutritional requirements, available in various forms such as granules, powders, liquid, water soluble, etc. |
| Specialty Fertilizer | Used for enhanced efficiency and nutrient availability applied through soil, foliar, and fertigation. Includes CRF, SRF, liquid fertilizer, and water soluble fertilizers. |
| Controlled-Release Fertilizers (CRF) | Coated with materials such as polymer, polymer-sulfur, and other materials such as resins to ensure nutrient availability to the crop for its entire life cycle. |
| Slow-Release Fertilizers (SRF) | Coated with materials such as sulfur, neem, etc., to ensure nutrient availability to the crop for a longer period. |
| Foliar Fertilizers | Consist of both liquid and water soluble fertilizers applied through foliar application. |
| Water-Soluble Fertilizers | Available in various forms including liquid, powder, etc., used in foliar and fertigation mode of fertilizer application. |
| Fertigation | Fertilizers applied through different irrigation systems such as drip irrigation, micro irrigation, sprinkler irrigation, etc. |
| Anhydrous Ammonia | Used as fertilizer, directly injected into the soil, available in gaseous liquid form. |
| Single Super Phosphate (SSP) | Phosphorus fertilizer containing only phosphorus which has lesser than or equal to 35%. |
| Triple Super Phosphate (TSP) | Phosphorus fertilizer containing only phosphorus greater than 35%. |
| Enhanced Efficiency Fertilizers | Fertilizers coated or treated with additional layers of various ingredients to make it more efficient compared to other fertilizers. |
| Conventional Fertilizer | Fertilizers applied to crops through traditional methods including broadcasting, row placement, ploughing soil placement, etc. |
| Chelated Micronutrients | Micronutrient fertilizers coated with chelating agents such as EDTA, EDDHA, DTPA, HEDTA, etc. |
| Liquid Fertilizers | Available in liquid form, majorly used for application of fertilizers to crops through foliar and fertigation. |
Need More Details on Market Definition?
Ask a Question
Research Methodology
Mordor Intelligence follows a four-step methodology in all our reports.
- Step-1: IDENTIFY KEY VARIABLES: In order to build a robust forecasting methodology, the variables and factors identified in Step-1 are tested against available historical market numbers. Through an iterative process, the variables required for market forecast are set and the model is built on the basis of these variables.
- Step-2: Build a Market Model: Market-size estimations for the forecast years are in nominal terms. Inflation is not a part of the pricing, and the average selling price (ASP) is kept constant throughout the forecast period for each country.
- Step-3: Validate and Finalize: In this important step, all market numbers, variables and analyst calls are validated through an extensive network of primary research experts from the market studied. The respondents are selected across levels and functions to generate a holistic picture of the market studied.
- Step-4: Research Outputs: Syndicated Reports, Custom Consulting Assignments, Databases & Subscription Platforms

Get More Details On Research Methodology
Download PDF


