Leukemia Therapeutics Market Size and Share
Market Overview
| Study Period | 2020 - 2030 |
|---|---|
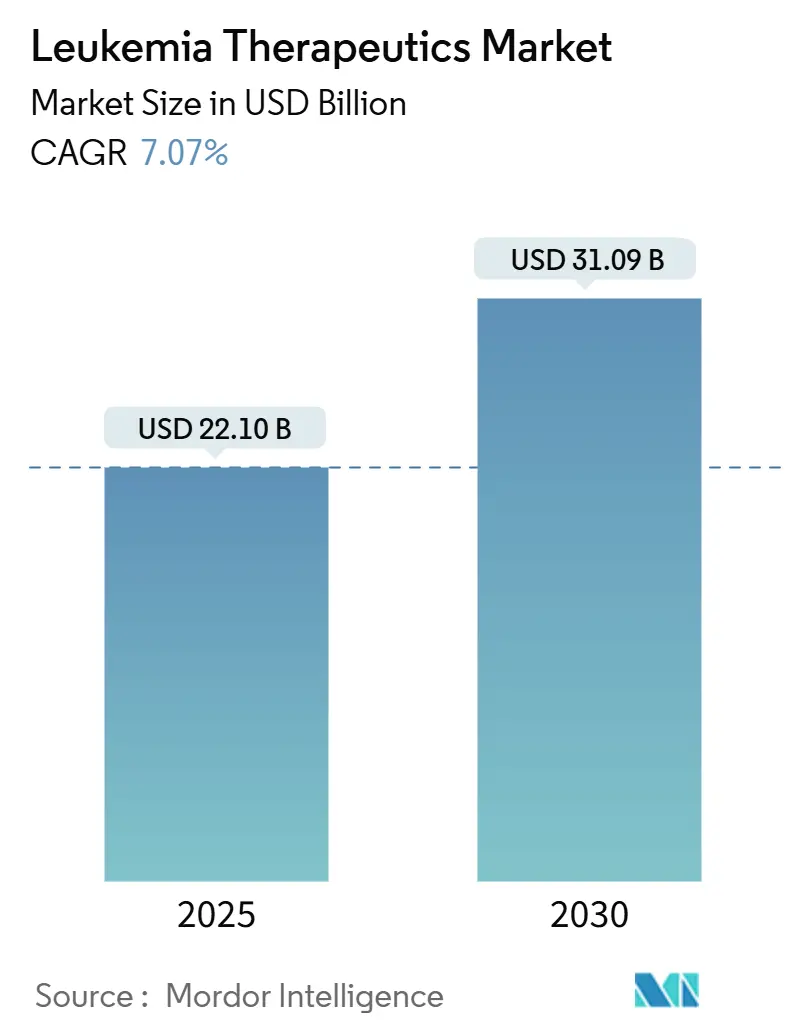
| Market Size (2025) | USD 22.10 Billion |
| Market Size (2030) | USD 31.09 Billion |
| Growth Rate (2025 - 2030) | 7.07% CAGR |
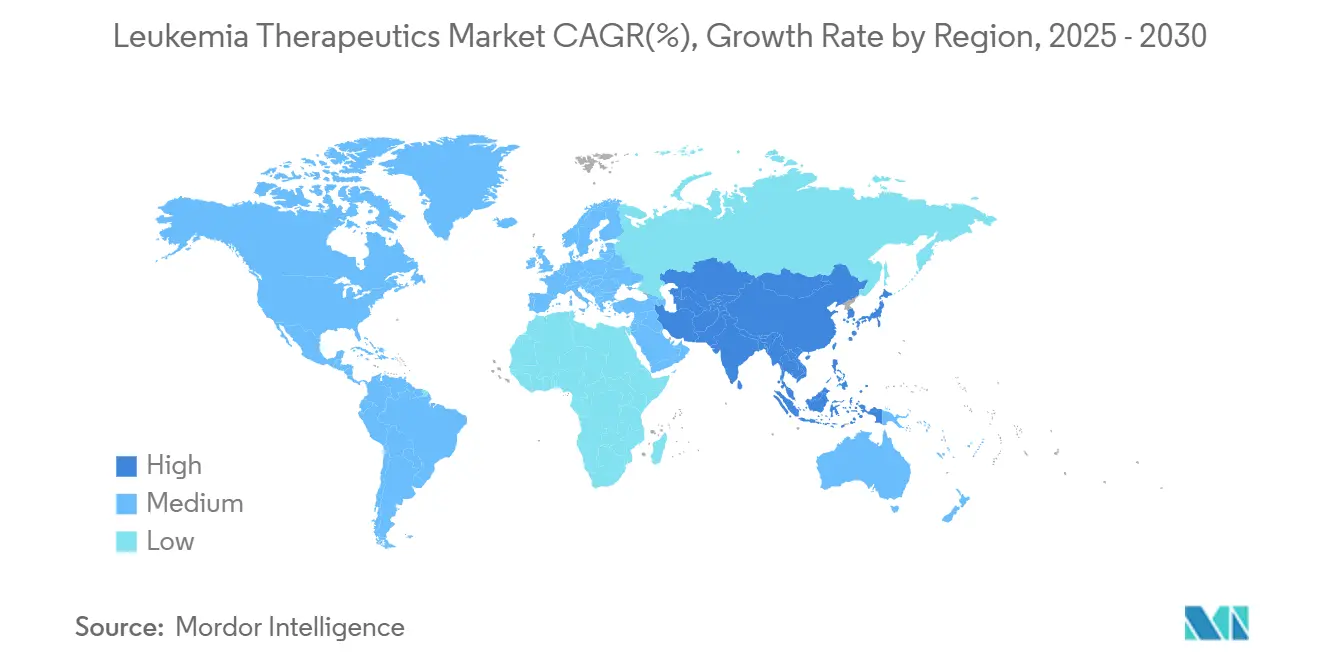
| Fastest Growing Market | Asia-Pacific |
| Largest Market | North America |
| Market Concentration | Medium |
Major Players*Disclaimer: Major Players sorted in no particular order Image © Mordor Intelligence. Reuse requires attribution under CC BY 4.0. |
|
Leukemia Therapeutics Market Analysis by Mordor Intelligence
The leukemia therapeutics market generated USD 22.10 billion in 2025 and is on course to reach USD 31.09 billion by 2030, reflecting a 7.07% CAGR. Growth is propelled by first-in-class immunotherapies such as the FDA-cleared menin inhibitor revumenib and an expanding roster of CAR-T products that repeatedly show deeper and more durable remissions than legacy regimens.[1]U.S. Food & Drug Administration, “FDA approves revumenib for relapsed or refractory acute leukemia with a KMT2A translocation,” fda.govCompetitive intensity is rising as large pharmaceutical groups accelerate pipeline acquisitions and co-development deals to secure next-generation assets, while regional players in Asia develop price-disruptive CAR-T offerings that are one-tenth the cost of Western brands. Menin inhibitors, BTK antagonists and bispecific antibodies are widening therapeutic choice, while AI-driven drug repurposing and early genetic profiling are shrinking the time from discovery to first-in-human trials. Persistent supply-chain gaps for viral vectors and stringent reimbursement reviews temper the pace of adoption but have not derailed overall demand.
Key Report Takeaways
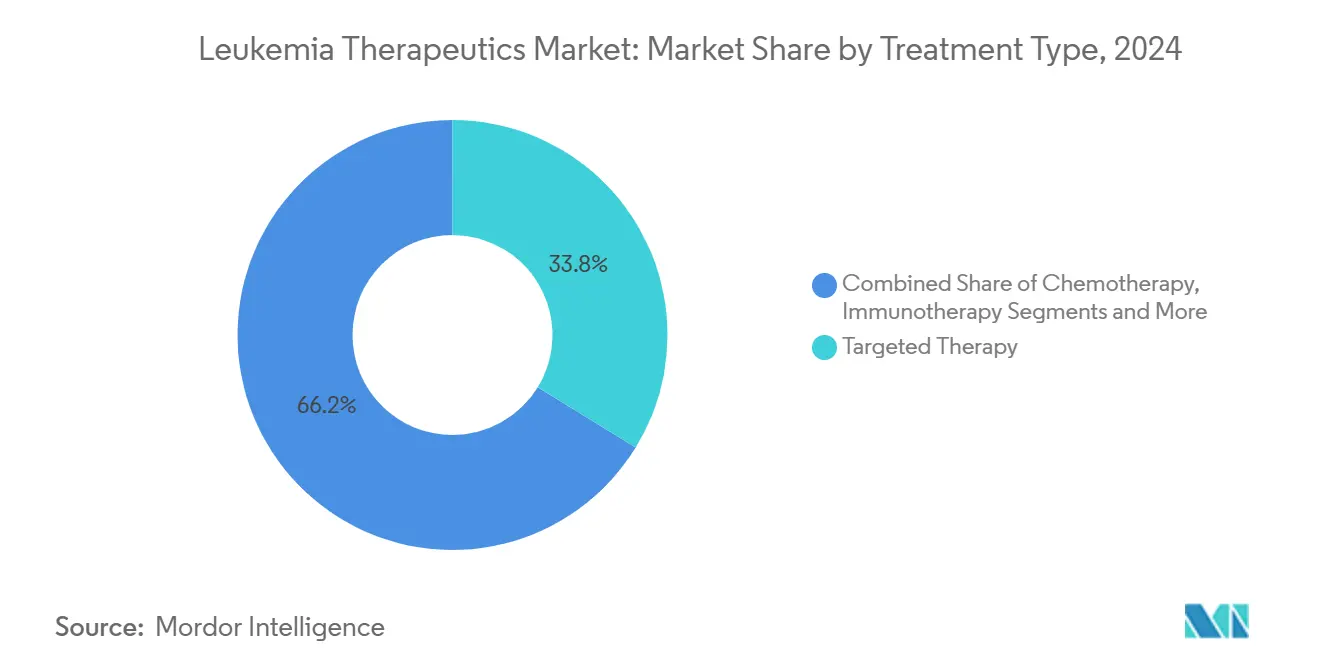
- By treatment type, targeted therapy accounted for 33.76% of the leukemia therapeutics market share in 2024, whereas CAR-T cell therapy is forecasted to grow at a 17.14% CAGR through 2030.
- By leukemia type, chronic lymphocytic leukemia led the leukemia therapeutics market with a 24.56% share of the market size in 2024, while acute lymphoblastic leukemia is expanding at a 10.36% CAGR.
- By therapeutic modality, small-molecule drugs accounted for 34.56% of the leukemia therapeutics market size in 2024; gene therapies are projected to advance at 11.34% CAGR.
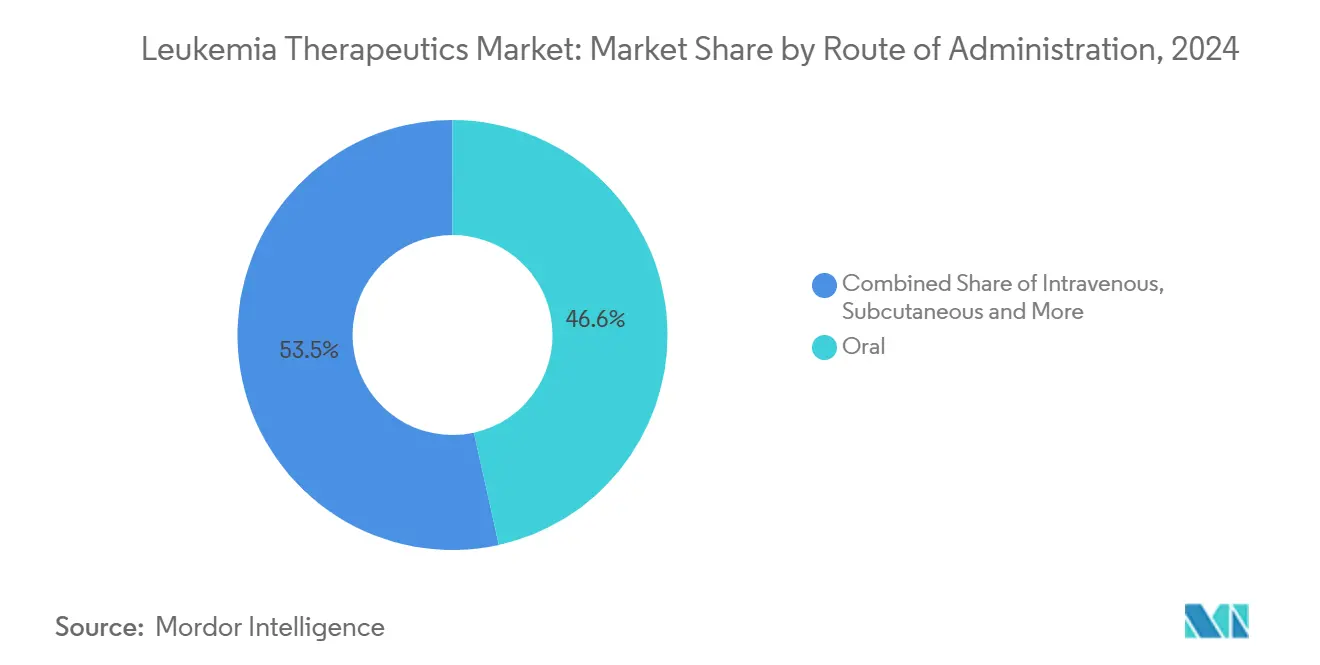
- By route of administration, oral formulations held 46.55% share of the leukemia therapeutics market size in 2024; intravenous delivery is projected to rise at 11.75% CAGR.
- By age group, adult patients accounted for 65.34% of the leukemia therapeutics market size in 2024, while the pediatric segment recorded the fastest growth rate of 10.21% CAGR.
- North America retained 43.66% leukemia therapeutics market share in 2024; Asia-Pacific exhibits the highest 9.56% regional CAGR.
Global Leukemia Therapeutics Market Trends and Insights
Drivers Impact Analysis
| Driver | (~) % Impact on CAGR Forecast | Geographic Relevance | Impact Timeline |
|---|---|---|---|
| Rising burden of leukemia | +1.2% | Global, highest in aging North America & Europe | Long term (≥ 4 years) |
| Advancement in targeted & immunotherapies | +2.1% | Global, led by North America & EU approvals | Medium term (2-4 years) |
| Enhanced early detection & patient awareness | +0.8% | Developed markets expanding to APAC | Medium term (2-4 years) |
| Strategic collaboration and R&D investment | +1.5% | Global, biotech hubs | Short term (≤ 2 years) |
| Adoption of combinational therapy regimens | +0.9% | North America & EU, APAC follows | Medium term (2-4 years) |
| AI-driven drug repurposing accelerates pipeline | +0.7% | Technology-advanced markets | Long term (≥ 4 years) |
| Source: Mordor Intelligence | |||
Rising Burden of Leukemia
Global incidence continues to climb, with China alone reporting 531,000 patients in 2024—an increase of 12% over 2010—while mortality has edged down 5% thanks to broader therapy access. Demographic aging in high-income countries and improved diagnostic reach in emerging economies sustain a steady flow of new patients. The larger treatment-eligible population drives investment in precision drugs that offer chronic management as well as curative intent, ultimately cementing a stable demand base for the leukemia therapeutics market.
Advancement in Targeted & Immunotherapies
Menin inhibitors inaugurate a new drug class, highlighted by revumenib’s 21% complete remission in KMT2A-rearranged disease. Simultaneously, CAR-T regimens combined with blinatumomab deliver 96% disease-free survival in pediatric acute lymphoblastic leukemia versus 88% for chemotherapy.[2]Mignon L. Loh, “Blinatumomab in Standard-Risk B-Cell Acute Lymphoblastic Leukemia in Children,” New England Journal of Medicine, nejm.orgThese gains press competitors to shorten innovation cycles, reinforcing double-digit R&D outlays and spurring fresh licensing activity that enlarges the leukemia therapeutics market.
Enhanced Early Detection & Patient Awareness
Chromosomal profiling and liquid biopsies are now routine across leading centers. BeiGene’s Test Before Treat program boosts genetic screening uptake in chronic lymphocytic leukemia, accelerating selection of optimal regimens. Earlier intervention reduces downstream hospitalization costs and improves overall survival, reinforcing payer willingness to reimburse high-value precision drugs.
Strategic Collaboration and R&D Investment
Pipeline complexity prompts companies to co-develop assets and share manufacturing expertise. AstraZeneca’s USD 245 million equity entry into Cellectis secures advanced gene-editing platforms, while Kura Oncology’s USD 1.2 billion alliance with Kyowa Kirin accelerates ziftomenib’s global reach. Such deals de-risk late-stage programs and speed trial execution, enlarging the addressable leukemia therapeutics market.
Restraints Impact Analysis
| Restraint | (~) % Impact on CAGR Forecast | Geographic Relevance | Impact Timeline |
|---|---|---|---|
| High cost of novel therapeutics | -1.8% | Global, most severe in emerging markets | Short term (≤ 2 years) |
| Stringent regulatory & reimbursement hurdles | -1.1% | Global, framework-dependent | Medium term (2-4 years) |
| Manufacturing bottlenecks for viral vectors & cell therapies | -0.9% | Global, specialized facilities | Short term (≤ 2 years) |
| Cold-chain logistics limit access in LMICs | -0.6% | Emerging markets, rural areas | Long term (≥ 4 years) |
| Source: Mordor Intelligence | |||
High Cost of Novel Therapeutics
Autologous CAR-T treatments list at USD 300,000-600,000 in the United States, placing significant strain on payer budgets and limiting uptake in low-income regions. Indian manufacturers have cut pricing to USD 30,000-50,000 through localized production, yet global parity remains distant. Elevated costs hinder immediate universal adoption, softening near-term expansion of the leukemia therapeutics market.
Manufacturing Bottlenecks for Viral Vectors & Cell Therapies
Only 63% of academic centers surveyed maintain active CAR-T production lines, and the typical 3-5-week vein-to-vein window forces bridging regimens that raise costs and may erode clinical outcomes. The scarcity of GMP-grade viral vectors adds delays, constraining real-world therapy volumes and moderating growth.
Segment Analysis
By Treatment Type: CAR-T Drives Innovation Leadership
Targeted therapy retained a 33.76% slice of the leukemia therapeutics market in 2024, anchored by BTK and menin inhibitors. CAR-T cell therapy, although still smaller in absolute terms, is projected to accelerate at a 17.14% CAGR to 2030, driven by label expansions and enhanced safety management. This trajectory reflects a gradual pivot away from broad-spectrum chemotherapy, creating fertile ground for combination trials that mix CAR-T with bispecifics or checkpoint inhibitors. Heightened demand for viral vectors and lymphodepletion agents accompanies this shift, cascading growth to suppliers across the leukemia therapeutics market.
Breakthroughs in conditioning regimens also strengthen stem-cell transplantation. The treosulfan-fludarabine pairing received FDA endorsement in early 2025 after demonstrating superior overall survival compared to busulfan-based regimens. Parallel advances in gene editing equip next-generation CAR-T constructs with dual-targeting capacity, promising broader efficacy and reduced relapse risk. Collectively, these dynamics cement CAR-T leadership for the second half of the decade.
Note: Segment shares of all individual segments available upon report purchase


By Leukemia Type: Acute Forms Drive Growth
Chronic lymphocytic leukemia (CLL) accounted for 24.56% of the leukemia therapeutics market size in 2024, driven by the repeated launch of BTK inhibitors and the combination of venetoclax, which extends progression-free survival. Acute lymphoblastic leukemia (ALL) stands out with a 10.36% CAGR, propelled by pediatric successes and the rollout of adult CAR-T indications. Acute myeloid leukemia (AML) growth is buoyed by menin inhibitors and venetoclax-based triplets, while chronic myeloid leukemia (CML) gains from Novartis’s Scemblix, which offers a 20% superior molecular response over standard tyrosine kinase inhibitors.
Molecular subtyping is redefining segmentation, as NPM1-mutated and KMT2A-rearranged leukemias emerge as distinct commercial niches. Diagnostic precision enables smaller populations to attract bespoke therapies, creating more granular revenue channels while elevating the aggregate leukemia therapeutics market.
By Therapeutic Modality: Gene Therapies Accelerate
Small molecules retained 34.56% leukemia therapeutics market share in 2024 on the strength of oral BTK, BCL-2, and FLT3 inhibitors. Yet gene therapies, notably CRISPR-edited allogeneic CAR-T and viral-free in vivo gene editing, are predicted to log 11.34% CAGR through 2030. Allogeneic approaches slash manufacturing time and widen patient eligibility, mitigating traditional autologous constraints. Bispecific antibodies and dual-CAR solutions counter antigen escape, while RNA platforms evolve toward programmable CAR-T generation. The modality convergence intensifies competition as diversified pipelines vie for hematology wallet share.
By Route of Administration: Intravenous Gains Momentum
Oral formulations captured 46.55% of leukemia therapeutics market size in 2024 but face a relative decline as infusion-based biologics gain speed. Intravenous delivery is forecast to climb 11.75% CAGR, aligned with CAR-T, monoclonal and bispecific antibody infusions that require hospital oversight. Subcutaneous variants of monoclonals aim to lighten infusion chair time, offering outpatient convenience that could temper IV growth beyond 2028. Pediatric liquid formulations for those unable to swallow tablets strengthen oral volume but will not offset the infusion-heavy wave of advanced modalities.
Note: Segment shares of all individual segments available upon report purchase
By Age Group: Pediatric Innovation Leads
Adults account for two-thirds of the leukemia therapeutics market, reflecting higher CLL and AML incidence in older patients. However, pediatric volumes—currently 34.66% and rising at a rate of 10.21% annually—attract disproportionate attention to innovation. The 96% disease-free survival achieved with CAR-T plus blinatumomab in standard-risk childhood ALL sets a new efficacy benchmark nejm.org. Regulatory incentives and philanthropic funding streamline pediatric trials, while safety monitoring spans decades, cementing long-term post-marketing responsibilities for developers.
Geography Analysis
North America accounted for 43.66% of global revenue in 2024, driven by early adoption, extensive reimbursement pools, and robust clinical infrastructure. Accelerated approval pathways compress launch timelines, although periodic chemotherapy shortages highlight the fragility of the supply chain. The region remains the vanguard for CAR-T and gene-edited solutions, ensuring continued leadership of the leukemia therapeutics market.
Asia-Pacific records the fastest 9.56% CAGR through 2030. India’s USD 30,000-50,000 domestic CAR-T therapies broaden eligibility and foreshadow wider affordability breakthroughs. Japan’s green lights for Ezharmia and acalabrutinib, and China’s improving survival rates despite an increase in incidence, add momentum. Local manufacturing hubs and government-backed reimbursement pilots shrink access gaps, expanding the leukemia therapeutics market.
Europe posts steady single-digit gains, aided by harmonized EMA review timelines and pan-regional early-access programs. South America and the Middle East & Africa trail due to resource constraints and cold-chain hurdles. Nonetheless, modular point-of-care production units and temperature-stable formulations promise to unlock latent demand over the next decade, advancing the global footprint of the leukemia therapeutics market.

Competitive Landscape
The leukemia therapeutics market is moderately concentrated. Novartis, Johnson & Johnson, and Bristol Myers Squibb collectively hold a roughly 35% share, leveraging their broad portfolios and global reach. Smaller innovators such as Syndax Pharmaceuticals demonstrate disruptive potential: revumenib generated USD 20 million in its first post-launch quarter, validating a strategy that targets genetically defined sub-segments.[3]Syndax Pharmaceuticals, “Syndax Announces FDA Approval of Revuforj (revumenib), the First and Only Menin Inhibitor to Treat Adult and Pediatric Patients With Relapsed or Refractory Acute Leukemia With a KMT2A Translocation,” syndax.com
Strategic partnerships dominate capital deployment. AstraZeneca’s stake in Cellectis secures CRISPR-edited allogeneic capacity, while Kyowa Kirin’s tie-in with Kura Oncology accelerates global menin inhibitor commercialization. Manufacturing innovation remains a critical differentiator: companies racing to refine off-the-shelf CAR-T and point-of-care vectors seek to overcome production bottlenecks that cap market throughput.
Competitive tactics are increasingly blending AI-guided target identification and integrated diagnostic services, thereby embedding therapy choice into a seamless patient journey. Firms that bundle test kits with matched therapeutics enhance stickiness, reinforcing their share of the leukemia therapeutics market.
Leukemia Therapeutics Industry Leaders
-
Amgen Inc.
-
Bristol-Myers Squibb Company
-
F. Hoffmann-La Roche Ltd
-
Novartis International AG
-
Sanofi S.A.
- *Disclaimer: Major Players sorted in no particular order

Recent Industry Developments
- June 2025: Johnson & Johnson announced positive Phase 1b data for bleximenib plus venetoclax and azacitidine in KMT2A- and NPM1-mutated AML.
- March 2025: Cellogen Therapeutics received Indian patent approval for a bi-specific 3rd-generation CAR-T platform targeting blood cancers.
- January 2025: FDA cleared treosulfan-fludarabine conditioning for allogeneic stem-cell transplantation in AML and myelodysplastic syndrome.
- November 2024: Syndax Pharmaceuticals gained FDA approval for Revuforj (revumenib), the first menin inhibitor for KMT2A-rearranged acute leukemia.


Research Methodology Framework and Report Scope
Market Definitions and Key Coverage
Our study defines the global leukemia therapeutics market as all branded and generic pharmacological agents, small-molecule drugs, monoclonal antibodies, antibody-drug conjugates, tyrosine-kinase inhibitors, CAR-T, and other cell-based immunotherapies used in the active treatment of acute and chronic leukemia across all lines of therapy and age groups. Products delivered through hospital, specialty, and retail channels in every region are captured, while parallel trade volumes are rolled into the same sales pool.
Scope Exclusion: Costs tied to diagnostic assays, transfusion support, anti-infective prophylaxis, and stem-cell transplantation services lie outside this definition.
Segmentation Overview
- By Treatment Type
- Chemotherapy
- Immunotherapy
- Targeted Therapy
- CAR-T Cell Therapy
- Gene Therapy
- Stem Cell Transplantation
- Other Treatment Types
- By Leukemia Type
- Acute Lymphoblastic Leukemia
- Acute Myeloid Leukemia
- Chronic Lymphocytic Leukemia
- Chronic Myeloid Leukemia
- Other Leukemia Types
- By Therapy Modality
- Small-Molecule Drugs
- Monoclonal Antibodies
- CAR-T Cell Therapies
- Gene Therapies
- Bispecific Antibodies
- RNA-based Therapies
- Other Modalities
- By Route of Administration
- Oral
- Intravenous
- Subcutaneous
- Other Routes
- By Age Group
- Pediatric (<14 yrs)
- Adult (15–64 yrs)
- Geriatric (65+ yrs)
- By Geography
- North America
- United States
- Canada
- Mexico
- Europe
- Germany
- United Kingdom
- France
- Italy
- Spain
- Rest of Europe
- Asia-Pacific
- China
- Japan
- India
- Australia
- South Korea
- Rest of Asia-Pacific
- Middle East and Africa
- GCC
- South Africa
- Rest of Middle East and Africa
- South America
- Brazil
- Argentina
- Rest of South America
- North America
Detailed Research Methodology and Data Validation
Primary Research
Mordor analysts interviewed hematologist-oncologists, hospital pharmacy heads, reimbursement advisors, and medical-affairs staff in North America, Europe, Asia-Pacific, and Latin America. These conversations validated dosing patterns, price erosion after generic entry, and realistic uptake ceilings for novel cell therapies, helping us close gaps left by desk research and refine regional weightings.
Desk Research
We began with publicly available epidemiology tables from sources such as WHO GLOBOCAN, the US SEER registry, and Eurostat cancer dashboards; these grounded our patient pools. Regulatory disclosures from the US FDA, EMA, and PMDA flagged new approvals and label expansions, while ClinicalTrials.gov trends hinted at future therapy mix. Company 10-Ks, investor decks, and Leukemia & Lymphoma Society treatment fact sheets refined revenue splits and adoption curves. Subscription tools, including D&B Hoovers for manufacturer financials, Dow Jones Factiva for real-time deal news, and Questel patent analytics, added competitive color that sharpened timing assumptions. The sources above are illustrative; many additional publications and databases informed data checks during desk work.
Market-Sizing & Forecasting
A prevalence-to-treated-cohort top-down model estimates therapy courses by leukemia subtype, age band, and line of therapy; average selling prices are then applied. Supplier revenue roll-ups and sampled invoice checks provide a bottom-up reasonableness test, after which totals are reconciled. Key variables include incident case growth, guideline-driven therapy mix shifts, median treatment duration, post-patent price compression, and regulatory approval cadence. Multivariate regression, with scenario branches for accelerated approvals or safety holds, projects values through 2030, and missing granular data are proxied using regional analogs vetted in primary calls.
Data Validation & Update Cycle
Outputs pass variance checks against audited company sales, import-export trends, and payer spend trackers. Senior reviewers sign off only after anomalies are resolved. Reports refresh annually; material events such as a first-in-class approval trigger interim updates, and a final analyst sweep occurs just before client delivery.
Why Mordor's Leukemia Therapeutics Baseline Commands Reliability
Published figures often diverge because firms select different base years, therapy baskets, and refresh tempos. Our disciplined scope alignment and yearly reconfirmation produce numbers that decision-makers can rely on.
Key gap drivers include competitor reliance on pre-COVID incidence tables, omission of emerging cell therapies, or conservative price erosion curves that understate current revenues.
Benchmark comparison
| Market Size | Anonymized source | Primary gap driver |
|---|---|---|
| USD 22.10 B (2025) | Mordor Intelligence | - |
| USD 16.15 B (2020) | Global Consultancy A | Older base year; excludes CAR-T sales |
| USD 18.30 B (2024) | Industry Intelligence B | Treats CML generics separately, shrinking total |
| USD 17.10 B (2024) | Trade Journal C | Uses shipment rather than therapy revenue data |
Taken together, the comparison shows that Mordor's consistently updated, therapy-inclusive framework delivers a balanced baseline that traces directly to transparent variables and repeatable steps, giving clients a dependable starting point for strategy.


Key Questions Answered in the Report
What is the current size of the leukemia therapeutics market?
The leukemia therapeutics market generated USD 22.10 billion in 2025 and is forecast to reach USD 31.09 billion by 2030 at a 7.07% CAGR.
Which treatment type is growing fastest?
CAR-T cell therapy posts the highest 17.14% CAGR through 2030, driven by label expansions and improved safety data.
Which region is expanding most rapidly?
Asia-Pacific leads regional growth with a 9.56% CAGR, supported by lower-cost CAR-T manufacturing and expanding reimbursement schemes.
How are high therapy costs being addressed?
Local production in India and China plus emerging allogeneic platforms are cutting CAR-T prices by up to 90%, broadening patient access.
What role do menin inhibitors play?
Menin inhibitors such as revumenib represent a new class targeting KMT2A-rearranged leukemia, offering 21% complete remission in refractory cases and stimulating further pipeline investment.
Page last updated on:


