
Global Leak Detection Solutions Market Size and Share
Market Overview
| Study Period | 2020 - 2031 |
|---|---|
| Market Size (2026) | USD 4.83 Billion |
| Market Size (2031) | USD 6.33 Billion |
| Growth Rate (2026 - 2031) | 5.53 % |
| Fastest Growing Market | Asia-Pacific |
| Largest Market | North America |
| Market Concentration | Medium |
Major Players *Disclaimer: Major Players sorted in no particular order Image © Mordor Intelligence. Reuse requires attribution under CC BY 4.0. | |
Global Leak Detection Solutions Market Analysis by Mordor Intelligence
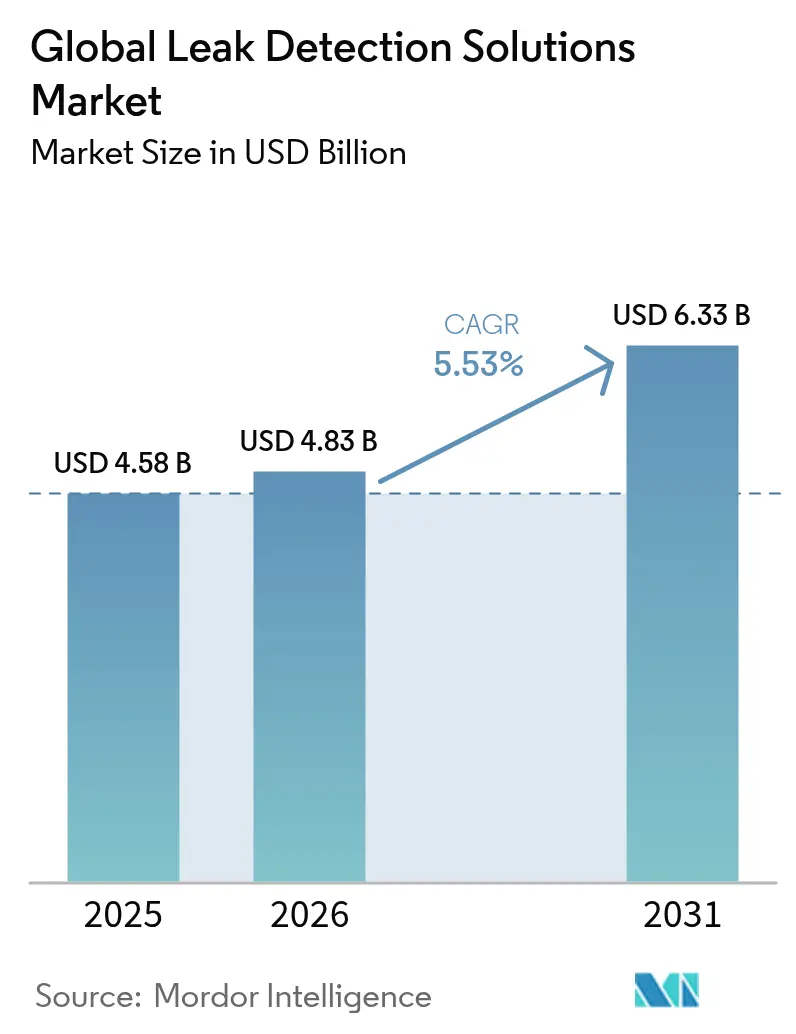
The leak detection solutions market size was valued at USD 4.58 billion in 2025 and estimated to grow from USD 4.83 billion in 2026 to reach USD 6.33 billion by 2031, at a CAGR of 5.53% during the forecast period (2026-2031). Heightened environmental regulations, expanding energy infrastructure, and rapid sensor innovation underpinned this growth. In 2024, the U.S. Environmental Protection Agency finalized methane-fee rules that imposed charges as high as USD 1,500 per metric ton by 2026, triggering a wave of compliance-driven investments.[1] Parallel rules from PHMSA that took effect in 2025 required advanced detection programs across U.S. gas pipelines. Laser absorption and LiDAR solutions posted the fastest adoption on the back of high-resolution quantification capabilities, while drone-mounted platforms solved access challenges in hazardous zones. North America commanded the largest regional position, yet Asia-Pacific recorded the most vigorous gains as India and Japan accelerated large-diameter pipeline programs.
Key Report Takeaways
- By technology, acoustic/ultrasonic solutions led with 26.74% revenue share in 2025, whereas laser absorption and LiDAR technologies expanded at an 8.41% CAGR through 2031.
- By end-user industry, the oil and gas segment held 60.35% of the leak detection solutions market share in 2025; water treatment registered the highest projected CAGR at 5.76% over 2026-2031.
- By deployment mode, fixed systems accounted for 65.40% of the leak detection solutions market size in 2025, while drone-mounted solutions grew at a 11.65% CAGR.
- By pipeline stage, midstream operations captured 44.60% of the leak detection solutions market size in 2025; upstream activities advanced at a 7.22% CAGR through 2031.
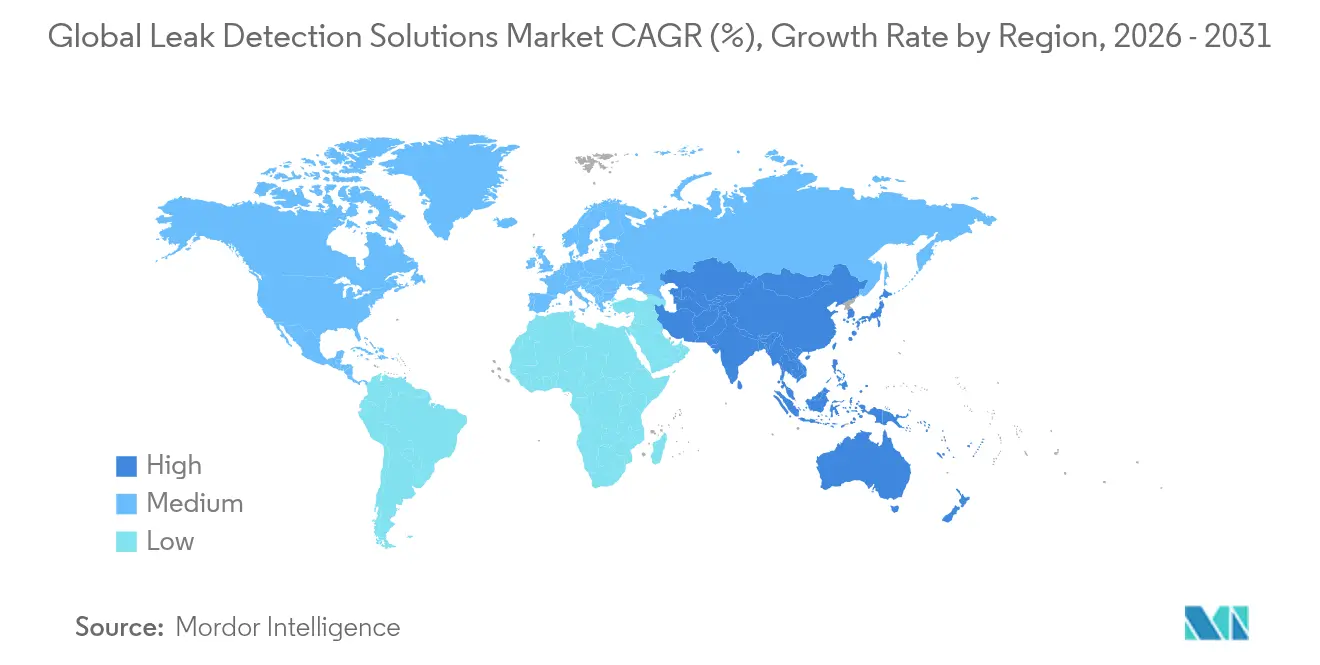
- By geography, North America retained 37.70% regional share in 2025, but Asia-Pacific was the fastest-growing geography at a 7.62% CAGR.
Note: Market size and forecast figures in this report are generated using Mordor Intelligence’s proprietary estimation framework, updated with the latest available data and insights as of 2026.
Market Trends and Insights
Drivers Impact Analysis of Global Leak Detection Solutions Market*
| Driver | (~) % Impact on CAGR Forecast | Geographic Relevance | Impact Timeline |
|---|---|---|---|
| Stringent fugitive-methane regulations (e.g., U.S. Inflation Reduction Act) | +1.8% | North America, expanding to the EU and Asia-Pacific | Short term (≤ 2 years) |
| Rapid expansion of hydrogen and CCUS pipeline projects | +1.2% | Global, with a concentration in North America and Europe | Medium term (2-4 years) |
| AI-enabled predictive analytics lowers false positives | +0.9% | Global, led by North America and Europe | Medium term (2-4 years) |
| Adoption of leak-detection-as-a-service (LDaaS) business models | +0.7% | Global, with early adoption in North America | Long term (≥ 4 years) |
| Satellite constellations providing high-resolution emissions data | +0.6% | Global coverage with a focus on major oil and gas regions | Short term (≤ 2 years) |
| Mandatory ESG reporting driving proactive leak management | +0.5% | Global, with emphasis on developed markets | Medium term (2-4 years) |
| Source: Mordor Intelligence | |||
Stringent fugitive-methane regulations drive market transformation
The Inflation Reduction Act’s methane surcharge, which started at USD 900 per metric ton in 2024 and climbs to USD 1,500 by 2026, re-shaped project economics by making continuous monitoring cheaper than paying fees. Complementary “Super Emitter” protocols allowed third parties to trigger operator response on leaks above 100 kg/hr, accelerating the adoption of fixed sensors and satellite data feeds. Operators substituted legacy Method 21 surveys with optical gas imaging and fiber-optic arrays to avoid downtime, lifting order volumes for high-resolution camera packages.
Rapid expansion of hydrogen and CCUS pipeline projects
Hydrogen molecules are smaller and more diffusive than methane, demanding detectors that spot leaks below 1 ppm; Raman analyzers demonstrated such sensitivity at several-meter stand-off distances. The U.S. Department of Energy earmarked USD 25 million for hydrogen-specific detection R&D in 2025. India’s state operators, including GAIL, evaluated dedicated hydrogen trunklines, creating follow-on demand for specialized sensors.
AI-enabled predictive analytics lower false positives
Machine-learning algorithms fused multi-sensor data and cut false alarms by differentiating leak signatures from rain, venting, and compressor noise. Honeywell’s collaboration with Google embedded Gemini generative AI into its platforms to deliver context-aware alarms and dynamic maintenance schedules. Academic work showed multi-algorithm fusion improving detection accuracy by 0.15 percentage points, enabling operators to trust autonomous shut-in commands.
Satellite constellations enable global emissions transparency
MethaneSAT, launched in March 2024, started detecting plumes as low as 2 ppb and provided public dashboards that regulators and investors used to benchmark operators. Studies combining data from Sentinel-2 and EnMAP quantified leaks between 1 t/h and 40 t/h with high spatial fidelity, reinforcing pressure on late adopters to install on-ground verification equipment.
Restraints Impact Analysis of Global Leak Detection Solutions Market*
| Restraint | (~) % Impact on CAGR Forecast | Geographic Relevance | Impact Timeline |
|---|---|---|---|
| High CAPEX for fiber-optic and LiDAR deployments in brownfield pipelines | -1.1% | Global, particularly in mature oil and gas regions | Short term (≤ 2 years) |
| Scarcity of skilled thermography and acoustics technicians in emerging markets | -0.8% | Asia-Pacific, Middle East, and Africa | Medium term (2-4 years) |
| Cybersecurity vulnerabilities in cloud-linked LD systems | -0.5% | Global, with higher impact in digitally advanced regions | Medium term (2-4 years) |
| False alarms in multiphase flow conditions reduce operator confidence | -0.4% | Global, particularly in complex processing environments | Short term (≤ 2 years) |
| Source: Mordor Intelligence | |||
High CAPEX for fiber-optic and LiDAR deployments in brown-field pipelines
Distributed fiber-optic sensing costs USD 50,000-100,000 per kilometer, and retrofits often require trenching or rack modifications that disrupt throughput. LiDAR heads suitable for hazardous zones were priced between USD 200,000 and USD 500,000, restricting adoption when crude prices softened. Operators in lower-margin basins thus favored portable ultrasonic detectors despite narrower coverage.
Scarcity of skilled thermography and acoustics technicians in emerging markets
Ultrasonic detectors needed personnel able to interpret 20-40 kHz signatures, a competency in short supply across Africa and parts of Asia. Thermal image interpretation faced similar gaps, with utility managers noting year-long lead times to hire certified level-II thermographers. The shortage delayed deployments even when funding was available, slowing the leak detection solutions market in high-growth regions.
*Our forecasts treat driver/restraint impacts as directional, not additive. The impact forecasts reflect baseline growth, mix effects, and variable interactions.
Global Leak Detection Solutions Market Segment Analysis
By Technology:
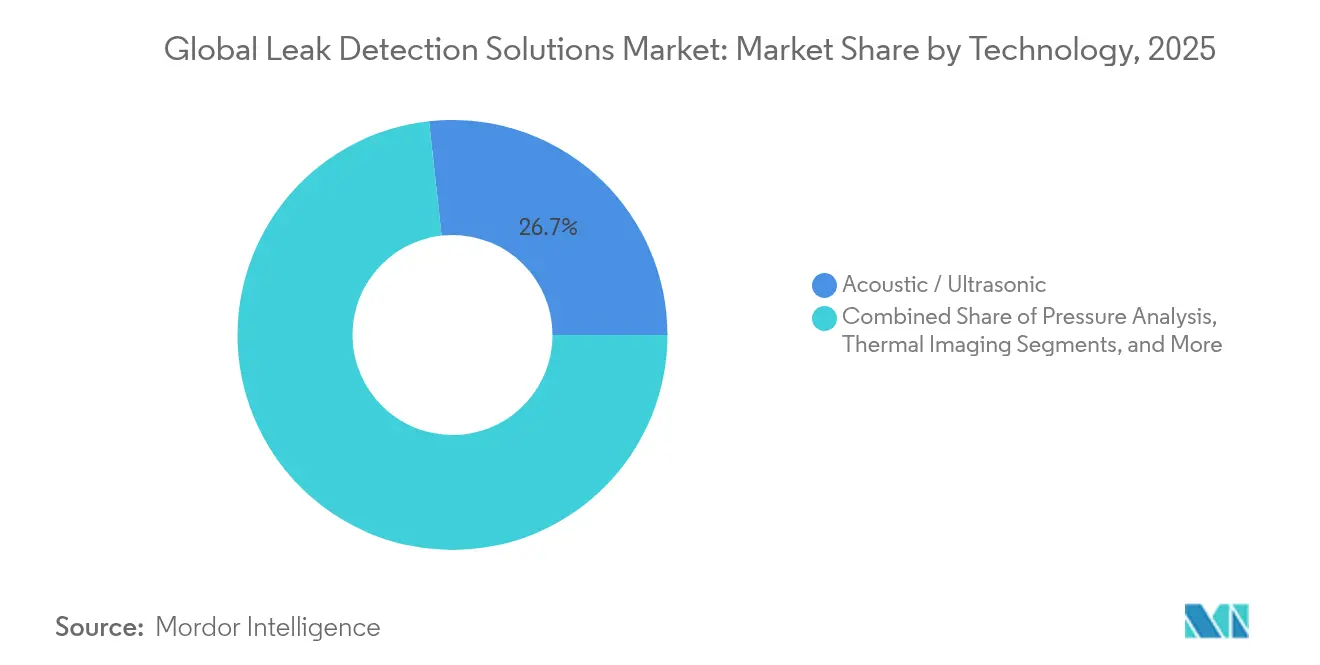
Acoustic strength meets laser accelerationAcoustic and ultrasonic systems held 26.74% of 2025 revenues, making them the largest single technology cohort in the leak detection solutions market. Piezo-electric sensors delivered instantaneous alerts within a 40 m radius and required no calibration, a value proposition that suited onshore gathering lines. Laser absorption and LiDAR platforms, while still smaller in absolute sales, expanded at an 8.41% CAGR, buoyed by regulatory recognition of quantified emission measurement protocols.
Thermal imagers moved from handheld to cloud-connected variants that streamed radiometric data for predictive analytics, broadening appeal among refinery operators. Fiber-optic distributed sensing gained contracts along subsea tiebacks where maintenance access was limited. Analytical modeling showed sub-1% localization error for acoustic-emission-based storage-tank monitoring, validating acoustic dominance in fixed assets.

By End-User Industry:
Oil and gas holds sway as water utilities accelerateThe oil and gas sector captured 60.35% of 2025 revenue, reflecting statutory leak fees and the high-consequence nature of hydrocarbon releases. Nevertheless, water treatment utilities logged the quickest expansion at 5.76% CAGR, spurred by aging mains and drought-linked loss-reduction mandates. Utilities deployed AI classifiers that achieved 98.3% accuracy on leak/no-leak differentiation in potable networks. Chemical and power-generation operators adopted clamp-on flowmeters following corporate net-zero policies, while hydrogen developers demanded Raman-based detectors to satisfy safety case requirements.
By Component:
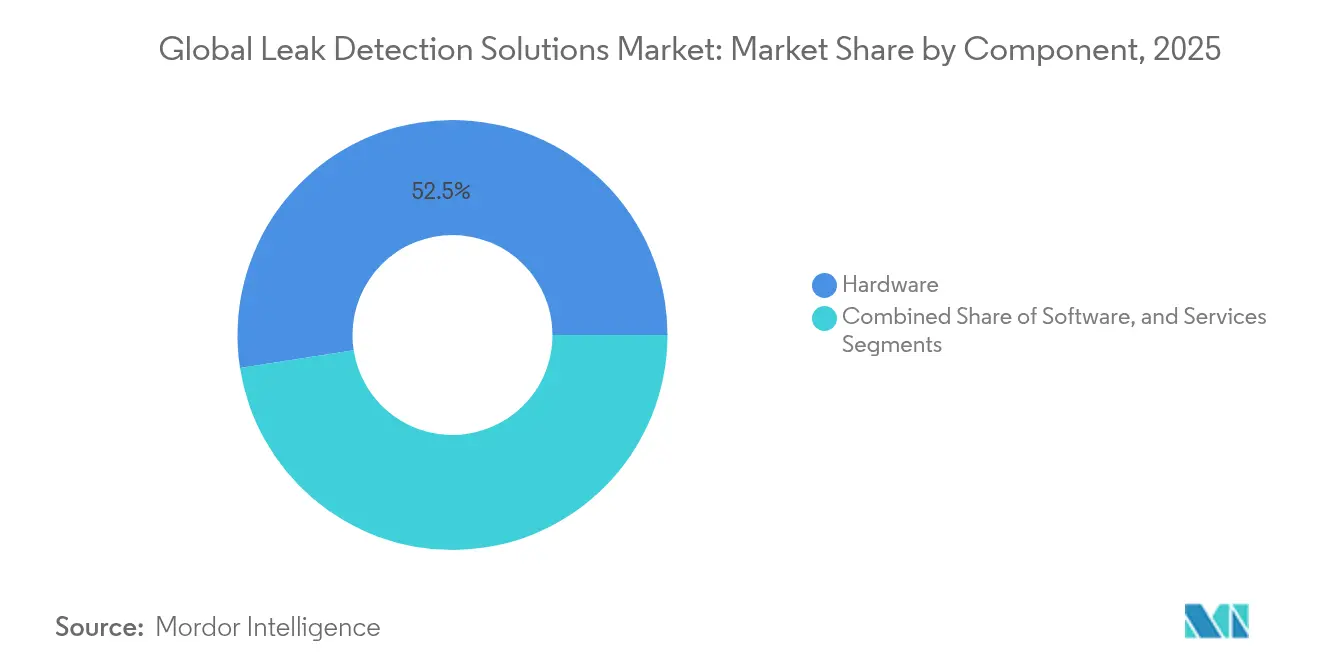
Hardware dominant, software surgingSensors, cameras, and cables made up 52.45% of the 2025 spend, anchoring the leak detection solutions market. Yet analytics software, enriched with machine learning, posted a 7.55% CAGR as operators transitioned to predictive maintenance. Deep-learning models on multimode fibers predicted temperatures with 100% tolerance accuracy, pushing adoption in LNG trains. Services, including installation and LDaaS contracts, remained a steady contributor and provided annuity revenue streams for vendors.
By Deployment Mode:
Fixed systems rule, drones take flightFixed installations delivered 65.40% of 2025 revenue, driven by 24/7 surveillance requirements at compressor stations and tank farms. Drone-mounted platforms, however, expanded at 11.65% CAGR as operators sought rapid reconnaissance after storms or sabotage incidents. ABB’s HoverGuard illustrates sensitivity gains capable of mapping 1 ppm-meter methane at 150 m altitude. Portable detectors played a role in spot checks and confined-space entry.
By Pipeline Stage:
Midstream leadership amid upstream uptickTransmission networks absorbed 44.60% of the 2025 spend, reflecting the vast mileage of regulated pipelines requiring continuous integrity assurance. Upstream wells and flowlines nonetheless grew at 7.22% CAGR as shale, offshore, and enhanced-oil-recovery projects installed corrosion-resistant composites that needed specialized leak surveillance. Downstream sites—refineries, petrochemical complexes, and LNG liquefiers—maintained stable demand for vapor-sensing and infrared cameras to mitigate unit shutdown risks.
Geography Analysis
North America Leak Detection Solutions Market
North America retained 37.70% of global revenue in 2025 owing to methane-fee statutes, enhanced pipeline safety regulations, and the rollout of satellite verification programs such as MethaneSAT that scrutinized shale basins. Canada’s hydrogen roadmap further boosted orders for specialized leak sensors, while Mexico’s cross-border pipeline build created incremental demand for midstream monitoring solutions. The leak detection solutions market size in the region is forecast to advance steadily as refiners digitize aging assets.
APAC Leak Detection Solutions Market
Asia-Pacific recorded a 7.62% CAGR through 2031. India commissioned a USD 1.3 billion, 2,800 km LPG pipeline in 2025 and earmarked USD 5 billion for new gas corridors, lifting hardware imports, and local assembly. Japan signed bilateral pacts to curb methane leakage and funded R&D on drone-based inspections for municipal sewer lines. China expanded L-band SAR combined with ground-penetrating radar to detect water-line failures beneath urban arteries, accelerating municipal orders.
EMEA Leak Detection Solutions Market
Europe maintained momentum as the EU tightened corporate sustainability reporting and methane-intensity disclosure. Operators integrated fiber-optic strings along North Sea interconnectors and invested in LiDAR-equipped helicopters to monitor distribution grids. The Middle East and Africa lagged in skilled labor, but rising CCUS hubs in the Gulf and new crude export pipelines in East Africa unlocked contracts for turnkey leak detection packages. Regional utilities leveraged technology transfer agreements to bridge capability gaps.
Regulatory Landscape
Regulation is tightening around instrument-based leak detection and repair (LDAR) across oil and gas assets and pipelines, with U.S. requirements driving compliance investment in the near term. In January 2025, the U.S. Pipeline and Hazardous Materials Safety Administration (PHMSA) finalized Gas Pipeline Leak Detection and Repair requirements, mandating Advanced Leak Detection Programs (ALDP) for Part 192-regulated gas transmission, distribution, and certain gathering pipelines, and raising survey expectations in higher-risk settings such as Class 3, Class 4, and High Consequence Areas.
For upstream operations and processing facilities, U.S. federal programs reinforce recurring LDAR cycles and method specificity. The U.S. Bureau of Land Management (BLM) requires operators on Federal and Indian leases to submit and annually update a statewide LDAR program under 43 CFR 3179.100 (with deadlines extending to December 10, 2026 for leases in effect on June 10, 2024), while U.S. EPA Greenhouse Gas Reporting Program provisions (40 CFR 98.234) define eligible leak detection methods, including optical gas imaging instruments with specified sensitivities. In April 2026, the U.S. EPA released a pre-publication preamble for an Oil and Natural Gas Sector NESHAP technology review (including Subpart HH elements), pointing to continued updates that favor validated, performance-oriented detection technologies and documented work practices.
Value Chain Analysis
The value chain covers sensing components and ruggedized hardware (acoustic/ultrasonic sensors, NDIR/laser analyzers, fiber-optic distributed sensing, thermal imagers), system integration (SCADA/PLC connectivity, edge compute, communications), and analytics software for alarm rationalization, localization, and compliance-ready reporting. Deployment is carried out through OEM direct sales, specialist integrators, and service partners providing installation, calibration, and monitoring programs, with end users in oil and gas (upstream, midstream, downstream) and water utilities increasingly purchasing bundled hardware, software, and service packages.
Recent buying patterns show a shift toward partnership models that combine field sensing with cloud, AI, and existing infrastructure to reduce total deployment cost and accelerate rollout. The April 2025 project led by SUEZ with Uisce Eireann, Aganova, and Microsoft inspected 40 km of strategic water pipelines in Dublin using Aganova's Nautilus acoustic technology, and Oldcastle Infrastructure's June 2025 partnership with VODA.ai integrated AI-driven predictive failure and leak detection into the CivilSense water asset management platform. On the supply and deployment side, third-party fiber networks as sensing backbones are gaining traction, as reflected in Lightsonic's August 2025 contract with Affinity Water to deploy distributed fiber-optic sensing for leak detection across Openreach's fiber network, strengthening links between telecom infrastructure, sensing OEMs, and utility operations.
Competitive Landscape
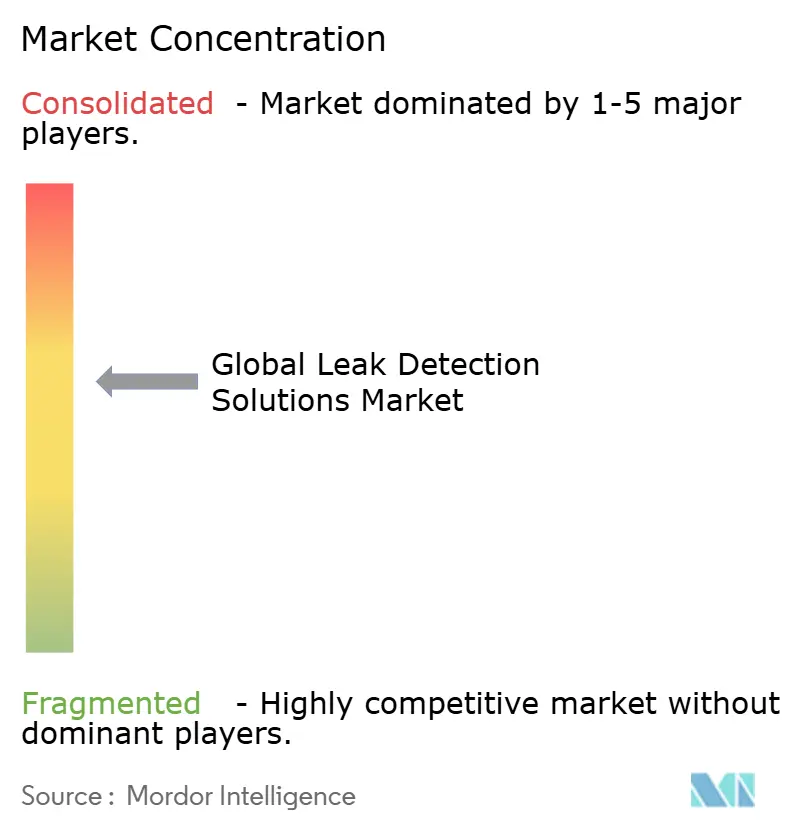
The leak detection solutions market displayed moderate fragmentation. Industrial automation majors orchestrated acquisitions to broaden their scope. Honeywell spent USD 2.16 billion on Sundyne and USD 1.81 billion on Air Products’ LNG technology to deepen critical pump, compressor, and process controls portfolios.[4] The firm then layered Google’s Gemini AI on its platform to deliver dynamic alarm rationalization.
Endress+Hauser absorbed roughly 800 SICK staffers via a strategic partnership that bolstered gas analysis and flow measurement competencies essential for emissions quantification. Emerson purchased Flexim to secure clamp-on ultrasonics used in water and chemical plants. Smaller specialists thrived in niches such as hydrogen-specific sensors and AI-enabled LDaaS; their agility secured pilot wins with national oil companies.
Competitive intensity sharpened as satellite-data start-ups partnered with drone firms to offer basin-wide surveillance subscriptions. Vendors differentiated through end-to-end offerings that bundled sensors, cloud analytics, and regulatory reporting templates. Price competition remained muted in high-consequence applications where performance outweighed cost, sustaining healthy gross margins for incumbents.
Global Leak Detection Solutions Industry Leaders
-
Honeywell International Inc
-
Aeris Technologies, Inc.
-
Bridge Photonics
-
Schneider Electric S.E
-
Siemens Gas and Power GmbH & Co. KG
- *Disclaimer: Major Players sorted in no particular order
Global Leak Detection Solutions Market Companies Covered in this Report
- Honeywell International Inc.
- Aeris Technologies Inc.
- Bridger Photonics Inc.
- Schneider Electric SE
- Siemens Energy AG
- Xylem Inc.
- Krohne Messtechnik GmbH
- PSI Software AG
- Teledyne FLIR LLC
- ClampOn AS
- PermAlert (Division of Tremco Incorporated)
- OptaSense Ltd. (a Luna Innovations company)
- Physical Sciences Inc.
- Veeder-Root Company
- Atmos International Limited
- Emerson Electric Co.
- Baker Hughes Company – Avitas Systems
- Perma-Pipe International Holdings Inc.
- Sensit Technologies LLC
- Pentair plc
- Synodon Inc.
- INGU Solutions Inc.
- New Cosmos Electric Co. Ltd.
- Pressure Pipe Inspection Company (PPIC)
- Enagas S.A.
- TTK SAS
Market Opportunities and Future Outlook
A notable whitespace is multi-layer monitoring that combines fixed sensors, mobile surveys, and remote sensing into one compliance and operations workflow. This direction is reinforced by regulatory pull from PHMSA's January 2025 Advanced Leak Detection Programs (ALDP) and the EPA's focus on instrument-defined methods, which raises demand for platforms that locate, categorize, and document leaks with auditable outputs rather than single-point alarms. In 2026, PipeSense emphasized machine learning-enhanced dynamic pressure analysis for dense-phase and supercritical CO2 pipelines on a 12-mile South Texas route, highlighting ongoing product development around CO2 transport conditions. At the 2026 API Pipeline Conference, KROHNE introduced a next-generation internal pipeline leak detection platform that combines computational monitoring, E-RTTM, AI/ML, and embedded cybersecurity.
Recent Industry Developments in Global Leak Detection Solutions Market
- June 2026: Honeywell launched Safety Suite 2.0, an industrial software update designed to improve real-time visibility across fleets of portable gas detectors. The platform supports trend identification, alarm review, and compliance tracking, strengthening the software layer that ties field detection activity to auditable safety and leak-management workflows.
- May 2025: Honeywell launched a Hydrogen Leak Detector (HLD) solution based on thermal conductivity detection technology, targeting hydrogen infrastructure with low-concentration detection down to 50 ppm and long-life operation without manual calibration for up to 10 years. The release expands commercially available hydrogen-specific detection options as operators build out hydrogen production, storage, and pipeline-related safety systems.
- August 2024: Honeywell introduced an end-to-end emissions monitoring solution, expanding the Versatilis Signal Scout offering with solar capabilities to extend detector operating life in remote and offshore environments. Longer-lived monitoring hardware supports continuous emissions oversight where power access and maintenance windows are constrained, improving the economics of fixed deployments.
Global Leak Detection Solutions Market Report Scope and Research Methodology
Market Definition and Coverage
For our sizing, leak detection solutions are the hardware, software, and related services used to find, localize, and alert on leaks in pipelines and connected assets across industrial and utility environments, covering fixed, portable, and remote deployments.
Scope exclusions: We exclude general repair work, replacement pipes and fittings, and routine maintenance labor that is not directly tied to detection and monitoring activities.
Segments Covered in This Report
- By Technology
- Acoustic / Ultrasonic
- Pressure Analysis
- Thermal Imaging
- Fiber Optic
- Laser Absorption and LiDAR
- Vapor Sensing
- E-RTTM
- Other Technologies
- By End-User Industry
- Oil and Gas
- Chemical
- Water Treatment
- Power Generation
- Other End-Users
- By Component
- Hardware
- Software
- Services
- By Deployment Mode
- Fixed / Stationary
- Portable / Handheld
- Drone-Mounted / Aerial
- By Pipeline Stage
- Upstream
- Midstream
- Downstream
- By Geography
- North America
- United States
- Canada
- Mexico
- South America
- Brazil
- Argentina
- Rest of South America
- Europe
- Germany
- United Kingdom
- France
- Italy
- Russia
- Rest of Europe
- Asia-Pacific
- China
- Japan
- India
- South Korea
- Australia
- Rest of Asia-Pacific
- Middle East and Africa
- Middle East
- Saudi Arabia
- United Arab Emirates
- Turkey
- Rest of Middle East
- Africa
- South Africa
- Nigeria
- Rest of Africa
- Middle East
- North America
Data Sources, Market Sizing, and Validation
Desk Research
Desk research was used to frame the market boundary and to anchor the model inputs that are observable at the country and sector level. We relied on public references such as pipeline safety and incident publications from regulators like PHMSA, methane and emissions rule materials from agencies like the US EPA, water utility non-revenue water references from sources such as the World Bank, and energy and industrial activity indicators from sources such as the IEA.
We also reviewed standards and technical materials from associations and professional bodies, along with peer-reviewed papers that describe performance of acoustic, laser, thermal, and fiber optic methods under real operating conditions. Company annual reports, investor presentations, and reputable press were used to understand solution mix shifts and typical buying cycles. Where needed, paid subscriptions for company financials and intelligence, news and financials, patent databases, and import and export shipment-level data were used to verify supplier exposure and technology adoption signals. This desk source list is not exhaustive, and we checked many other public references to collect, validate, and clarify specific data points.
Primary Interviews and Surveys
Primary work focused on confirming what is actually purchased and deployed, and how pricing and replacement cycles behave for end users. We spoke with a mix of solution providers, channel partners, asset operators, and engineering and maintenance stakeholders across APAC, EMEA, and the Americas, and then used the input to fill gaps on installation patterns, monitoring coverage expectations, and typical spend per site.
Distribution of primary research fieldwork respondents
| Company type | Respondent position | Region |
|---|---|---|
| Top tier: 27% | CXOs: 19% | APAC: 42% |
| Mid tier: 54% | Functional/Unit leaders: 34% | EMEA: 34% |
| Smaller Players: 19% | Managers: 47% | Americas: 24% |
Market-Sizing & Forecasting
Market sizing starts with a top-down build where pipeline and utility infrastructure activity, safety and emissions compliance intensity, and sector capex cycles are translated into an addressable demand pool for detection and monitoring. That demand pool is then shaped using adoption by end users, typical monitoring coverage levels, and the mix of technologies used in different environments (for example, acoustic and pressure analysis for network monitoring, and laser or thermal methods for targeted inspections). To keep totals realistic, results are corroborated with selective bottom-up approximations, using supplier revenue exposure checks, sampled price per system or project, and volume estimates based on deployments per site or per kilometer where primary inputs were available.
A small set of inputs is tracked carefully because they move the market the most, such as pipeline length additions and integrity spend, incident and leak reporting trends, methane regulation timelines, utility non-revenue water reduction programs, and observed shifts toward remote monitoring and analytics. For forecasting, scenario analysis is used and then aligned to expert consensus on regulation pacing, energy and water infrastructure budgets, and technology cost trends. When bottom-up visibility is incomplete in smaller countries or niche end uses, we apply proxy adoption curves from similar peer markets and then normalize the result back to the top-down demand envelope.
Data Validation & Update Cycle
Outputs are checked through multiple passes so outliers do not carry into the final series. We compare model results with independent signals such as infrastructure investment direction, regulatory milestones, and observable technology adoption indicators, and then we re-check any variances that are too large to be explained by the inputs.
Before sign-off, the work is reviewed internally with a step-by-step assumption audit, and follow-up calls are triggered when interview feedback conflicts with desk indicators, or when pricing and adoption move unexpectedly. Reports are refreshed annually, with interim updates when material events occur, and a final pre-delivery review is done to ensure the latest public information is reflected.
Mordor Intelligence's Global Leak Detection Solutions Market Size Compared With Other Published Estimates
Published market values for leak detection often differ because each publisher draws the market line in a different place, and then applies a different mix of demand signals and price logic. Differences in what gets counted as a solution, which end users are included, and which year is used as the anchor can all move the final number.
For this market, the biggest gaps usually come from whether broad, non-industrial uses are included, how service revenue is treated versus equipment revenue, and whether the model is built from compliance-driven demand (pipelines, utilities, and process industries) or from a wider set of safety and inspection applications. Currency conversion timing, assumed technology mix shifts (such as laser and remote monitoring), and how often assumptions are refreshed also explain why two estimates can land far apart.
Benchmark comparison
| Source | Market Size | Gaps in Research Methodology |
|---|---|---|
| Mordor Intelligence | USD 4.58 B (2025) | |
| Industry Publisher A | USD 5.08 B (2025) | This estimate appears to use a broader leak detection scope across many end uses, which can pull in inspection-centric categories beyond pipeline and utility monitoring, thereby lifting the total. |
| Research Publisher B | USD 4.04 B (2024) | This estimate is anchored to a different base year and shows strong weighting toward handheld detectors and certain industries, which can undercount continuous monitoring deployments and services in infrastructure-heavy sectors. |
The spread in the table is largely explained by scope breadth and the choice of anchor year, followed by how technology mix and services are treated in revenue. When the demand pool is tied back to infrastructure monitoring and compliance-driven spend, and then stress-tested with pricing and adoption checks from interviews, the 2025 total stays traceable to repeatable inputs, which is the approach used here by Mordor Intelligence.
Key Questions Answered in the Report
What is the current size of the leak detection solutions market?
The leak detection solutions market was valued at USD 4.83 billion in 2026 and is projected to reach USD 6.33 billion by 2031.
Which technology segment is growing the fastest?
Laser absorption and LiDAR systems are the fastest-growing technologies, registering an 8.41% CAGR through 2031.
Why is Asia-Pacific the fastest-growing region?
Robust pipeline expansion in India, Japan’s methane-mitigation programs, and China’s municipal infrastructure upgrades are propelling a 7.62% regional CAGR.
How do methane-free regulations affect adoption?
Charges rising to USD 1,500 per metric ton by 2026 have made investing in continuous monitoring cheaper than paying penalties, accelerating deployments in North America.
What role do drones play in leak detection?
Drone-mounted sensors provide rapid, remote coverage of hazardous or inaccessible assets, and this deployment mode is growing at a 11.65% CAGR.
Who are the key players shaping market dynamics?
Honeywell, Endress+Hauser, Emerson, and ABB lead through acquisitions, AI partnerships, and portfolio integration, collectively holding a sizable portion of global revenue.