
IT Hardware Market Size and Share
Market Overview
| Study Period | 2020 - 2031 |
|---|---|
| Market Size (2026) | USD 152.13 Billion |
| Market Size (2031) | USD 221.34 Billion |
| Growth Rate (2026 - 2031) | 7.78% CAGR |
| Fastest Growing Market | Asia-Pacific |
| Largest Market | North America |
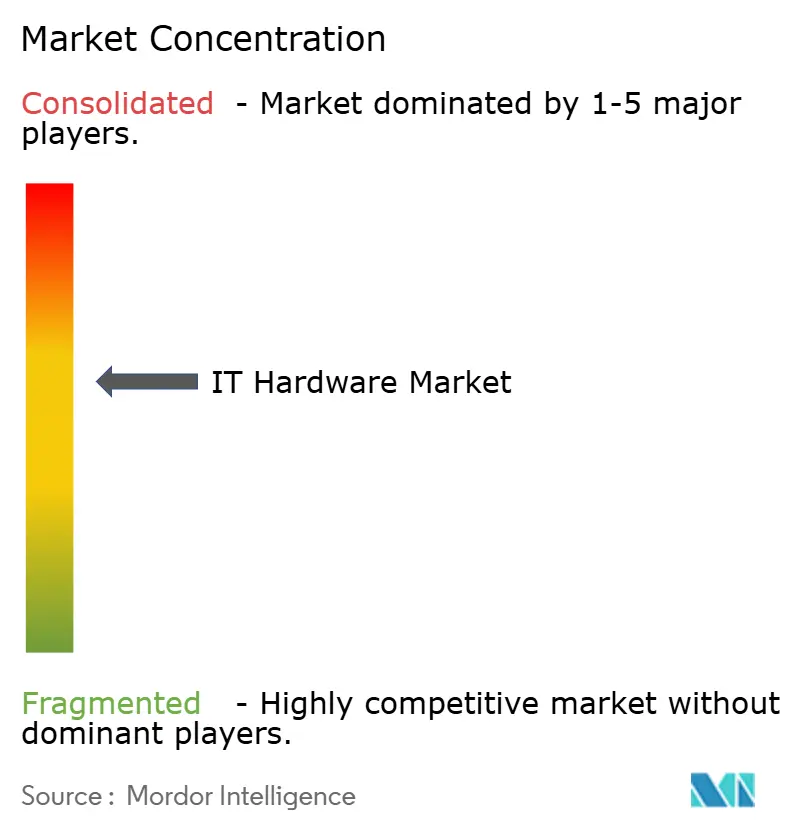
| Market Concentration | Medium |
Major Players *Disclaimer: Major Players sorted in no particular order Image © Mordor Intelligence. Reuse requires attribution under CC BY 4.0. | |
IT Hardware Market Analysis by Mordor Intelligence
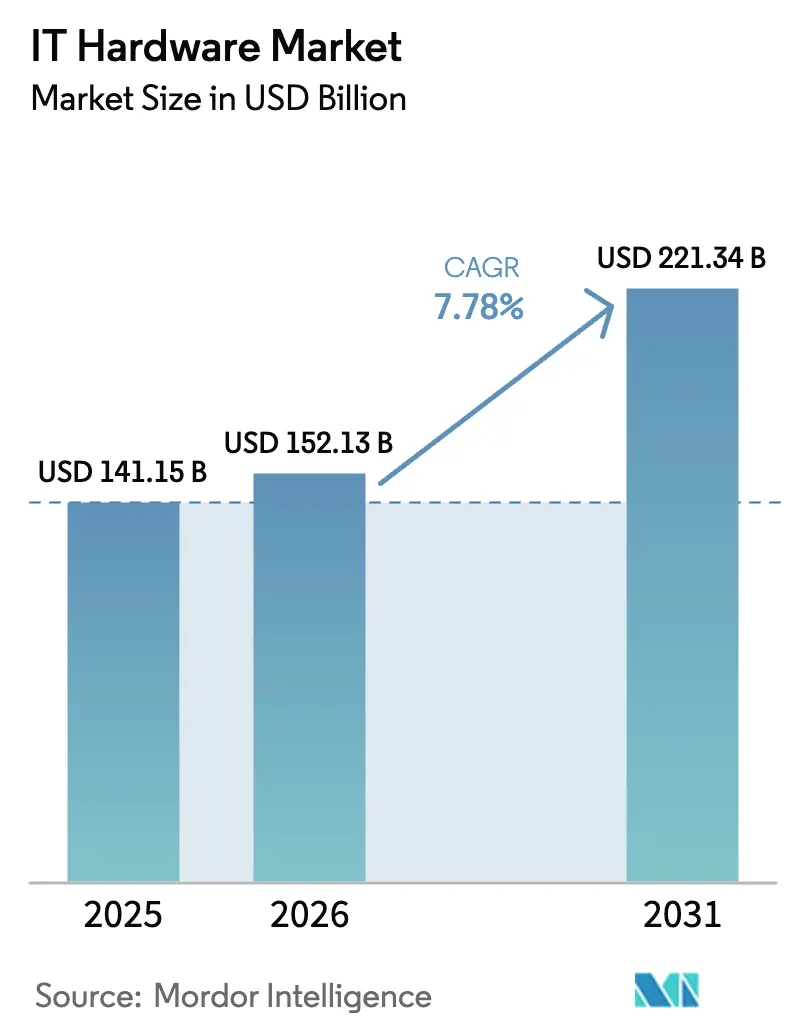
The global IT hardware market size was valued at USD 141.15 billion in 2025 and estimated to grow from USD 152.13 billion in 2026 to reach USD 221.34 billion by 2031, at a CAGR of 7.78% during the forecast period (2026-2031). Demand accelerates as enterprises refresh PCs ahead of Windows 10 end-of-support, deploy AI-ready servers, and comply with data-sovereignty mandates. North American cloud providers continue to expand hyperscale campuses, while Asia-Pacific manufacturers modernize production with edge computing. Tight semiconductor supply and e-waste regulation temper short-term momentum but do not derail the long-range growth outlook. Vendor competition intensifies around integrated compute, storage, and networking solutions that shorten deployment time and improve energy efficiency. Direct OEM relationships still dominate large-enterprise procurement, yet fast-growing online channels now give smaller firms affordable access to enterprise-grade equipment.
Key Report Takeaways
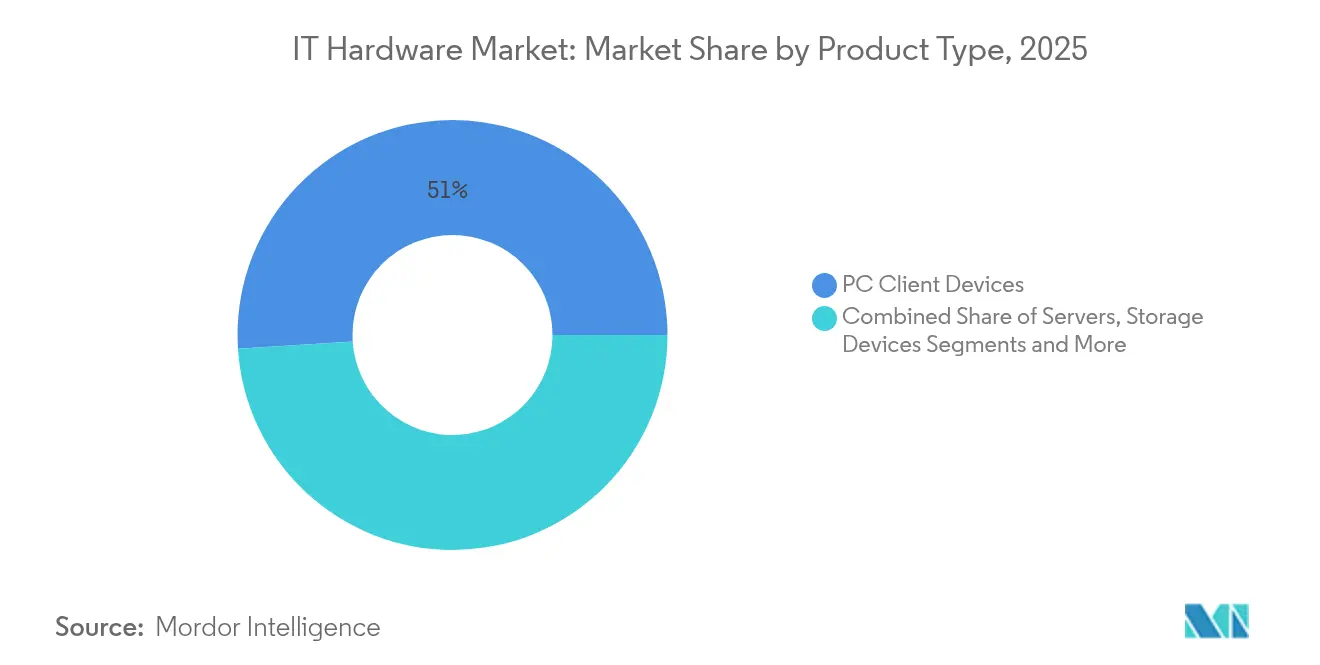
- By product type, PC client devices led with 51.02% of IT hardware market share in 2025; servers are projected to log a 8.95% CAGR through 2031.
- By end user, enterprises held 47.25% share of the IT hardware market size in 2025, while cloud service providers exhibit the highest CAGR at 17.05% through 2031.
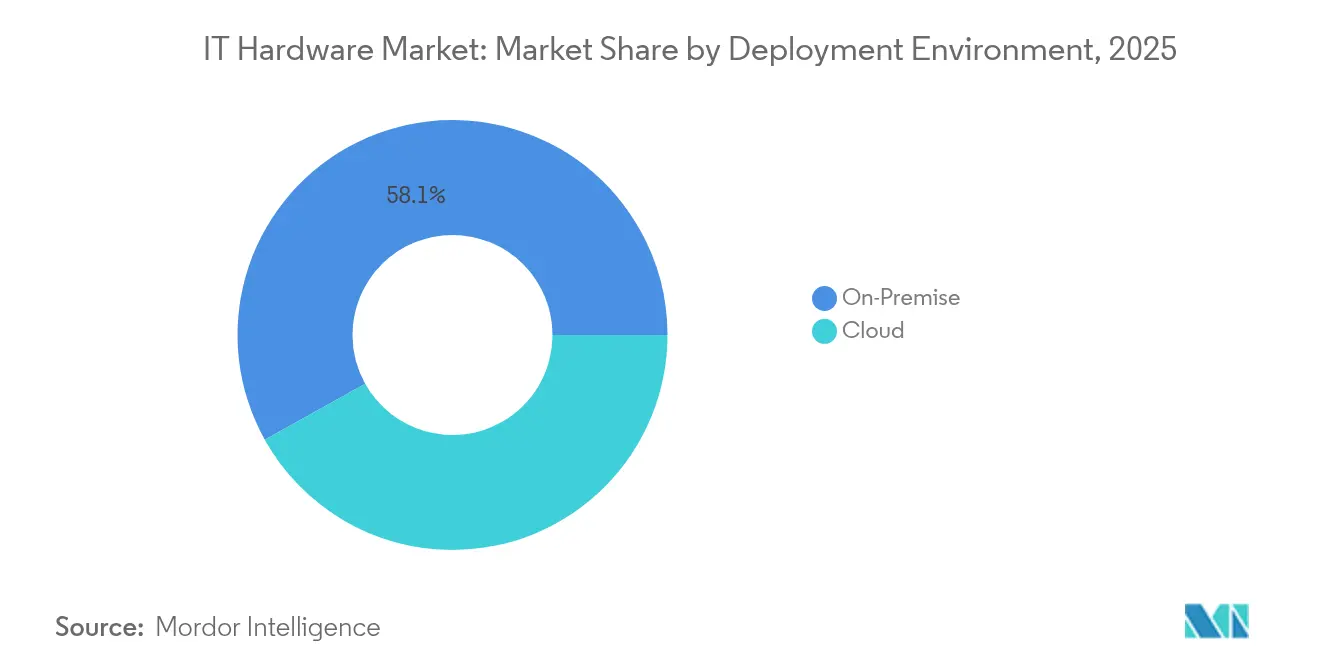
- By deployment environment, on-premise installations accounted for 58.10% of the IT hardware market size in 2025, whereas cloud deployments are advancing at a 17.12% CAGR to 2031.
- By distribution channel, Direct / OEM accounted for 44.70% of the IT hardware market size in 2025, whereas the Online channel is advancing at a 9.86% CAGR to 2031.
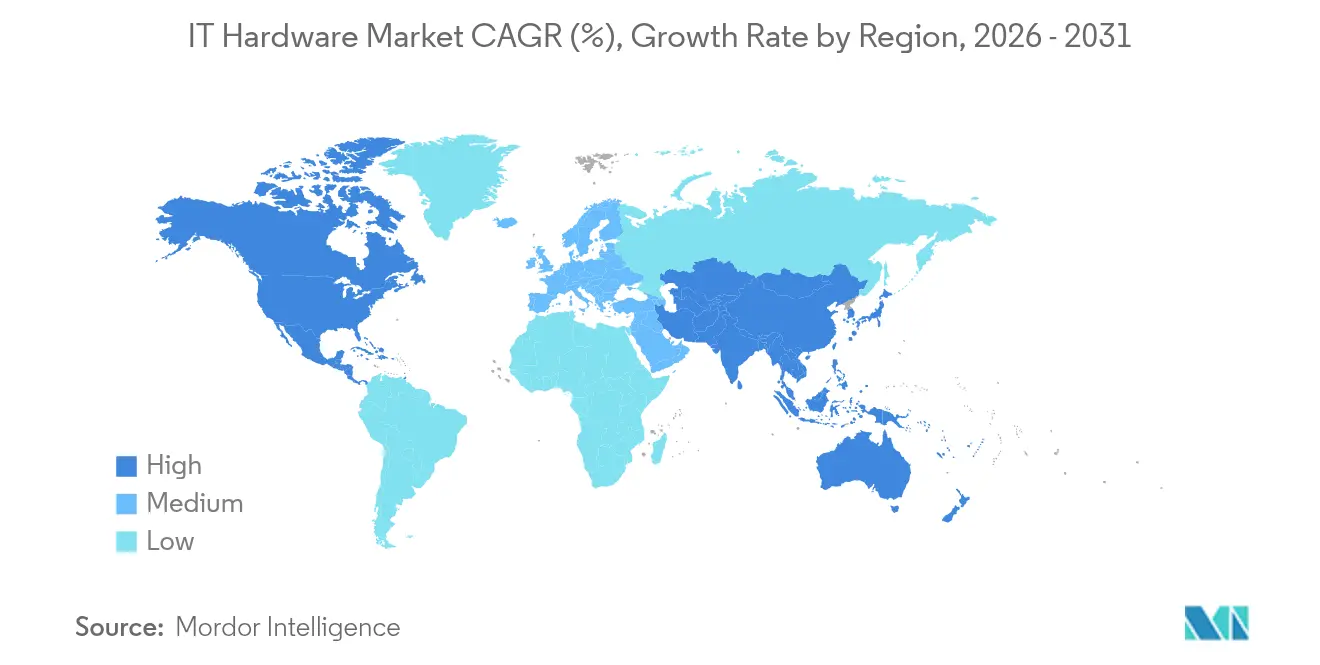
- By geography, North America retained 37.40% revenue share in 2025; Asia-Pacific is forecast to expand at a 9.32% CAGR through 2031.
Note: Market size and forecast figures in this report are generated using Mordor Intelligence’s proprietary estimation framework, updated with the latest available data and insights as of 2026.
Global IT Hardware Market Trends and Insights
Drivers Impact Analysis*
| Driver | (~) % Impact on CAGR Forecast | Geographic Relevance | Impact Timeline |
|---|---|---|---|
| Post-pandemic PC refresh cycle ahead of Windows 10 EoS | +1.2% | North America, Europe | Short term (≤ 2 years) |
| Proliferation of AI-optimized servers and GPUs | +2.1% | North America, Asia-Pacific | Medium term (2-4 years) |
| Hyperscale data-center build-out in emerging markets | +1.8% | Asia-Pacific, Middle East & Africa | Medium term (2-4 years) |
| Growth of edge-computing starter kits for smart factories | +0.9% | Asia-Pacific, Europe | Long term (≥ 4 years) |
| Right-to-repair and modular-upgrade regulations | +0.7% | Europe, North America | Long term (≥ 4 years) |
| Digital-sovereignty hardware incentives | +1.1% | North America, Europe, Asia-Pacific | Medium term (2-4 years) |
| Source: Mordor Intelligence | |||
Post-pandemic PC refresh cycle ahead of Windows 10 EoS
Enterprises face a hard Windows 10 support deadline in October 2025. Microsoft’s extended security plan costs escalated to USD 427 per device in the third year, making new hardware cheaper than patching [1]Microsoft, “Windows 10 End of Support,” Microsoft, microsoft.com . Devices purchased for remote work in 2020–2021 now reach their natural four-year replacement window. U.S. hospital systems such as Kaiser Permanente have already upgraded entire fleets for Windows 11-based electronic health records. Banking majors mirror the trend; JPMorgan Chase earmarked USD 2.1 billion in 2024 for endpoint security upgrades tied to modern PCs. The dual catalyst lifts demand for compliant laptops, desktops, and specialist workstations across regulated sectors.
Proliferation of AI-optimized servers and GPUs
AI workloads move from pilots to production, sending specialized server demand sharply higher. NVIDIA data-center revenue jumped to USD 47.5 billion in fiscal 2024 as enterprises standardised on GPU-based compute. Dell Technologies reported an AI-server backlog swelling from USD 800 million to USD 2.9 billion within one quarter, underscoring urgency for AI-ready gear. Manufacturers such as Siemens embed these systems on shop floors to enable predictive maintenance, while Goldman Sachs invested USD 1.2 billion in 2024 to secure millisecond risk-analysis capability. The shift also accelerates spending on high-bandwidth networking and low-latency storage that keep AI clusters fully utilized.
Hyperscale data-centre build-out in emerging markets
Asia-Pacific commands a USD 116.2 billion data-center investment requirement through 2030, led by Japan at USD 35.4 billion and India at USD 16.4 billion. Singapore’s 2024 moratorium lift triggered a construction wave, with hyperscale operators announcing USD 8 billion in AI-focused facilities. Liquid-cooling racks and dense GPU nodes dominate new blueprints. India’s National Data Governance Framework obliges local processing of sensitive data, prompting broad sectoral hardware purchases. The build-out enlarges regional supply chains and underpins long-term server and network equipment demand.
Growth of edge-computing starter kits for smart factories
Rugged edge nodes now process industrial IoT data locally to cut latency from 100 milliseconds to under 10 milliseconds in automotive plants. Starter bundles combine compute, storage, and connectivity, costing USD 50,000–200,000 per site—an affordable entry for medium-sized factories. BMW and Mercedes-Benz run such systems to power predictive maintenance and optical quality checks. Vendors refine fanless designs and extended-temperature components that meet factory-floor constraints. The opportunity scales as Asia-Pacific suppliers replicate German success stories across electronics and textiles clusters.
Restraints Impact Analysis*
| Restraint | (~) % Impact on CAGR Forecast | Geographic Relevance | Impact Timeline |
|---|---|---|---|
| Escalating e-waste regulation and disposal costs | -0.8% | Europe, North America, Asia-Pacific | Medium term (2-4 years) |
| Semiconductor geo-political supply-chain shocks | -1.4% | Global, Asia-Pacific focus | Short term (≤ 2 years) |
| Tariff volatility driving OEM relocation expense | -0.6% | North America, Europe | Short term (≤ 2 years) |
| Cloud migration cannibalising on-prem hardware spend | -0.9% | Global | Medium term (2-4 years) |
| Source: Mordor Intelligence | |||
Escalating e-waste regulation and disposal costs
The EU’s Waste Electrical and Electronic Equipment Directive now mandates 85% recycling by 2027, raising redesign and logistics costs for producers. California’s Right-to-Repair Act forces vendors to stock parts and manuals for seven years, reshaping product roadmaps. Customers factor disposal fees into the total cost of ownership, stretching refresh cycles. Microsoft extended its own PC life from four to five years to limit landfill volume. Vendors with modular chassis gain an edge, while planned obsolescence playbooks lose relevance.
Semiconductor geo-political supply-chain shocks
Export controls and subsidies disrupt chip availability. The U.S. CHIPS Act shifts foundry capacity but tightens near-term allocations. Taiwan still provides 63% of advanced fabrication, leaving the supply chain exposed to regional risks. Intel’s foundry expansion and AMD’s in-house system builds seek diversification yet need up to five years for full output. Enterprises hedge by double-sourcing CPUs, extending asset life, and keeping higher inventory, which inflates working capital needs and slows hardware rollouts.
*Our forecasts treat driver/restraint impacts as directional, not additive. The impact forecasts reflect baseline growth, mix effects, and variable interactions.
Segment Analysis
By Product Type: Servers Drive AI Infrastructure Transformation
Server revenue is growing at a 8.95% CAGR, the fastest in the IT hardware market, as enterprises adopt dense GPU nodes for AI model training. Dell logged USD 4.2 billion in Q3 2024 server sales on AI-centric builds. In contrast, PCs hold a 51.02% share but now experience elongated replacement cycles. Storage and networking follow server demand, adding bandwidth and low-latency links for AI clusters. Liquid cooling and vertically integrated racks blur traditional product boundaries. AMD’s acquisition of ZT Systems gives it custom design capacity, aligning with hyperscaler preference for bespoke units. Peripherals see steady demand from hybrid work, while edge gateways seed new micro-segments in industrial settings.
Hybrid architecture dominates server rooms. Enterprises pair x86 CPUs with accelerators, balancing cost and throughput. Energy efficiency has become a front-line buying criterion as utility tariffs climb. The IT hardware market size for servers is poised to expand steadily alongside AI deployment waves through 2031. Vendors capable of supplying turnkey racks with power and cooling subsystems protect margins against white-box alternatives.


By End User: Cloud Providers Accelerate Infrastructure Investments
Enterprises retained 47.25% of 2025 spending, yet cloud providers are set to outpace at a 17.05% CAGR. AWS alone devoted USD 12.7 billion in Q3 2024 to data-center and AI server capital outlays. Government buyers raise on-shore capacity to comply with sovereignty rules. Healthcare pivots to telemedicine and secure patient records, needing encrypted storage arrays. BFSI firms refresh endpoints to satisfy cyber-resilience audits. Manufacturing installs edge clusters for real-time production data, and media firms deploy 8K editing suites. Telecom operators integrate IT hardware into 5G core networks, preferring converged compute appliances.
Cloud leaders’ capex sets a high floor for server, switch, and storage demand, cushioning suppliers against cyclical dips. Enterprises, meanwhile, adopt hybrid IT, retaining in-house assets for regulated workloads. The IT hardware market benefits from both streams, yielding a balanced user-mix profile through the decade.
By Deployment Environment: Hybrid Strategies Balance Control and Scalability
On-premise estates still command 58.10% of the IT hardware market size in 2025. Financial institutions like JPMorgan keep core banking stacks on-site for latency and governance . Cloud instances grow fast where AI training and burst capacity are critical, achieving a 17.12% CAGR to 2031. Regulators push in-house control; the EU Digital Operational Resilience Act forces banks to retain operational authority, reinforcing hardware spend inside data halls. Workload placement now depends on compliance, latency, and cost rather than blanket cloud policies. Vendors sell identical server lines to both settings, allowing customers to move workloads without redesign.
Hybrid adoption sparks interest in plug-and-play rack kits that land in colo facilities. Edge clouds inside factories integrate with public cloud analytics. As a result, the IT hardware market captures revenue across multiple consumption models instead of losing sales to a single deployment pattern.
By Distribution Channel: Online Channels Democratize Enterprise Hardware Access
Direct OEM routes account for 44.70% of 2025 sales as large buyers demand custom builds and priority support. Yet online marketplaces post a 9.86% CAGR, opening the IT hardware market to small firms that once bought only refurbished gear. Amazon Business lists standardized server SKUs that meet common compliance baselines. System integrators pivot toward lifecycle services and vertical solutions rather than pure resell. Dell’s consumer-style e-store for AI PCs shows incumbents adapting to self-service buying habits.
Regional distributors bundle financing and managed services, especially vital in emerging markets. Online growth introduces price transparency, pressuring margins, but expands total addressable volume. Vendors maintain tiered models, protecting high-touch accounts while capturing long-tail digital demand.
Geography Analysis
North America contributed 37.40% revenue in 2025 thanks to early AI adoption and hyperscale expansion. Federal cloud programs and private-sector tech upgrades sustain steady refresh cycles. Enterprises embrace hybrid IT, driving balanced orders across PCs, servers, and network hardware. Sustainable design also gains traction, with vendors pitching energy-efficient racks to meet carbon targets.
Asia-Pacific leads growth at a 9.32% CAGR to 2031. Japan’s planned USD 35.4 billion in data-center spend underpins bulk purchases of GPU servers and liquid-cooling systems. India advances digital-public-goods frameworks, forcing domestic processing that enlarges local server capacity . China’s indigenous tech suppliers grab share amid trade tension, while Southeast Asian hubs like Singapore attract multi-national cloud builds. Manufacturing modernization multiplies edge-node deployment across the region, spreading demand beyond tier-one cities.
Europe posts moderate expansion anchored by regulatory compliance and sustainability incentives. Right-to-repair laws stimulate modular hardware demand, while data-sovereignty rules encourage regional assembly. Cloud data centers locate in Nordic countries for renewable energy, yet on-premise spend persists in banking and public services. Eastern Europe shows catch-up investment in PCs and network upgrades, adding a growth tail to the mature Western bloc.
Mordor Intelligence provides coverage of the it hardware market across other key regional markets. Detailed country-level analysis extends to India incorporating local coverage and market participation, as required.

Regulatory Landscape
Export controls, digital-market rules, and sustainability mandates continue to shape sourcing strategies and product roadmaps for global IT hardware vendors. In the United States, the Bureau of Industry and Security updated advanced-computing export control implementation through 2026 actions, including May 2026 guidance that clarified license requirements based on an entity's headquarters (including Country Group D:5 or Macau) even when shipments are routed elsewhere, which increases screening burden for GPU server and accelerator supply chains. Separately, US trade actions in January 2026 introduced an immediate 25% ad valorem duty on certain imported advanced computing chips and derivative products, adding landed-cost uncertainty for OEMs and channel partners.
In Europe, enforcement and technical specificity around the Digital Markets Act progressed in 2026. European Commission DMA proceedings (including Android interoperability and Google Search-related matters) translated obligations into more defined implementation requirements that can affect device ecosystems and enterprise interoperability choices. E-waste and circularity compliance remains material for endpoints and peripherals, and within the report scope EU WEEE targets (85% recycling by 2027) and right-to-repair obligations (for example, California requirements for parts and manuals retention) push OEMs toward modular designs and longer service support, with documented repairability shaping bill-of-materials, aftersales logistics, and warranty planning.
Value Chain Analysis
The IT hardware value chain runs from semiconductor design and wafer fabrication through advanced packaging, board and system assembly, OEM configuration, and then distribution via direct/OEM, integrators, VARs, and online channels. Upstream constraints remain concentrated in leading-edge foundry capacity and advanced packaging, and AI servers intensify this pressure due to demand for GPU or accelerator components and high-bandwidth interconnects. The shift toward higher-density racks and liquid-cooling-ready architectures increases dependencies on power delivery, thermal components, and validated rack-level designs, making interoperability and qualification cycles an important step between component suppliers and system OEMs.
Midstream, global EMS and ODM partners assemble and test systems, while large OEMs (for example, Dell, HP, and Lenovo) integrate CPUs and GPUs, storage, networking, firmware security, and lifecycle services into deployable platforms for enterprises and cloud providers. Regionalization is rising alongside resilience initiatives, highlighted by July 2026 commitments around US semiconductor manufacturing expansion in Arizona tied to TSMC investment, which reinforces the strategic role of domestic capacity and local supplier ecosystems for critical compute. Downstream, procurement continues to bifurcate: hyperscalers and large enterprises pursue direct engagement for custom racks and priority supply, while standardized SKUs expand via online channels, widening access for smaller buyers but raising price transparency and fulfillment expectations.
Competitive Landscape
Large vendors such as Dell Technologies, HP Inc., and Lenovo Group retain scale advantages through global logistics and full-stack portfolios. Dell pairs PowerEdge servers with NVIDIA or AMD accelerators, securing backlog worth several quarters of production. HP presses sustainable design, while Lenovo expands into enterprise storage via its Infinidat bid. NVIDIA moves upstream, packaging GPUs with networking into complete appliances sold through partners. AMD’s ZT Systems purchase grants instant access to hyperscaler custom builds.
Specialists challenge incumbents in niche segments. Cerebras markets wafer-scale AI engines bundled by Dell. Storage disruptors push NVMe-over-Fibre fabrics to unlock GPU throughput. Edge-focused firms design fanless micro-datacenters. Supply-chain resilience ranks high; vendors highlight multi-foundry silicon sourcing and local assembly to mitigate geopolitical shocks. Price competition persists, yet buyers increasingly reward lifecycle service and energy efficiency over sticker cost.
Consolidation looms as integrated solutions beat stand-alone products. Alliances blossom around shared reference architectures. Market leaders invest in firmware security and predictive support software that anchors long-term customer lock-in. The resulting competitive field blends hardware, software, and services, raising entry barriers for newcomers without broad stacks.
IT Hardware Industry Leaders
HP Inc.
Samsung Electronics Co. Ltd.
Intel Corporation
Dell Technologies Inc.
Acer Inc.
- *Disclaimer: Major Players sorted in no particular order

Market Opportunities and Future Outlook
AI infrastructure build-outs are expanding the addressable opportunity for integrated server, storage, and networking platforms that arrive as qualified rack-level systems rather than discrete components. Evidence of the supply-side response includes July 2026 semiconductor and packaging capacity actions across multiple regions, such as TSMC expanding US manufacturing commitments, Micron advancing its Clay, New York fab construction, Intel commencing a major investment at its Leixlip campus in Ireland, and Tower Semiconductor announcing an expansion program in Japan that includes silicon photonics and advanced packaging support. These moves point to market space for OEMs and component suppliers to convert new silicon availability into complete, deployment-ready systems with validated cooling and power designs for high-density data center environments.
A second whitespace is lifecycle, compliance, and circularity services linked to tightening e-waste and right-to-repair obligations, where vendors can differentiate through modular chassis, parts availability, and verified recycling or take-back logistics. On the demand side, Windows 10 end-of-support in October 2025 continues to pull forward endpoint refresh decisions into 2026 procurement cycles, while data-sovereignty frameworks (for example, India national data governance direction referenced in the report context) support in-country compute deployments that require compliant servers, storage, and network hardware. Short component lead times and limited buffers around memory, transceivers, and switching also elevate the value of supply assurance, multi-sourcing, and configuration standardization, leaving room for OEMs, distributors, and integrators that can guarantee availability and accelerate time-to-install for enterprises and cloud operators.
Recent Industry Developments
- July 2026: Intel expanded its collaboration with Google Cloud to deploy Gemini Enterprise as part of a broader enterprise transformation push. The move reinforces the shift among major hardware suppliers toward bundling silicon platforms with cloud and AI software ecosystems that influence enterprise hardware refresh and deployment choices.
- June 2026: HP announced a strategic partnership with OpenAI to integrate the Frontier platform into HP operations. This strengthens HPs positioning around AI-enabled workflows and device experiences, supporting differentiation in enterprise endpoints and managed experiences alongside traditional hardware specifications.
- April 2026: Intel repurchased a 49% equity interest in its Ireland Fab 34 joint venture from Apollo for USD 14.2 billion. The transaction increases Intels control over a critical European manufacturing asset and supports supply assurance narratives for enterprise and data-center hardware platforms dependent on advanced CPU roadmaps.


Research Methodology Framework and Report Scope
Market Definition and Coverage
For this report, the global IT hardware market is defined as the value of physical computing and connectivity equipment sold to end users through direct and channel routes, across enterprise and public-sector demand worldwide.
Scope exclusions: Pure software, IT services, and telecom services are excluded from this market sizing.
Segmentation Overview
- By Product Type
- PC Client Devices
- Servers
- Storage Devices
- Networking Hardware
- Peripherals and Accessories
- Edge and IoT Gateways
- By End User
- Enterprise
- Government and Public Sector
- BFSI
- Healthcare
- Education
- Media and Entertainment
- Cloud Service Providers
- Telecom Operators
- Manufacturing and Industrial
- By Deployment Environment
- On-Premise
- Cloud
- By Distribution Channel
- Direct / OEM
- System Integrators
- Value-Added Resellers
- Online Retail
- By Geography
- North America
- United States
- Canada
- Mexico
- South America
- Brazil
- Argentina
- Colombia
- Rest of South America
- Europe
- Germany
- United Kingdom
- France
- Italy
- Spain
- Russia
- Netherlands
- Rest of Europe
- Asia-Pacific
- China
- Japan
- South Korea
- India
- Australia
- Singapore
- Rest of Asia-Pacific
- Middle East and Africa
- Middle East
- Saudi Arabia
- United Arab Emirates
- Rest of Middle East
- Africa
- South Africa
- Egypt
- Rest of Africa
- Middle East
- North America
Data Sources, Market Sizing, and Validation
Desk Research
Desk research helped us build the starting structure of the market and set realistic guardrails for volumes, trade flows, and price direction. We referred to public sources such as the U.S. International Trade Commission trade statistics, UN Comtrade, OECD ICT indicators, and World Bank macro series to understand regional demand signals and import dependence. For enterprise deployment context, we also reviewed standards and policy notes from bodies such as NIST, plus government publications that track digital infrastructure spend.
To connect these signals to company activity, we used annual reports, earnings transcripts, investor presentations, and reputable press coverage to track category mix shifts and cycle drivers, including PC refresh timing and data center expansion. Where needed, we used paid subscriptions for company financials and intelligence, patent databases, and shipment-level import and export records to validate supplier footprints and ASP direction without relying on any one dataset. The sources listed above are illustrative only, and many other public documents and datasets were also used for collection, cross-checking, and clarification.
Primary Interviews and Surveys
Primary work was used to pressure-test our assumptions on demand timing, channel markups, and price movements across the main hardware categories before the final totals were locked. We spoke with a mix of OEM and channel-side participants, large buyers, integrators, and domain specialists across APAC, EMEA, and the Americas, so the model reflects regional buying patterns and different procurement routes.
Distribution of primary research fieldwork respondents
| Company type | Respondent position | Region |
|---|---|---|
| Top tier: 31% | CXOs: 13% | APAC: 51% |
| Mid tier: 53% | Functional/Unit leaders: 40% | EMEA: 31% |
| Smaller Players: 16% | Managers: 47% | Americas: 18% |
Market-Sizing & Forecasting
Market sizing starts from a top-down build where IT hardware demand is reconstructed using a demand pool view by region, and then filtered through category shares for PCs and workstations, servers, storage devices, and networking hardware. In practice, variables like enterprise device replacement cycles, data center capacity additions, server and storage attach rates, networking port upgrades, and average selling price movement were used to keep the totals anchored to observable signals. Where public data is thin, we handled gaps by using conservative ranges that were validated through interviews, then adjusted only when multiple inputs pointed in the same direction.
After the top-down totals were formed, we ran selective bottom-up checks using sampled supplier roll-ups, channel checks, and ASP multiplied by shipment proxies for key categories. This helped spot over-counting and double-counting between direct and indirect routes. For forecasting, we used scenario analysis supported by short time-series smoothing on category growth rates. The final path was guided by expert views on refresh timing, cloud and edge infrastructure buildout, and the pace of price normalization. When the model showed sharp swings, we re-reviewed the assumptions so the end result stayed explainable and repeatable.
Data Validation & Update Cycle
Validation was done through step-by-step triangulation across independent signals, and we checked for variances that did not match common market behavior, such as sudden category shifts without a matching demand driver. Outputs were compared against proxy metrics like shipment trends from trade data, public capex commentary, and category-level pricing direction, followed by a second review focused on arithmetic consistency across regions and types. If a variance exceeded what interviews suggested was realistic, we re-contacted sources and re-ran the sensitivity ranges before sign-off.
Reports are refreshed annually, and interim updates are made when material events occur that can change demand or pricing in a meaningful way. Before delivery, an analyst performs a final pass so clients receive the most current view based on the latest public releases and newly completed checks.
Mordor Intelligence's Global IT Hardware Market Size Compared Against Other Published Estimates
Published numbers for global IT hardware can look far apart because each publisher draws the market box differently, and they do not always treat services, consumer devices, and component revenue in the same way. We also see gaps when one estimate is spending-based and another is shipment-based, which can shift results quickly in years with price volatility.
Consumer smartphones and consumer telecom services sit outside Mordor Intelligence's scope here, which is a common reason why broader IT spend trackers report much larger hardware or total IT figures. Other differences usually come from whether peripherals and gateways are counted, whether security hardware is bundled into networking, how channel markups are treated, and whether the timing uses calendar-year exchange rates or a rolling 12-month view.
Benchmark comparison
| Source | Market Size | Gaps in Research Methodology |
|---|---|---|
| Mordor Intelligence | USD 152.13 B (2026) | |
| Tech Spend Tracker A | USD 579.70 B (2025) | Often reported as enterprise IT hardware spend with a wider hardware basket, and it can follow a rolling period rather than a clean calendar year, which raises totals versus a narrower equipment-only definition. |
| Industry Portal B | USD 475.36 B (2024) | Typically mixes consumer and enterprise hardware and may include adjacent electronics or broader device revenue, with limited clarity on channel treatment and category inclusions. |
The spread in the table is mainly explained by how wide the hardware basket is and whether the metric is spend-based versus a tighter equipment market definition. By keeping inclusions explicit and checking totals against observable demand signals, the final number stays traceable to clear inputs and can be updated consistently as new information becomes available.


Key Questions Answered in the Report
How large is the IT hardware market in 2026?
The IT hardware market size is valued at USD 152.13 billion in 2026.
What is the projected growth rate through 2031?
Market revenue is forecast to rise at a 7.78% CAGR, reaching USD 221.34 billion by 2031.
Which product segment grows fastest?
Servers post the highest CAGR of 8.95% as enterprises deploy AI-ready infrastructure.
Why are cloud providers important hardware buyers?
Cloud service providers expand data centers rapidly, showing a 17.05% CAGR for hardware spend to host AI and high-performance workloads.
How does regulation affect hardware demand?
Windows 10 end-of-support and new e-waste rules push PC refresh cycles while mandating recyclable designs, shaping vendor roadmaps.
Which region is the main growth engine after 2025?
Asia-Pacific leads with a 9.32% CAGR due to manufacturing modernization and sovereign cloud investments.
Page last updated on:


