
Market Overview
| Study Period | 2021 - 2031 |
|---|---|
| Market Size (2026) | USD 3.03 Billion |
| Market Size (2031) | USD 4.28 Billion |
| Growth Rate (2026 - 2031) | 7.12 % |
| Fastest Growing Market | Asia Pacific |
| Largest Market | North America |
| Market Concentration | Medium |
Major Players *Disclaimer: Major Players sorted in no particular order Image © Mordor Intelligence. Reuse requires attribution under CC BY 4.0. | |
Insoluble Dietary Fibers Market Analysis by Mordor Intelligence
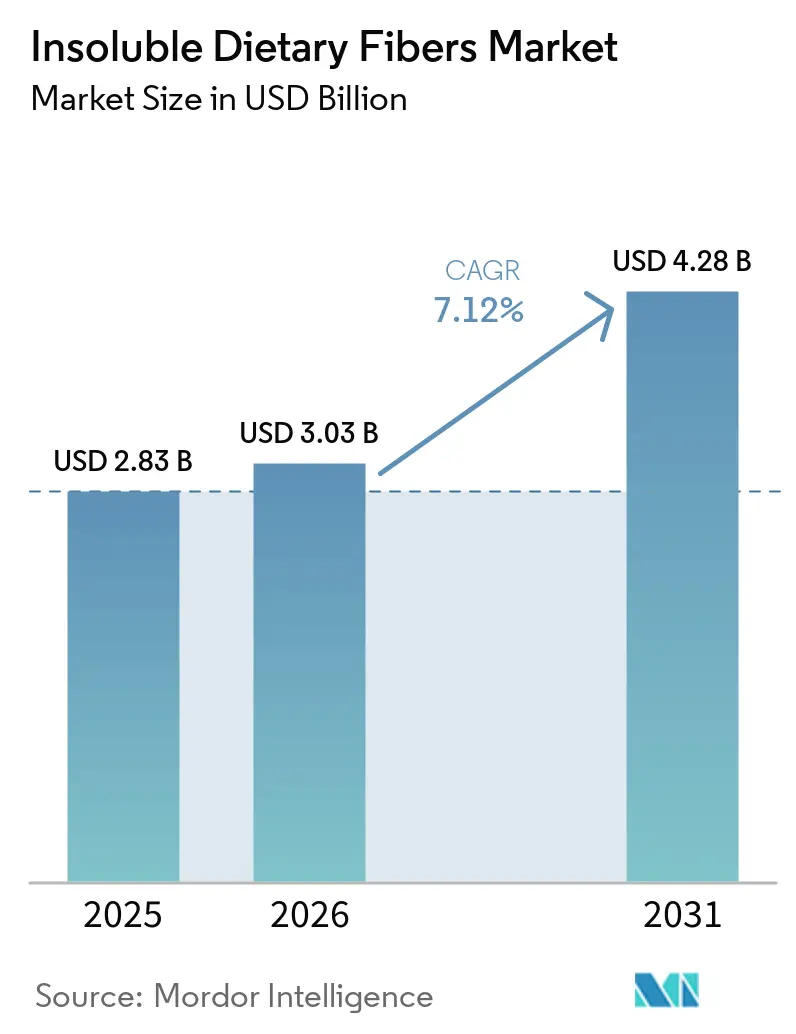
The global insoluble dietary fibers market size was valued at USD 2.83 billion in 2025 and estimated to grow from USD 3.03 billion in 2026 to reach USD 4.28 billion by 2031, at a CAGR of 7.12% during the forecast period (2026-2031). People's growing awareness of health benefits and wellness has driven this growth, alongside regulatory changes and technological developments. When the FDA revised its "healthy" claim criteria in December 2024 to focus on fiber-rich and nutrient-dense foods, it opened new doors for food companies to improve their products' nutritional value [1]. Food scientists have developed better processing methods, such as heat-moisture treatments, citric-acid modifications, and granular engineering, making it easier to use insoluble fibers in different foods. As more people look for foods that support their digestive health, help manage weight, and contain clearly labeled ingredients, the market continues to expand.
Key Report Takeaways
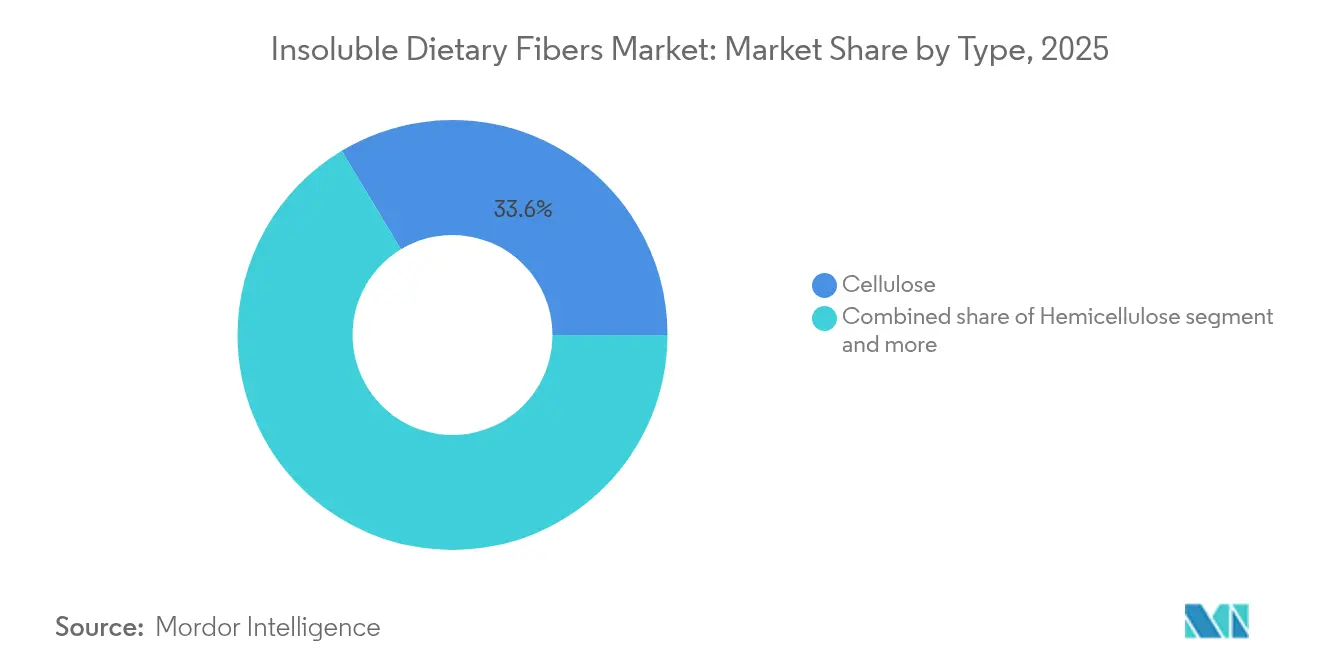
- By type, cellulose led with 33.62% of the 2025 insoluble dietary fibers market share and resistant starch is set to post a 9.52% CAGR from 2026-2031.
- By form, powder held 58.61% share in 2025, while granules will grow the fastest at a 9.63% CAGR through 2031.
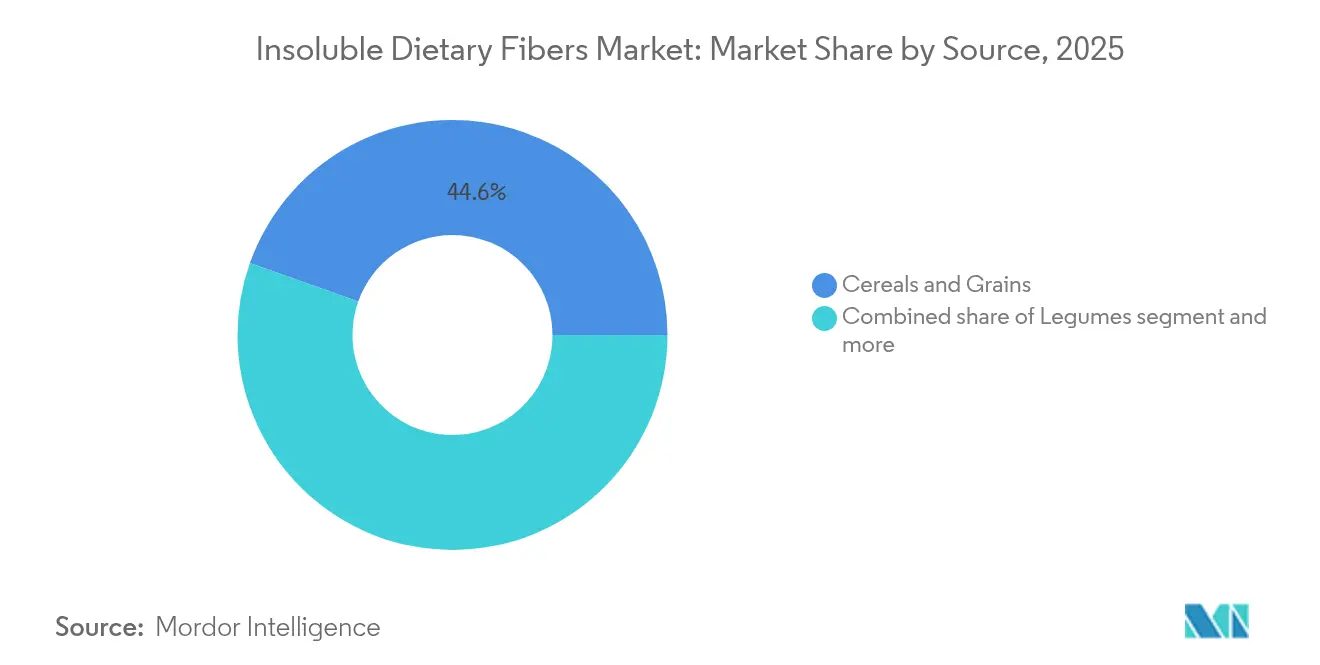
- By source, cereals and grains captured 44.57% share in 2025; legume-based fibers are predicted to register a 9.88% CAGR over the forecast period.
- By application, functional food and beverages commanded 47.71% share in 2025, whereas animal feed is projected to expand at a 9.74% CAGR to 2031.
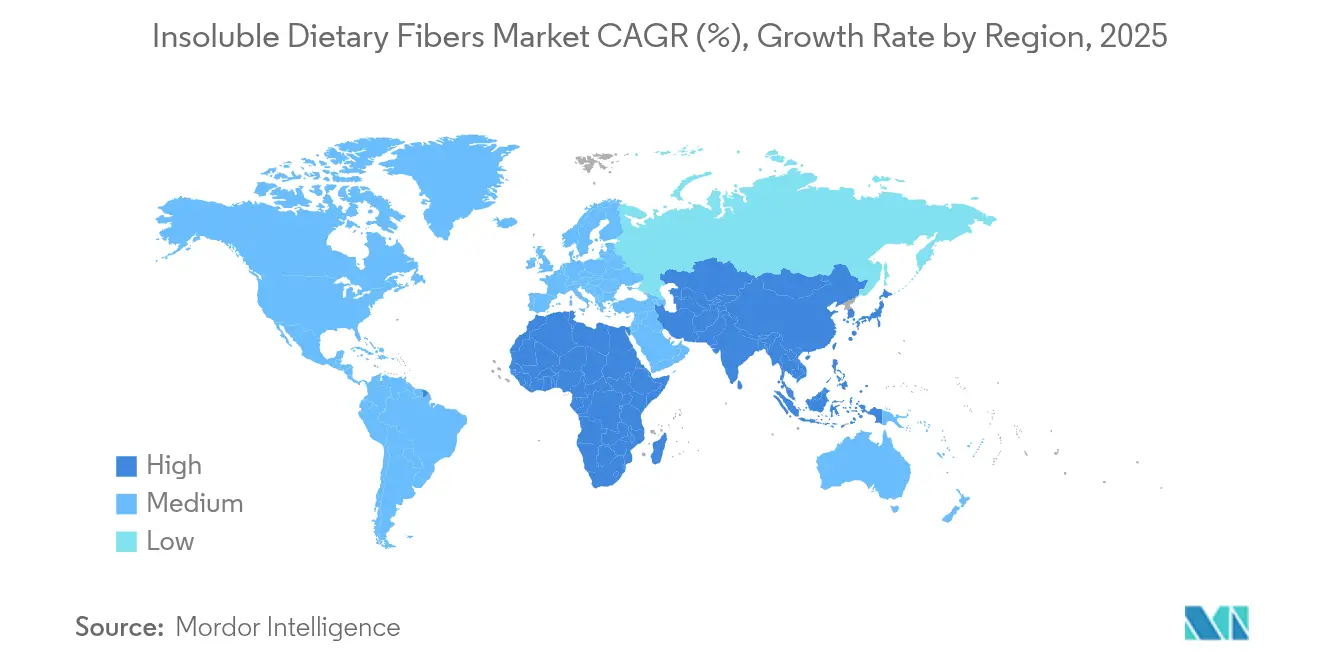
- By geography, North America accounted for 32.58% of revenue in 2025 and Asia-Pacific is forecast to advance at a 9.91% CAGR during 2026-2031.
Note: Market size and forecast figures in this report are generated using Mordor Intelligence’s proprietary estimation framework, updated with the latest available data and insights as of 2026.
Global Insoluble Dietary Fibers Market Trends and Insights
Drivers Impact Analysis*
| Driver | (~) % Impact on CAGR Forecast | Geographic Relevance | Impact Timeline |
|---|---|---|---|
| Growing demand for functional food and beverages | +1.8% | Global, with North America and Europe leading | Medium term (2-4 years) |
| High-fiber formulations in bakery and snack products | +1.2% | North America and Europe, expanding to Asia-Pacific | Short term (≤ 2 years) |
| Regulatory support for fiber-rich product claims | +1.0% | Global, with varying implementation timelines | Long term (≥ 4 years) |
| Clean-label and plant-based diet momentum | +1.5% | North America and Europe core, spill-over to Asia-Pacific | Medium term (2-4 years) |
| Expansion in Nutraceuticals and Supplements | +0.9% | Global, with premium markets leading | Medium term (2-4 years) |
| Fiber-enhanced antibiotic-free animal feed innovations | +0.7% | Global, with early adoption in developed markets | Long term (≥ 4 years) |
| Source: Mordor Intelligence | |||
Growing Demand for Functional Food and Beverages
As consumers become increasingly mindful of their health beyond basic nutrition, they now seek products with targeted functional benefits. This shift in consumer behavior has encouraged manufacturers to enhance their products with higher fiber content. The FDA's revised "healthy" claim criteria, which will take effect in February 2025, establishes specific fiber thresholds while limiting added sugars and sodium, creating a clear pathway for manufacturers to fortify their products. The beverage market demonstrates this evolution, with companies like Olipop offering drinks containing 9 grams of fiber per serving and gaining significant market acceptance. This transformation now reaches protein drinks, plant-based milks, and functional juices, indicating a broader market evolution. The alignment between health claim regulations and consumer preferences continues to drive sustainable growth in insoluble fiber applications across the functional food landscape.
High-Fiber Formulations in Bakery and Snack Products
Bakery and snack manufacturers understand the evolving needs of their consumers and have responded by incorporating insoluble fibers into their products. This approach addresses the growing consumer desire for products that offer both indulgence and health benefits. Recent technological advances have made it possible to integrate these fibers seamlessly while preserving the taste and texture that consumers expect [2]. Through heat-moisture treatments and acid modifications, manufacturers can now increase resistant starch content while maintaining product quality. The industry has witnessed significant progress in developing chemically modified fibers that provide sweetness, with companies such as ZeroIN introducing fiber-based sweetening solutions that enhance both taste and nutritional value. In the realm of citrus fiber applications, Cargill's CitriPure, comprising 40% soluble and 60% insoluble fiber, delivers effective moisture control and emulsification benefits in bakery applications. These ingredients resonate with consumers seeking clean-label products, as their production requires only water and energy. The introduction of granular forms has enhanced manufacturing efficiency by improving dispersibility and ensuring consistent processing across automated production lines.
Regulatory Support for Fiber-Rich Product Claims
The regulatory environment has become more favorable for companies developing fiber-rich products, as authorities have updated health claim authorizations and simplified approval processes. This positive shift creates opportunities for manufacturers who focus on fiber fortification. The European Food Safety Authority's novel food guidance, which takes effect in February 2025, offers a more accessible application process while ensuring robust safety standards, making it easier for companies to introduce new fiber ingredients to the market [3]. The standardization of fiber definitions across different regions has reduced regulatory complexities for global manufacturers and fostered innovation in fiber extraction and processing methods.
Clean-Label and Plant-Based Diet Momentum
The demand for naturally derived insoluble fibers is increasing due to consumer preferences for recognizable and minimally processed ingredients. These fibers, extracted from food waste streams and agricultural byproducts, serve multiple purposes. Sugar beet pulp fibers are gaining importance in nutritional supplements because of their anti-inflammatory properties and gut health benefits. Recent enzyme developments have improved the fiber separation process [4]. The growth in plant-based diets has increased the need for fiber-rich ingredients that improve texture and nutritional content in meat and dairy alternatives. These ingredients align with circular economy principles, offering both environmental benefits and cost advantages through waste stream utilization.
Restraints Impact Analysis*
| Restraint | (~) % Impact on CAGR Forecast | Geographic Relevance | Impact Timeline |
|---|---|---|---|
| Fluctuations in Raw-material prices | -0.8% | Global, with commodity-dependent regions most affected | Short term (≤ 2 years) |
| Organoleptic and textural challenges in formulations | -0.6% | Global, with premium markets showing higher sensitivity | Medium term (2-4 years) |
| Competition from soluble-fiber prebiotics | -0.4% | North America and Europe primarily, expanding globally | Medium term (2-4 years) |
| Regulatory definition and analytical-method divergences | -0.3% | Global, with emerging markets most impacted | Long term (≥ 4 years) |
| Source: Mordor Intelligence | |||
Fluctuations in Raw-Material Prices
Price volatility in commodities significantly affects insoluble fiber production costs, as agricultural input prices fluctuate due to weather patterns, geopolitical tensions, and supply chain disruptions, reducing manufacturer margins. The geographic concentration of cellulose and hemicellulose sources creates supply vulnerabilities, especially for manufacturers relying on single-source procurement. While long-term supply contracts provide price stability, they restrict the ability to leverage favorable market conditions or alternative sourcing options. Alternative feedstock sources, such as food waste streams and agricultural byproducts, offer potential solutions but require substantial investments in processing infrastructure and quality standardization.
Organoleptic and Textural Challenges in Formulations
The acceptance of citrus fiber in food products faces challenges related to taste, texture, and mouthfeel, especially when fiber content is higher than traditional levels or substitutes conventional ingredients. Product developers must carefully balance the water-binding properties of citrus fiber with consumer acceptance, as high fiber concentrations can result in grittiness or affect product stability. Clean-label products require achieving comparable sensory qualities to conventional products without using masking agents or artificial additives. Consumer adoption depends on understanding fiber benefits while overcoming resistance to texture changes, particularly in indulgent food categories where taste and texture influence purchasing behavior.
*Our forecasts treat driver/restraint impacts as directional, not additive. The impact forecasts reflect baseline growth, mix effects, and variable interactions.
Segment Analysis
By Type: Cellulose Leadership Faces Resistant Starch Innovation
The dietary fiber market is dominated by cellulose, which holds a 33.62% market share in 2025. This dominance is attributed to well-established global supply chains, consistent raw material availability, and proven effectiveness across food, beverage, and pharmaceutical applications. The widespread use of cellulose in products like bakery items, dairy alternatives, and dietary supplements further reinforces its market position. Resistant starch represents the market's fastest-growing segment, with an expected CAGR of 9.52% through 2031, driven by increasing consumer awareness of its prebiotic properties and its role in blood sugar management.
Cellulose's market position benefits from extensive regulatory approvals and manufacturing infrastructure, including the July 2024 FDA approval for ethyl cellulose in animal feed applications. Hemicellulose maintains its presence in industrial applications and animal feed formulations, while lignin gains market share in packaging and bioplastic applications. Chitin and chitosan segments continue to serve pharmaceutical and cosmetic applications through their bioactive and antimicrobial properties.

By Form: Powder Dominance Challenged by Granule Efficiency
The powder form dominates the market with a substantial 58.61% share in 2025, benefiting from its widespread versatility and well-established processing infrastructure. While powder maintains its strong position, the granular form is experiencing significant momentum, advancing at a 9.63% CAGR as manufacturers recognize its advantages in handling and processing efficiency.
In practical applications, powder forms demonstrate exceptional performance where fine dispersion and seamless texture integration are essential, making them particularly valuable in beverage and supplement formulations where particle size directly influences consumer satisfaction. The granular form, on the other hand, offers distinct advantages in controlled release and sustained functionality, utilizing precisely engineered particle sizes to achieve targeted delivery across both food and feed applications.
By Source: Cereals Dominance Meets Legume Sustainability
Cereals and grains continue to dominate the market with a substantial 44.57% market share in 2025. This leadership position stems from the industry's robust agricultural foundation and sophisticated processing facilities. In a notable development, legumes have emerged as the most promising segment, achieving a remarkable growth rate of 9.88% CAGR, primarily due to increasing environmental consciousness and opportunities in protein extraction.
The cereal segment has effectively integrated byproducts from wheat, rice, and corn processing into its operations, particularly in the innovative production of xylo-oligosaccharides from wheat straw waste. Within the fruits and vegetables category, manufacturers have focused their efforts on utilizing citrus peels and other processing waste materials. A prime example is Cargill's development of CitriPure, which transforms citrus peel waste through an efficient water and energy-based extraction process.
By Application: Functional Foods Lead While Animal Feed Accelerates
The functional food and beverage segment commands a substantial 47.71% market share in 2025, reflecting a growing consumer focus on health and wellness, supported by regulatory frameworks that encourage fiber-rich product development. The animal feed sector exhibits remarkable growth potential, with projections indicating a 9.74% CAGR through 2031. Within the functional food category, manufacturers are responding to the FDA's updated "healthy" claim guidelines, meeting consumer demands for products that support digestive health and weight management. The dietary supplement market maintains its position as a premium segment, offering specialized formulations that target specific health outcomes. In parallel, personal care and cosmetics manufacturers incorporate fiber for its practical texturizing and absorbent properties, while pharmaceutical companies utilize it for controlled-release mechanisms and binding applications.
The expansion in animal feed applications reflects a significant industry transformation, driven by widespread regulatory acceptance of cellulose-based additives and the industry's strategic shift toward antibiotic-free production systems. This growth is further supported by EFSA's comprehensive safety validation of cellulose derivatives across all animal species, opening opportunities in European markets, while FDA approvals for ethyl cellulose create new possibilities for North American producers.
Geography Analysis
The North American region continues to dominate the global market, commanding a substantial 32.58% share in 2025. This leadership position stems from the region's well-established regulatory frameworks and mature functional food markets. The market thrives on the FDA's forward-thinking approach to fiber regulation, which has fostered strong consumer understanding and acceptance of functional foods. This has created a stable demand environment for fiber ingredients. Meanwhile, European markets have carved their niche by emphasizing clean-label products and sustainability credentials, supported by EFSA's updated novel food guidance that balances innovation with safety standards. South American markets have strategically positioned themselves by focusing on agricultural processing efficiency and export opportunities, capitalizing on their abundant raw material resources.
The Asia-Pacific region has emerged as the most dynamic market, achieving an impressive growth rate of 9.91% CAGR. This remarkable expansion reflects significant demographic shifts, modernizing regulations, and increasing health consciousness across its diverse markets. Japan stands out with its implementation of specific insoluble dietary fiber intake guidelines, which has created structured demand for fiber-fortified products. This market potential is exemplified by strategic partnerships such as The Healthy Grain's collaboration with Itochu Corporation.
The European market operates under EFSA's stringent substantiation rules, which, while initially slowing market entry, ultimately foster higher consumer trust in approved products. The region's aging population, combined with rising costs for orthopedic procedures, has positioned nutritional products as cost-effective alternatives to surgical interventions. Germany and Italy lead in per-capita spending on joint-health supplements, while Scandinavian countries pioneer innovative fortified dairy products featuring marine collagen peptides.
Regulatory Landscape
Regulation for insoluble dietary fibers centers on how ingredients qualify and are declared as dietary fiber on labels, as well as route-to-market approvals for novel or modified fibers. In the United States, the FDA definition of dietary fiber under 21 CFR 101.9(c)(6)(i) covers non-digestible carbohydrates (soluble and insoluble) and lignin intrinsic and intact in plants. Isolated or synthetic non-digestible carbohydrates must demonstrate beneficial physiological effects to be counted as dietary fiber on Nutrition Facts and Supplement Facts labels, and FDA guidance and Q&A materials also outline how specific fibers are evaluated and listed for compliance.
In the European Union, market access for certain fiber ingredients can depend on the Novel Food framework (Regulation (EU) 2015/2283) and subsequent Commission Implementing Regulations that update authorizations and specifications. For example, Commission Implementing Regulation (EU) 2024/1027 (8 April 2024) amended specifications for the novel food galacto-oligosaccharide, and Commission Implementing Regulation (EU) 2026/1219 authorized inulin-propionate ester with time-limited, entity-specific placement on the EU market starting 30 June 2026. Together, these mechanisms affect product design (fiber type and substantiation package), label strategy, and launch sequencing across geographies.
Value Chain Analysis
The insoluble dietary fibers value chain begins with feedstock sourcing from agricultural and food-processing streams, with inputs including cereal brans (wheat, rice, corn), legume hulls, and fruit and vegetable pomace, along with wood-pulp related streams for cellulose-rich inputs. Upstream availability and pricing track commodity cycles and the geographic concentration of processing infrastructure, including the United States, Germany, and China. This makes multi-origin sourcing, contracting, and quality standardization important for cost and continuity.
Midstream steps include fiber extraction and purification (mechanical fractionation, enzymatic or chemical modification where applicable), drying and granulation (powder and granule forms), and documentation for regulatory and customer acceptance, such as identity and purity, alongside label compliance aligned with the FDA dietary fiber definition and, where relevant, novel food dossiers in the EU. Downstream, ingredient suppliers and distributors sell into functional food and beverage, bakery and snacks, dietary supplements, and animal feed manufacturers, where application labs and co-development support drive value-adds. Constraints in the chain include variability in byproduct composition and sensory and texture impacts at higher inclusion rates, as well as rising traceability and sustainability disclosure requirements in premium markets.
Competitive Landscape
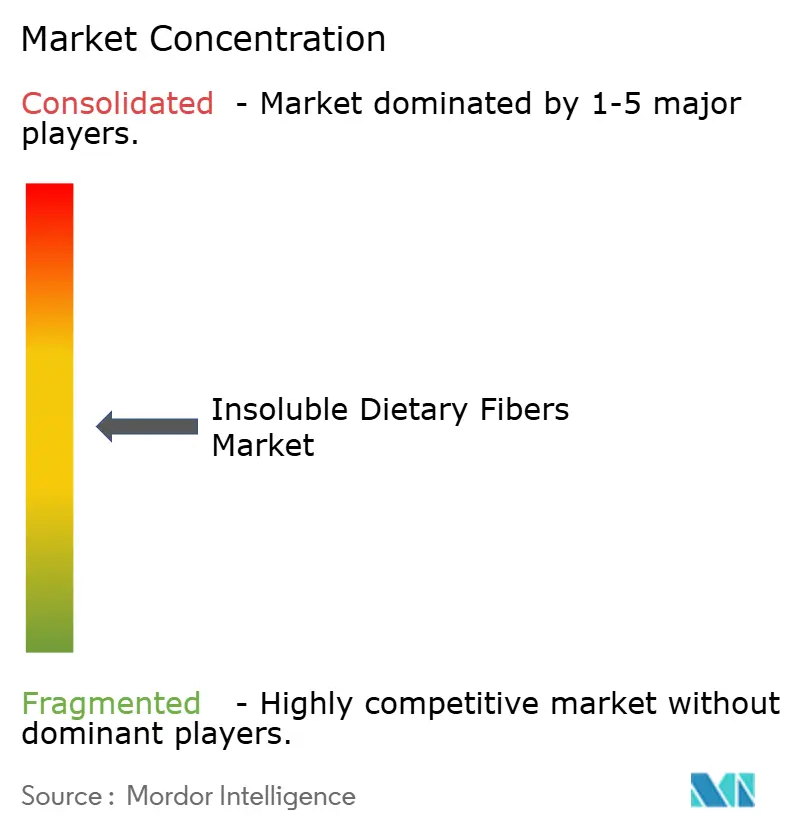
The insoluble dietary fibers market is moderately fragmented, reflected in a concentration. Large companies leverage their distribution networks, regulatory compliance, and financial resources to secure supply contracts with food and feed manufacturers across multiple regions. Smaller and mid-sized companies focus on specialized processing methods, product customization, and local agricultural partnerships to serve specific market segments, including organic certification and regional feed formulations.
Smaller and mid-sized companies compete by offering agile operations, technical customization capabilities, and traceable local sourcing. These companies provide tailored solutions that address regional taste preferences and specific formulation requirements. The growing demand for antibiotic-free livestock feed and personalized nutrition products targeting glycemic control, satiety, and microbiome health has created opportunities for differentiation.
White-space opportunities center on antibiotic-free livestock feed and personalized-nutrition products that address specific metabolic needs. Market leaders leverage global distribution, regulatory dossiers, and financial strength, while smaller players carve niches through specialized know-how, speed, and localized sourcing.
Insoluble Dietary Fibers Industry Leaders
-
Cargill, Incorporated
-
Grain Processing Corporation
-
Ingredion Incorporated
-
J. Rettenmaier & Söhne GmbH + Co KG
-
InterFiber Ltd.
- *Disclaimer: Major Players sorted in no particular order
Market Opportunities and Future Outlook
Opportunities are concentrated in fiber fortification programs that help brands meet stricter nutrient-positioning and labeling requirements while preserving eating quality in mainstream formats. The FDA revised the "healthy" claim criteria in December 2024, with the updated approach taking effect in February 2025, which is pushing product teams toward fiber-forward reformulation in snacks, beverages, and staple categories where insoluble fibers can add bulk, improve texture, and support satiety-oriented positioning.
On the supply side, new capacity and commercialization moves point to whitespace for differentiated fiber types and formats. In June 2026, ClonBio Foods announced plans to build a commercial-scale facility for native corn arabinoxylan fiber (FibAX) at Dunaföldvár, Hungary, expanding an additional industrial pathway for cereal-derived fibers beyond conventional bran streams. Portfolio expansion through launches and M&A also supports this direction, including Ingredion extending clean-label citrus fiber offerings (FIBERTEX line) and pursuing prebiotic-fiber assets, which reinforces demand for upcycled feedstocks (citrus peel, carrot pomace) and for engineered forms (granules and application-ready systems) that reduce dust, improve dispersibility, and simplify adoption across automated manufacturing lines.
Recent Industry Developments
- June 2026: Ingredion announced the acquisition of Benicaros, a prebiotic fiber derived from upcycled carrot pomace, expanding its fiber and functional ingredients portfolio. The move strengthens its positioning in value-added fibers that can support low-dose formulation strategies and upcycling narratives for brand customers.
- June 2026: Ingredion announced a recommended all-cash offer to acquire Tate & Lyle PLC, aiming to broaden its specialty ingredients platform across sweetening, texture, and fortification solutions. If completed, the combination increases scale and cross-selling leverage in fiber-enabling systems used by global food and beverage manufacturers.
- September 2024: Ingredion expanded its clean-label citrus fiber portfolio in Asia-Pacific with the introduction of FIBERTEX CF 500 and FIBERTEX CF 100 after earlier regional rollouts. The products, derived from upcycled citrus peels and positioned as minimally processed ingredients, support formulation use cases such as viscosity, gelling, and emulsion stability that help drive wider adoption of fiber-fortified foods and beverages.
Research Methodology Framework and Report Scope
Market Definition and Coverage
For this study, the insoluble dietary fibers market covers commercially sold insoluble fiber ingredients used to add fiber content and functional benefits in end products, measured by revenue across the supply chain for food, supplement, pharma, feed, and adjacent uses.
Scope exclusions: We exclude soluble-only fibers and finished consumer products where fiber is not sold as an ingredient input.
Segmentation Overview
- By Type
- Cellulose
- Hemicellulose
- Lignin
- Chitin and Chitosan
- Resistant Starch
- By Form
- Powder
- Granules
- Others
- By Source
- Fruits and Vegetables
- Cereals and Grains
- Legumes
- Others
- By Application
- Functional Food and Beverages
- Dietary Supplements
- Animal Feed
- Personal Care and Cosmetics
- Pharmaceuticals
- By Geography
- North America
- United States
- Canada
- Mexico
- Rest of North America
- Europe
- Germany
- France
- United Kingdom
- Spain
- Netherlands
- Italy
- Sweden
- Poland
- Belgium
- Rest of Europe
- Asia-Pacific
- China
- India
- Japan
- Australia
- South Korea
- Indonesia
- Thailand
- Singapore
- Rest of Asia-Pacific
- South America
- Brazil
- Argentina
- Chile
- Colombia
- Peru
- Rest of South America
- Middle East and Africa
- United Arab Emirates
- South Africa
- Nigeria
- Saudi Arabia
- Egypt
- Morocco
- Turkey
- Rest of Middle East and Africa
- North America
Data Sources, Market Sizing, and Validation
Desk Research
Desk research was used to set the fact base and keep assumptions realistic before we built the model. We reviewed public nutrition and labeling guidance and intake benchmarks (for example, from the FDA and EFSA), along with food composition references and safety opinions that clarify what is counted as dietary fiber.
To shape demand and production context, we also checked sources such as FAOSTAT for crop and processing-linked indicators, UN Comtrade for trade flows tied to key source crops and inputs, and publications from trade bodies focused on grains, pulses, and food ingredients. Company filings, investor presentations, and reputable press were used to understand capacity moves, pricing direction, and application focus. Then we referenced paid subscriptions for company financials and patents selectively to validate timelines and technology activity. These sources are illustrative only, and many additional public and paid references were used to collect, cross-check, and clarify data points.
Primary Interviews and Surveys
Primary work focused on validating how insoluble fibers are specified, priced, and adopted across key applications, and on pressure-testing what we learned from desk sources. We spoke with ingredient-side participants, distributors, and downstream formulators in functional foods, dietary supplements, pharma, and feed across APAC, EMEA, and the Americas, so assumptions on mix, pricing, and substitution could be confirmed and gaps could be closed.
Distribution of primary research fieldwork respondents
| Company type | Respondent position | Region |
|---|---|---|
| Top tier: 25% | CXOs: 14% | APAC: 47% |
| Mid tier: 59% | Functional/Unit leaders: 34% | EMEA: 30% |
| Smaller Players: 16% | Managers: 52% | Americas: 23% |
Market-Sizing & Forecasting
Sizing started from a top-down build where production and trade signals for key source groups were used to reconstruct the addressable ingredient pool, then adjusted using application penetration and typical inclusion-rate ranges for fiber fortification. The totals were corroborated with selective bottom-up checks, such as sampled supplier revenue bands by region and application, plus volume times average selling price cross-checks for common fiber forms.
A few inputs drove the result most, including the split of demand by functional food and beverage, supplements, pharmaceuticals, and feed, the mix by source (cereals and grains, fruits and vegetables, legumes), and the form factor (powder versus granules), since it shifts pricing and use rates. We tracked pricing movement through contract renewal behavior, fortification and labeling trends that influence reformulation cycles, and regional consumption patterns linked to packaged food growth. When bottom-up data was thin for smaller countries or niche applications, we used ratio-based proxies anchored to clearer regional totals, then tested the implied per-capita and per-output intensity for reasonableness.
Forecasts were built using scenario analysis supported by a light multivariate regression layer, where demand was linked to packaged food output, supplement category growth, and source-crop availability signals. The final path was aligned to what interviewees expected for adoption speed and price progression.
Data Validation & Update Cycle
Outputs were checked through multiple passes so the numbers stayed consistent with real-world signals. We compared results against independent indicators, such as import intensity versus local processing, regional application shares versus product launch activity, and price ranges implied by form and source mix, and then reviewed outliers before sign-off.
The model is refreshed annually, and interim updates are made when material events occur, such as capacity additions, major regulatory shifts, or sharp moves in key raw material pricing. Before delivery, a final analyst review is completed so the latest public and interview-led updates are reflected in the market totals and the assumptions remain internally consistent.
Mordor Intelligence's Global Insoluble Dietary Fibers Market Market Size Compared With Other Published Estimates
It is normal to see different market sizes for insoluble dietary fibers because teams do not always count the same ingredient boundary, the same application set, or the same year and currency timing. Differences also show up when one model leans more on broad food trends, while another ties demand to ingredient-level usage and form-specific pricing.
By tracking inclusion rates in functional foods and supplements, then refreshing price by form and region through interview checks, Mordor Intelligence keeps the estimate limited to insoluble fiber ingredients rather than blending in finished-product value or soluble-only categories. This ingredient-scope choice is a common driver of spread across published estimates.
Benchmark comparison
| Source | Market Size | Gaps in Research Methodology |
|---|---|---|
| Mordor Intelligence | USD 3.03 B (2026) | |
| Global Consultancy A | USD 3.27 B (2024) | Uses an earlier base year and a different segmentation that can pull in broader food and nutraceutical definitions, which can lift the starting value versus an ingredient-only boundary and a later base-year price level. |
| Industry Publisher B | USD 2.65 B (2024) | Applies a longer horizon with a more conservative price and adoption path, and the scope treatment appears narrower by application, which can reduce the 2024 value even before growth is applied. |
The comparison mainly comes down to what is being counted, and when, followed by how pricing and adoption are carried forward. A method that keeps the ingredient scope clear, ties volumes to realistic use rates, and updates price and mix with field feedback tends to produce a number that can be replicated and explained in simple steps.
Key Questions Answered in the Report
What is the current value of the insoluble dietary fibers market?
The insoluble dietary fibers market is valued at USD 3.03 billion in 2026 and is projected to reach USD 4.28 billion by 2031.
Which segment holds the largest share by type?
Cellulose leads by type with 33.62% of 2025 revenue and benefits from extensive regulatory approvals.
Why are granule forms growing faster than powders?
Granules offer better flowability and lower dust generation, which improve processing efficiency and workplace safety, driving a 9.63% CAGR through 2031.
Which region is expected to grow the fastest?
Asia-Pacific is forecast to register the fastest growth at a 9.91% CAGR, supported by rising health awareness and updated dietary guidelines.
How are regulations influencing market growth?
The FDA’s revised “healthy” claim and the EU’s streamlined novel-food rules encourage fiber fortification and quicken the approval of innovative ingredients, fueling demand.