
Inertial Measurement Unit Market Size and Share
Market Overview
| Study Period | 2020 - 2031 |
|---|---|
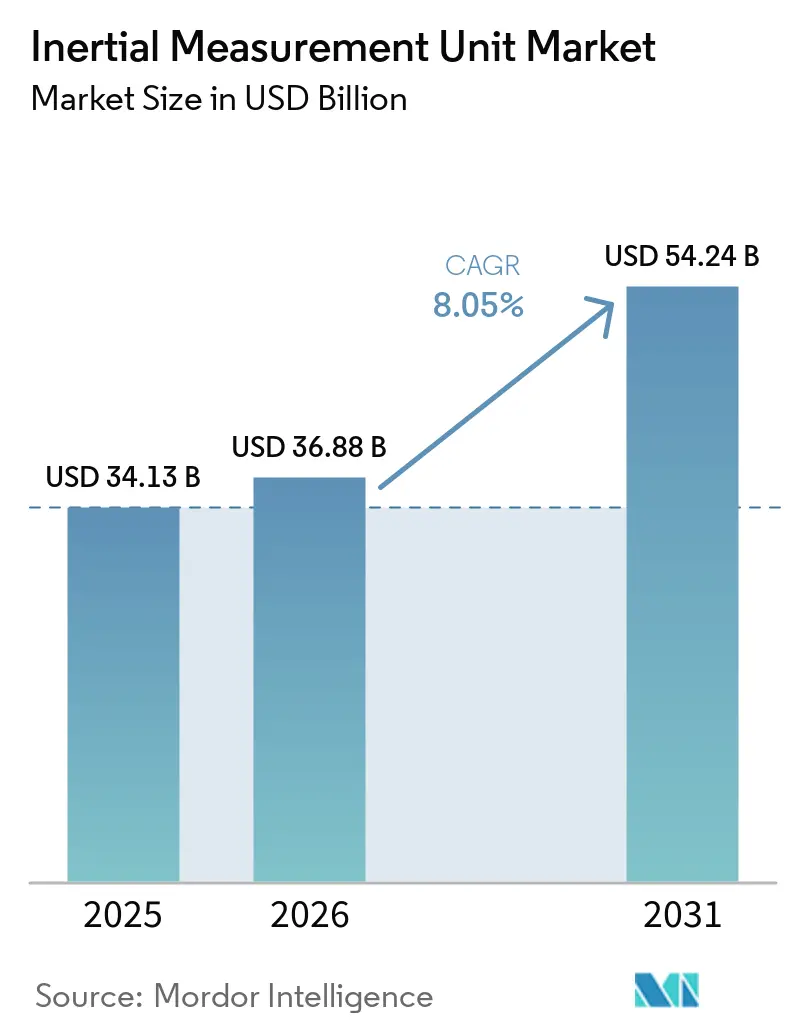
| Market Size (2026) | USD 36.88 Billion |
| Market Size (2031) | USD 54.24 Billion |
| Growth Rate (2026 - 2031) | 8.05 % |
| Fastest Growing Market | Asia Pacific |
| Largest Market | North America |
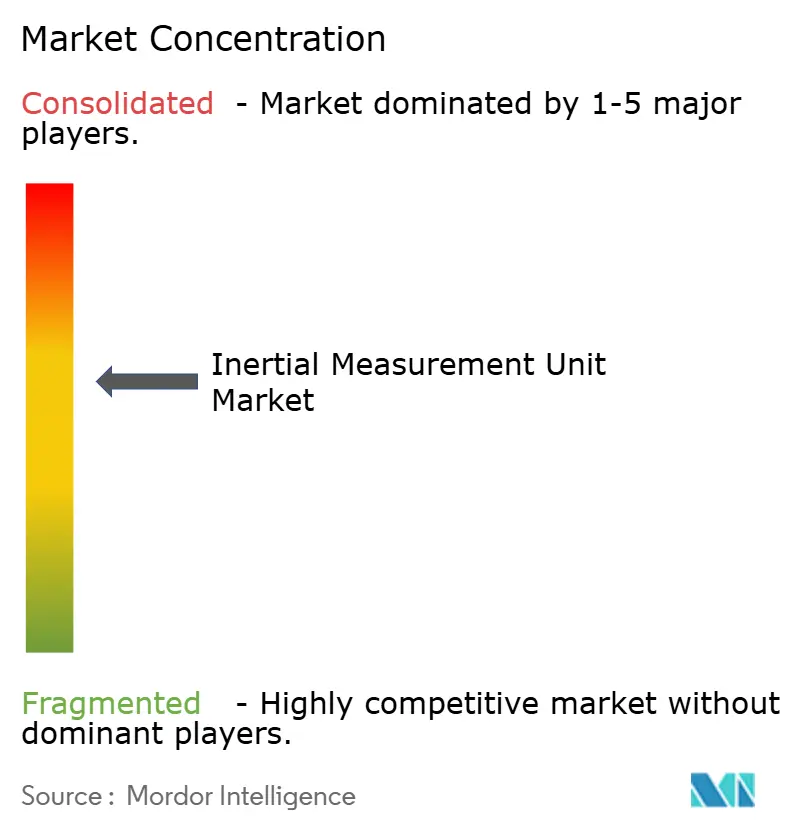
| Market Concentration | Medium |
Major Players *Disclaimer: Major Players sorted in no particular order Image © Mordor Intelligence. Reuse requires attribution under CC BY 4.0. | |
Inertial Measurement Unit Market Analysis by Mordor Intelligence
The inertial measurement unit market size was valued at USD 34.13 billion in 2025 and estimated to grow from USD 36.88 billion in 2026 to reach USD 54.24 billion by 2031, at a CAGR of 8.05% during the forecast period (2026-2031). Demand gains stem from hybrid quantum-MEMS sensor fusion, which is reshaping precision navigation for defines, aerospace, and autonomous platforms. Boeing validated this shift when its 2024 flight test of a quantum IMU cut unaided-GPS navigation error from tens of kilometres to tens of meters. Escalating geopolitical risk, the spread of unmanned systems, and the maturity of quantum photonics all reinforce the near-term growth outlook for the inertial measurement unit market. Consumer pull is equally strong. China shipped 494,000 smart-glass units in Q1 2025, up 116.1% year over year, signalling record demand for low-cost six-axis sensors that balance accuracy and battery life. Maritime, mining, and LNG operators are adding tactical-grade MEMS IMUs to meet sub-degree dynamic-positioning tolerances, widening the addressable base for the inertial measurement unit market. [1]
Key Report Takeaways
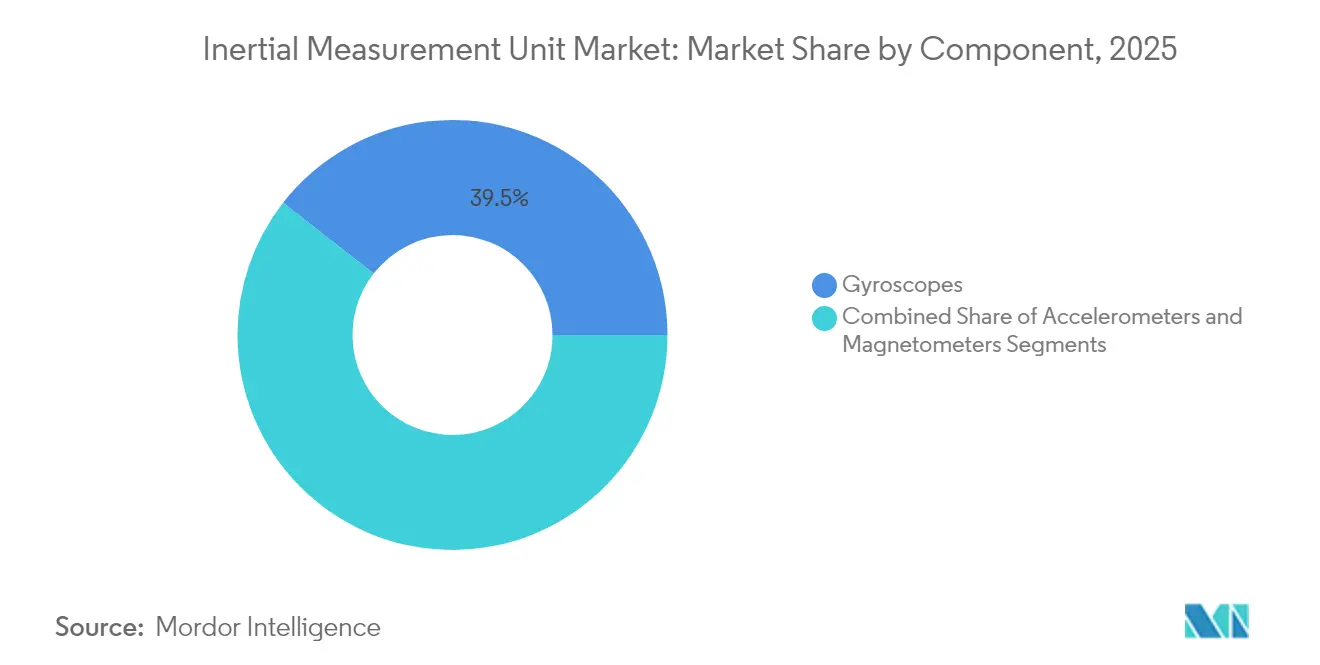
- By component, gyroscopes led with 39.45% of inertial measurement unit market share in 2025; magnetometers post the fastest 10.62% CAGR to 2031.
- By grade, commercial-grade units captured 34.55% share of the inertial measurement unit market size in 2025, while space-grade units expand at a 12.02% CAGR through 2031.
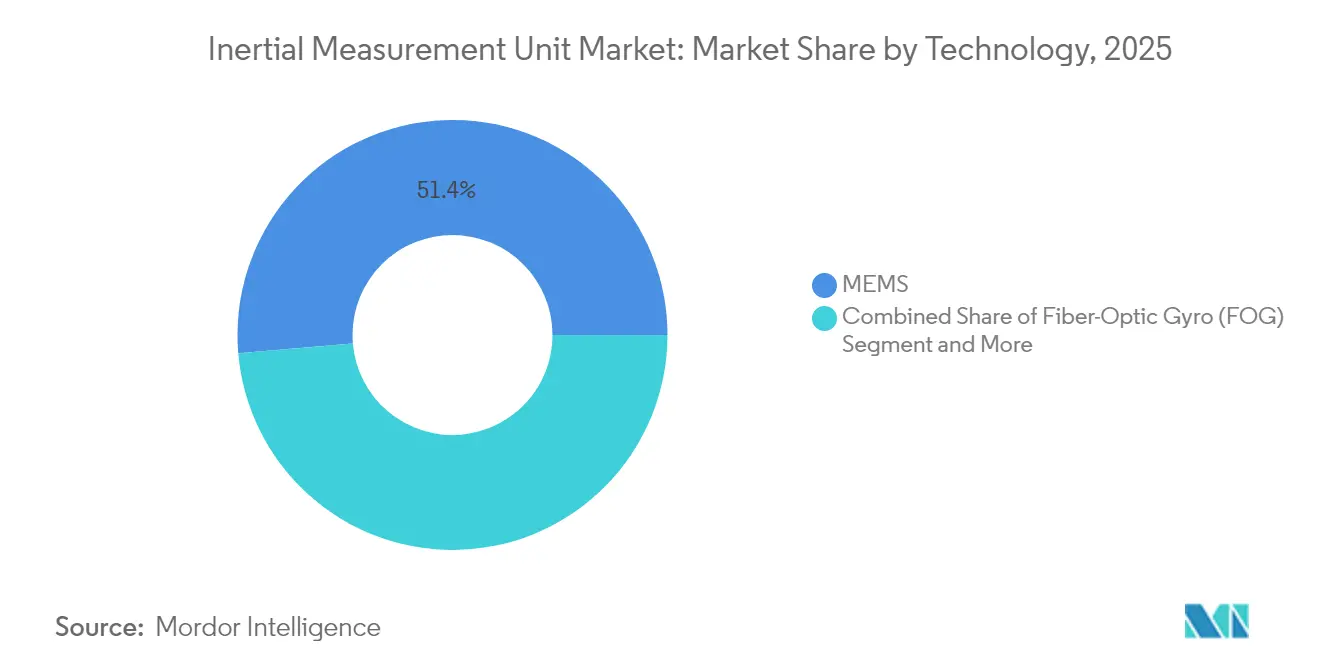
- By technology, MEMS dominated at 51.35% share in 2025; photonic devices record an 10.78% CAGR to 2031.
- By end user, aerospace and defense held 31.55% revenue share in 2025; automotive ADAS grows at 11.06% CAGR to 2031.
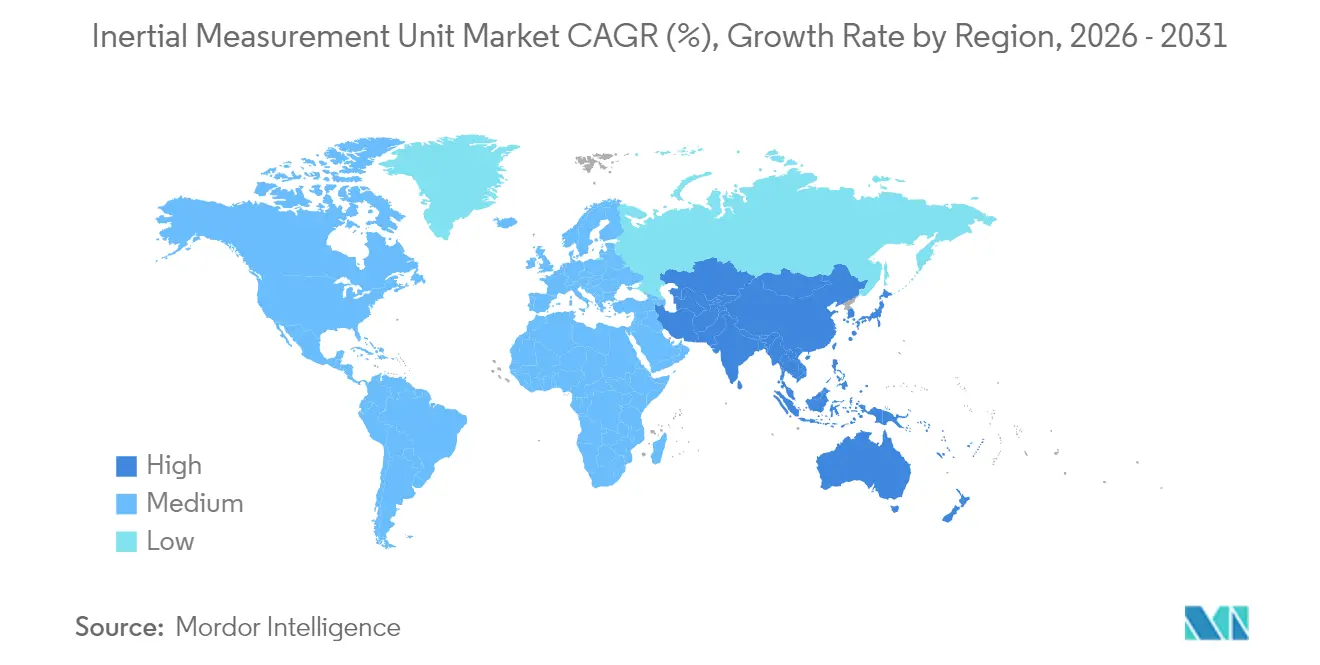
- By geography, North America accounted for 37.35% of the inertial measurement unit market size in 2025, whereas Asia-Pacific advances at an 11.42% CAGR through 2031.
Note: Market size and forecast figures in this report are generated using Mordor Intelligence’s proprietary estimation framework, updated with the latest available data and insights as of 2026.
Market Trends and Insights
Drivers Impact Analysis of Inertial Measurement Unit Market*
| Driver | (~) % Impact on CAGR Forecast | Geographic Relevance | Impact Timeline |
|---|---|---|---|
| Accelerated Deployment of Counter-UAS Platforms amid Middle-East Drone Incursions | 1.80% | Global, with concentration in Middle East & NATO countries | Short term (≤ 2 years) |
| Rising Adoption of MEMS-based Tactical-Grade IMUs in European LNG Tankers for Dynamic Positioning | 1.20% | Europe, with spillover to Asia-Pacific LNG routes | Medium term (2-4 years) |
| Integration of Cold-Atom IMUs in ESA Small-Satellite Constellations | 0.90% | Global space missions, led by Europe and North America | Long term (≥ 4 years) |
| Expansion of Photonic IMUs for Autonomous Mining Vehicles in Australia | 0.70% | Australia, with adoption in Canada and Chile mining sectors | Medium term (2-4 years) |
| Demand Spike for Retrofit Navigation Upgrades in U.S. Gen-II Fighter Fleet | 1.10% | North America, with export potential to allied nations | Short term (≤ 2 years) |
| High-volume Consumer-Electronics IMU Orders Driven by Asia's XR Headset Race | 2.10% | Asia-Pacific core, with global consumer electronics impact | Short term (≤ 2 years) |
| Source: Mordor Intelligence | |||
Accelerated deployment of counter-UAS platforms amid Middle East drone incursions
Low-cost drones now outnumber legacy air defenses across several Middle East theatres. Nordic Air Defence’s Kreuger 100 interceptor relies on a simplified IMU-only flight computer, reaches 270 km/h, and cuts unit costs for swarm engagements. The U.S. Marine Corps selected Epirus microwave systems that couple agile IMUs with software-defined emitters to disable drone electronics. These moves signal a procurement pivot toward modular, software-centric weapons built around inertial cores rather than expensive radar or optical guidance. Suppliers that offer scalable IMU modules and open APIs stand to gain as militaries transition to volume-deployment counter-UAS doctrine. [2]
Rising adoption of MEMS tactical-grade IMUs in European LNG tankers for dynamic positioning
European LNG shippers face tighter port queues and harsher Atlantic swells. Bourbon vessels now carry Exail Octans AHRS, based on fiber-optic gyros, to maintain roll, pitch, and heave integrity during crane operations. MEMS designs are also displacing ring-laser gyros on retrofit jobs because they slash purchase price by half while meeting sub-degree accuracy. Advanced Navigation’s Hydrus AUV lowered subsea survey costs 75% and removed the need for team-based diving missions. Such savings encourage fleet-wide sensor upgrades, expanding the inertial measurement unit market across commercial shipping.
Integration of cold-atom IMUs in ESA small-satellite constellations
The European Space Agency’s GENESIS project co-locates four geodetic payloads with a cold-atom interferometer that promises 1 mm terrestrial-reference accuracy. The Naval Research Laboratory achieved continuous 3-D atom-beam operation that prevents drift for months. Quantum stability resists GNSS jamming and spoofing, giving civil and military operators an independent navigation layer. As cold-atom packages shrink and ride-share launch costs fall, satellite builders will replace legacy ring-laser gyros, creating long-duration demand for quantum-enhanced IMUs.
Expansion of photonic IMUs for autonomous mining vehicles in Australia
Anello Photonics demonstrated chip-scale optical gyros that limit distance error to 0.1% over 100 km, unlocking unmanned road trains that haul ore between Pilbara pits and ports. Rio Tinto’s AutoHaul rail network already logs fuel and maintenance savings by using photonic IMUs for driverless routing. BHP reports a 20% jump in productivity and 90% accident reduction after introducing autonomous drills. Mining firms now view navigation sensors as strategic assets that guard output and worker safety, adding a new vertical growth track for the inertial measurement unit market.
Restraints Impact Analysis of Inertial Measurement Unit Market*
| Restraint | (~) % Impact on CAGR Forecast | Geographic Relevance | Impact Timeline |
|---|---|---|---|
| Design-in Cycles >7 Years Limiting Supplier Switch-Over in Commercial Aircraft | -1.40% | Global aerospace industry, concentrated in North America and Europe | Long term (≥ 4 years) |
| ITAR Restrictions Curtailing U.S. Space-grade IMU Exports to APAC New-Space Players | -0.80% | APAC new-space sector, with secondary effects in Europe | Medium term (2-4 years) |
| Cumulative Bias Drift in MEMS Arrays Exceeding ±0.3°/hr for Long-haul Maritime Routes | -0.60% | Global maritime industry, particularly affecting transoceanic shipping | Medium term (2-4 years) |
| Scarcity of Radiation-Hardened ASICs Raising BOM Costs in LEO Satellite IMUs | -0.90% | Global space industry, with acute impact on new-space ventures | Short term (≤ 2 years) |
| Source: Mordor Intelligence | |||
Design-in cycles less than 7 years limiting supplier switch-over in commercial aircraft
Certification risk makes air-framers conservative. Boeing flight-tested quantum IMUs for four hours but must still complete multi-year qualification before line-fit adoption. Honeywell’s miniature IMU that flew on Mars probes underscores how aerospace buyers favour proven designs that demonstrate multi-decade reliability. Lengthy validation locks in incumbent vendors and slows unit-price erosion, tempering the inertial measurement unit market growth rate in commercial aviation.
ITAR restrictions curtailing U.S. space-grade IMU exports to APAC new-space players
The U.S. Department of Commerce eased licensing for close allies in 2024 yet retained controls on radiation-hardened navigation parts to other regions. APAC launch startups therefore invest in domestic IMU design or pivot to European suppliers, leading to parallel supply chains that limit U.S. vendor reach. Scarce rad-hard ASICs also stretch lead times, delaying satellite schedules and muting near-term demand for U.S.-origin devices.
*Our forecasts treat driver/restraint impacts as directional, not additive. The impact forecasts reflect baseline growth, mix effects, and variable interactions.
Inertial Measurement Unit Market Segment Analysis
By Component:
Sensor Fusion Drives Competitive EdgeGyroscopes contributed 39.45% of inertial measurement unit market revenue in 2025 and remain foundational for dead-reckoning accuracy. Magnetometers, though smaller in absolute value, compound at 10.62% CAGR as augmented-reality developers embed digital compasses inside every headset. Accelerometers maintain consistent volume in vibration and ADAS roles. The inertial measurement unit market now leans toward single-package sensor fusion. STMicroelectronics’ LSM6DSV16X adds a machine-learning core that recognizes gestures while lowering standby power to extend battery life. Component vendors that offer on-chip analytics can charge premiums despite commoditization pressure.
Emerging packages combine gyro, accelerometer, and magnetometer data inside secure enclave micro-controllers. Integrated timing eliminates inter-sensor latency and hardens systems against spoof signals. As design teams adopt these modules, bill-of-materials simplicity overtakes raw component cost as the main selection factor. That transition supports steady pricing in the inertial measurement unit market despite rising shipment volumes.

By Grade:
Commercial Dominance Meets Space-Grade MomentumCommercial-grade devices captured 34.55% of inertial measurement unit market size in 2025 thanks to smartphone and auto-ADAS scale. Space-grade shipments, though smaller, are projected to climb 12.02% CAGR on the back of proliferated low-Earth-orbit (LEO) constellations. Northrop Grumman’s LR-450 uses milli-HRG gyros that log more than 70 million fault-free hours in orbit while halving size, weight, and power over ring-laser counterparts. That reliability attracts constellation operators who must launch hundreds of identical satellites.
Grade boundaries blur as commercial MEMS precision improves. Automotive suppliers now request tactical-grade bias stability, while drone makers procure space-qualified parts for radiation robustness. Vendors that master flexible production lines able to pivot from consumer to defense volumes gain resilience during sector downturns, reinforcing their share within the inertial measurement unit market.
By Technology:
MEMS Hegemony Faces Photonic UpswingMEMS accounted for 51.35% of revenue in 2025 due to wafer-level economies. Yet photonic IMUs register the highest 10.78% CAGR. Anello Photonics demonstrated a silicon optical gyro that shifts seamlessly to inertial guidance when GPS jamming occurs, making it an attractive high-performance IMU for commercial aircraft backup systems. Fiber-optic and ring-laser technologies keep niche dominance in long-range artillery and subsea survey roles, while hemispherical resonator gyros serve high-vibration space launchers.
Supply chains now invest in silicon photonics to shrink cost deltas versus MEMS. Sandia National Laboratories integrated quantum modulators onto 300 mm wafers, laying groundwork for mass-market quantum-enhanced IMUs. When yield stabilizes, optical devices could capture mid-tier price points, expanding their addressable slice of the inertial measurement unit market.
By End User:
Aerospace Holds Lead as Automotive SurgesAerospace and defense held 31.55% of inertial measurement unit market share in 2025 given mission-critical tolerance for premium pricing. Automotive ADAS applications, however, grow 11.06% CAGR, fuelled by mandatory lane-keeping and hands-off highway pilot programs. TDK’s ICM-456xy BalancedGyro delivers sub-0.3°/s bias instability for VR headsets and will migrate to high-volume driver-monitoring cameras. Industrial robotics and warehouse automation also pull volumes as e-commerce groups seek lights-out fulfilment.
Cross-sector innovation is now bidirectional. Consumer wearables push for lower-power AI on the edge, lessons that aerospace primes repurpose to cut cockpit workload. Conversely, quantum-grade stability perfected for missiles trickles down to luxury automotive lidar modules. This circulation enlarges total addressable demand and underpins long-run growth for the inertial measurement unit market.
Geography Analysis
North America Inertial Measurement Unit Market
North America commanded 37.35% of inertial measurement unit market revenue in 2025. U.S. defense budgets fund quantum interferometer research at the Naval Research Laboratory, extending navigation run-time without drift. Boeing’s quantum-IMU flight validated commercial-aviation use cases and keeps local OEMs ahead of European rivals. Export-control reforms in 2024 eased transfers to Australia, Canada, and the United Kingdom, giving North American vendors privileged access to allied aerospace programs.
APAC Inertial Measurement Unit Market
Asia-Pacific posts the strongest 11.42% CAGR through 2031. Chinese smart-glass makers, buoyed by domestic subsidies, order tens of millions of six-axis MEMS sensors each quarter. Australia’s remote mines serve as live testbeds for photonic IMU trucks, encouraging regional universities to spin out navigation start-ups. New-space launch firms across India, Japan, and South Korea seek ITAR-free space-grade parts, fostering indigenous supply chains that challenge U.S. incumbents in cost-sensitive missions.
Europe Inertial Measurement Unit Market
Europe retains strategic niches in marine, energy, and high-precision satellite payloads. The ESA GENESIS satellite will use cold-atom IMUs to underpin centimeter-level sea-level monitoring. Exail won Bourbon vessel contracts for fiber-optic gyro dynamic-positioning upgrades, reflecting regional expertise in harsh-sea sensor packaging. Honeywell’s EUR 200 million purchase of Civitanavi in 2024 gives the firm a deep European production base, ensuring continuity for aircraft programs even amid trans-Atlantic trade frictions.
Regulatory Landscape
Regulatory requirements for IMUs vary by end-use sector. In automotive, adoption is anchored to ISO 26262 functional safety, including ASIL-aligned development and the SEooC approach for sensors used in ADAS and autonomous driving stacks.
For broader product definition and verification, IEEE Std 1780-2022 supports IMU specification documents, while IEEE 1559-2022 standardizes inertial-system terminology across consumer, industrial, and aerospace programs. In defense, aerospace, and space-grade deployments, export-control frameworks such as the Wassenaar Arrangement and national implementations (including US ITAR/EAR controls and Germanys BAFA licensing) require suppliers to keep separate compliance paths for dual-use versus controlled items. Interface and health-monitoring expectations for military and aerospace vehicle applications are also framed by SAE 2020, which influences how IMU health data is exposed to mission computers and autonomy stacks.
Value Chain Analysis
The IMU value chain starts with silicon and specialty materials, including MEMS wafers, ASICs, packaging substrates, and polarization-maintaining fiber for optical units. After device fabrication and packaging, units go through calibration and environmental screening, then get integrated at the module level into avionics, autonomy computers, and end-platform navigation systems.
High-performance builds are test- and calibration-intensive, with multi-axis rate tables and thermal characterization accounting for a meaningful share of manufacturing cost. For navigation-grade programs, optical-grade supply can also be constrained by limited specialty-fiber sources, which contributes to extended lead times. Downstream, OEMs and system integrators in aerospace and defense, automotive (ADAS), industrial robotics, marine dynamic positioning, and space payloads drive qualification and design-in requirements that keep suppliers on long programs and place weight on traceability. Capacity and capability investments increasingly target faster test throughput, rugged packaging, and assured PNT features, including VectorNav Technologies actions in June 2025 to expand APNT capability through LEO satellite aiding and to add a 100,000 square foot facility to scale production and R&D.
Competitive Landscape
The inertial measurement unit market shows moderate fragmentation, yet M&A momentum is rising. VIAVI paid USD 150 million for Inertial Labs, coupling RF-test know-how with inertial sensors to address autonomous-system diagnostics. Honeywell acquired Civitanavi to secure fiber-optic gyro IP and comply with European sourcing rules. Start-ups leverage photonics and quantum physics to bypass MEMS incumbents, while big consumer brands file patents that fold IMUs into proprietary mixed-reality stacks; Apple’s 2024 headset sensor patent exemplifies this move.
Technology leadership now revolves around system-level intelligence. Bosch Sensortec ships BHI380 smart hubs that self-learn user motion and cut host-processor wakeups, a capability sought by drone makers for longer sorties. Suppliers that merge software, AI, and secure-element hardware achieve sticky design wins, cushioning margins even as unit prices for raw sensors fall. Consolidation continues as defense primes buy photonic or quantum specialists to protect sovereign navigation roadmaps.
Inertial Measurement Unit Industry Leaders
-
Honeywell International Inc.
-
Northrop Grumman Corp.
-
Bosch Sensortec GmbH
-
Analog Devices Inc.
-
Safran Sensing Technologies (Safran SA)
- *Disclaimer: Major Players sorted in no particular order
Inertial Measurement Unit Market Companies Covered in this Report
- Honeywell International Inc.
- Northrop Grumman Corp.
- Bosch Sensortec GmbH
- Analog Devices Inc.
- Safran Sensing Technologies
- Thales Group
- STMicroelectronics N.V.
- ACEINNA Inc.
- Sensonor AS
- Silicon Sensing Systems Ltd.
- KVH Industries Inc.
- Xsens Technologies B.V.
- VectorNav Technologies LLC
- SBG Systems SAS
- Gladiator Technologies
- Trimble Inc.
- Moog Inc.
- EMCORE Corp.
- TDK-InvenSense
- Murata Manufacturing Co. Ltd.
- Continental AG
- Raytheon Technologies Corp.
Market Opportunities and Future Outlook
Whitespace is building for IMUs that hold performance in GNSS-denied and harsh-operating conditions while still scaling for commercial deployment. Honeywells March 2026 launch of the HGuide i700, positioned as a no-license-required MEMS IMU for unmanned air, land, and sea platforms, highlights demand for export-friendly tactical navigation modules that can move through procurement quickly and support multi-region autonomy deployments.
Industrial automation is showing a parallel pull, where high-vibration motion tracking requirements are being packaged for harsher environments. TDK Invensense published SmartIndustrial motion-tracking specifications in May 2026 to address industrial environments that strain conventional consumer-grade sensors. The technology roadmap opportunity also centers on photonic and quantum-adjacent architectures that push drift and bias stability beyond conventional MEMS without relying on legacy high-cost form factors. Boeings 2024 quantum-IMU flight test, which reduced GPS-denied navigation error from tens of kilometres to tens of meters, offers a clear validation signal for quantum-MEMS sensor fusion in precision navigation, while ongoing standardization (IEEE Std 1780-2022 and SAE 2020) reduces integration friction for buyers that must qualify sensors across mixed fleets. Supply-chain constraints, especially around rad-hard electronics and high-performance calibration capacity, create room for suppliers that can deliver tested, traceable modules and scalable screening throughput for space-grade and safety-critical programs.
Recent Industry Developments in Inertial Measurement Unit Market
- April 2026: Northrop Grumman introduced the LR-450 inertial measurement unit for space missions, positioned as a space-hardened IMU optimized for SWaP-C and a 15-year lifetime. The release expands options for mid-size satellite and deep-space programs that need long-duration inertial performance alongside constrained payload budgets.
- September 2025: Northrop Grummans Advanced Hypersonic Technology (AHT) IMU completed three flight tests, including a sounding-rocket demonstration, showing performance at hypersonic speeds in GPS-denied conditions. The milestone supports faster qualification cycles for IMU-enabled guidance packages in high-dynamic defense applications.
- May 2024: STMicroelectronics announced the ASM330LHBG1 inertial module, described as independently tested and certified for ISO 26262 safety-compliant redundancy. The announcement targets safety-critical automotive and industrial designs where ISO 26262-aligned sensor redundancy and documentation act as procurement gatekeepers.
Inertial Measurement Unit Market Report Scope and Research Methodology
Market Definition and Coverage
For this study, the inertial measurement units market covers the revenue earned from IMU hardware sold into end users that require motion, orientation, and navigation sensing through integrated accelerometers and gyroscopes (and, where relevant, magnetometers).
Scope exclusions: We exclude pure standalone sensors sold outside an IMU assembly, software-only navigation stacks, and downstream integration services that are billed separately from the IMU device.
Segments Covered in This Report
- By Component
- Gyroscopes
- Accelerometers
- Magnetometers
- By Grade
- Marine Grade
- Navigation Grade
- Tactical Grade
- Space Grade
- Commercial Grade
- By Technology
- MEMS
- Fiber-Optic Gyro (FOG)
- Ring-Laser Gyro (RLG)
- Hemispherical Resonator Gyro (HRG)
- Mechanical Gyro
- By End User
- Aerospace and Defense
- Automotive (ADAS and Autonomous)
- Industrial Automation and Robotics
- Consumer Electronics and XR
- Marine and Offshore
- Energy (Oil and Gas, Wind Turbines)
- Geography
- North America
- United States
- Canada
- Mexico
- Europe
- United Kingdom
- Germany
- France
- Italy
- Rest of Europe
- Asia-Pacific
- China
- Japan
- India
- South Korea
- Rest of Asia-Pacific
- Middle East
- Israel
- Saudi Arabia
- United Arab Emirates
- Turkey
- Rest of Middle East
- Africa
- South Africa
- Egypt
- Rest of Africa
- South America
- Brazil
- Argentina
- Rest of South America
- North America
Data Sources, Market Sizing, and Validation
Desk Research
Desk research was used to build the initial demand map and to keep the model tied to observable activity in end markets that buy IMUs. We mainly leaned on public sources such as US Department of Defense budget and procurement releases, US FAA and EASA aviation statistics, NASA and other space agency mission updates, and automotive safety and ADAS rulemaking updates from transport authorities.
To ground volumes and pricing direction, we also reviewed sources such as customs and trade statistics for relevant electronics and navigation-related categories, patent databases for inertial and navigation filings, and peer-reviewed engineering journals that discuss IMU performance trends and adoption. Company filings, investor presentations, association websites, and trusted press were used to cross-check product positioning and shipment momentum, and a paid company financials and news database was used selectively to standardize revenue and segment notes. These desk research sources are illustrative only, and many other public documents were also used for data collection, validation, and clarification.
Primary Interviews and Surveys
Primary work was used to validate what is actually shipping, how pricing moves by grade, and which end uses are scaling fastest across regions. We spoke with a mix of component makers, IMU assemblers, system integrators, and procurement and engineering leaders across aerospace and defense, automotive and autonomy programs, industrial robotics, and marine navigation. Where interview inputs conflicted with desk signals, we rechecked the underlying assumptions before carrying them into the model.
Distribution of primary research fieldwork respondents
| Company type | Respondent position | Region |
|---|---|---|
| Top tier: 37% | CXOs: 15% | APAC: 49% |
| Mid tier: 44% | Functional/Unit leaders: 42% | EMEA: 30% |
| Smaller Players: 19% | Managers: 43% | Americas: 21% |
Market-Sizing & Forecasting
Our core model starts from a top-down build where end-market activity is reconstructed into an IMU demand pool using observable indicators, and then it is translated into value using grade and technology level pricing logic. In practice, we used demand signals such as aircraft and defense platform deliveries and upgrades, ADAS and autonomous feature penetration, industrial robotics installations, and space mission cadence, which are then mapped to typical IMU content per platform and replacement rates.
To keep totals realistic, the outputs were corroborated with selective bottom-up approximations, such as sampling reported segment revenues, using channel checks on common ASP ranges by tactical versus navigation grades, and cross-checking implied unit volumes against manufacturing capacity and lead-time commentary. When some sub-markets had weak disclosure, gaps were handled through proxy ratios based on similar platforms, followed by re-validation through primary feedback. For forecasting, scenario analysis was used, supported by expert views on defense spending cycles, vehicle production trends, and industrial automation investment timing, and the final trajectory was stress-tested against historical growth patterns.
Data Validation & Update Cycle
Validation is done in layers so major errors are caught early, and small variances are explained before sign-off. Model outputs are compared against independent signals such as platform production trends, procurement announcements, and technology adoption rates, and then outliers are reviewed by a second analyst before the numbers are finalized.
If a variance cannot be explained by scope or timing, we re-contact sources to confirm assumptions such as ASP movement, grade mix, or demand timing. Reports are refreshed annually, and interim updates are made when material events occur that can change volumes or pricing. After that, a final pre-delivery review is completed so clients receive the latest view.
Mordor Intelligence's Global Inertial Measurement Units Market Market Size Measured Against Other Published Estimates
Published market sizes for inertial measurement units can look far apart because researchers do not always count the same products, years, and end uses in the same way. Differences also come from how pricing is treated across grades, and whether totals are checked against real platform demand signals.
Platform delivery and upgrade signals, combined with grade-level ASP checks collected in interviews, are the evidence points that keep Mordor Intelligence tied to the 2026 demand pool for IMUs rather than a broader inertial or sensor-only revenue bucket. The spread you see across sources is usually explained by how each study treats standalone inertial sensors versus full IMUs, how it counts defense and space programs, and what base year and currency timing are applied.
Benchmark comparison
| Source | Market Size | Gaps in Research Methodology |
|---|---|---|
| Mordor Intelligence | USD 36.88 B (2026) | |
| Global Consultancy A | USD 22.43 B (2026) | Often reflects a narrower counted scope by platform or end use, and it can apply more conservative ASP ladders across tactical and navigation grades, which reduces the implied value even when unit demand is similar. |
| Industry Research Group B | USD 27.99 B (2023) | Uses an earlier base year and a faster forward-growth curve, and it may blend adjacent motion-sensing hardware categories when compiling totals, which makes year-to-year comparisons to a 2026-only size less direct. |
Taken together, the table shows that timing, scope boundaries, and grade-mix pricing are the main reasons the numbers do not match. By anchoring the model to observable platform demand and then re-checking pricing and mix through interviews, we keep a clear, repeatable path from inputs to the final market value.
Key Questions Answered in the Report
What is the current size of the inertial measurement unit market?
The inertial measurement unit market size reached USD 36.88 billion in 2026 and is projected to climb to USD 54.24 billion by 2031 at an 8.05% CAGR.
Which technology segment is growing fastest?
Photonic IMUs show the highest 10.78% CAGR as silicon photonics lowers cost and boosts accuracy for GPS-denied navigation.
Why is Asia-Pacific the fastest-growing region?
Explosive consumer-electronics demand, autonomous-vehicle pilots, and mining automation push Asia-Pacific toward an 11.42% regional CAGR through 2031.
How are quantum sensors affecting the inertial measurement unit market?
Quantum interferometry, such as cold-atom and hybrid quantum-MEMS designs, cuts long-term drift and resists GPS jamming, opening new aerospace and defense opportunities.
What restrains rapid IMU adoption in commercial aircraft?
Certification cycles exceeding seven years make air-framers reluctant to switch suppliers, limiting near-term penetration for new IMU entrants.
Which companies are driving consolidation?
VIAVI Solutions and Honeywell led 2024 deals by purchasing Inertial Labs and Civitanavi Systems, respectively, to gain fiber-optic and MEMS expertise.