
Industrial Submersible Pumps Market Size and Share
Market Overview
| Study Period | 2020 - 2031 |
|---|---|
| Market Size (2026) | USD 21.46 Billion |
| Market Size (2031) | USD 27.54 Billion |
| Growth Rate (2026 - 2031) | 5.12 % |
| Fastest Growing Market | Middle East and Africa |
| Largest Market | Asia Pacific |
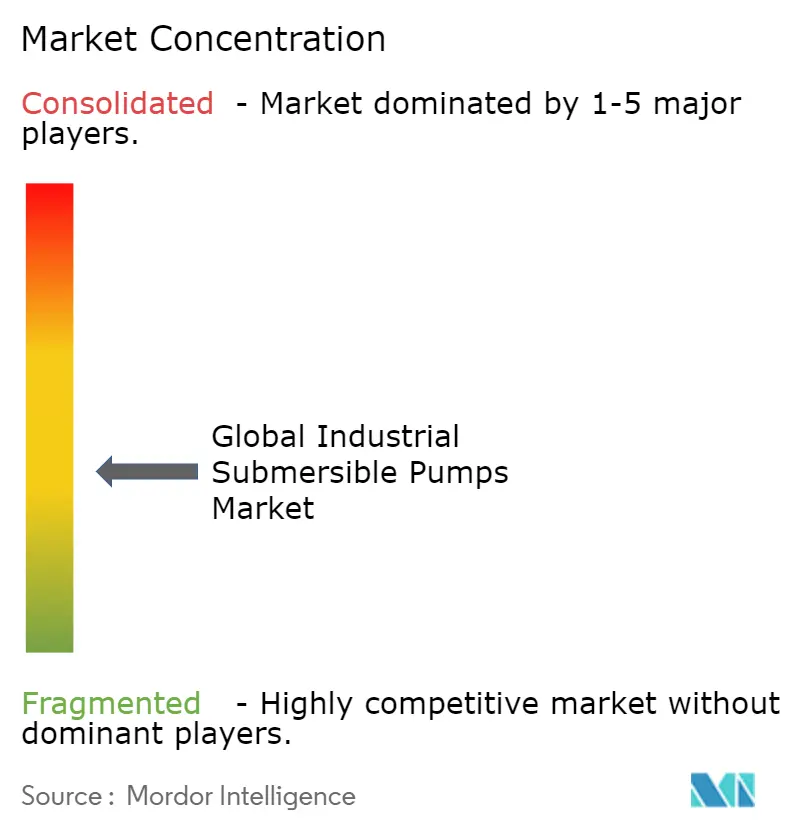
| Market Concentration | Medium |
Major Players
*Disclaimer: Major Players sorted in no particular order Image © Mordor Intelligence. Reuse requires attribution under CC BY 4.0. |
|
Industrial Submersible Pumps Market Analysis by Mordor Intelligence
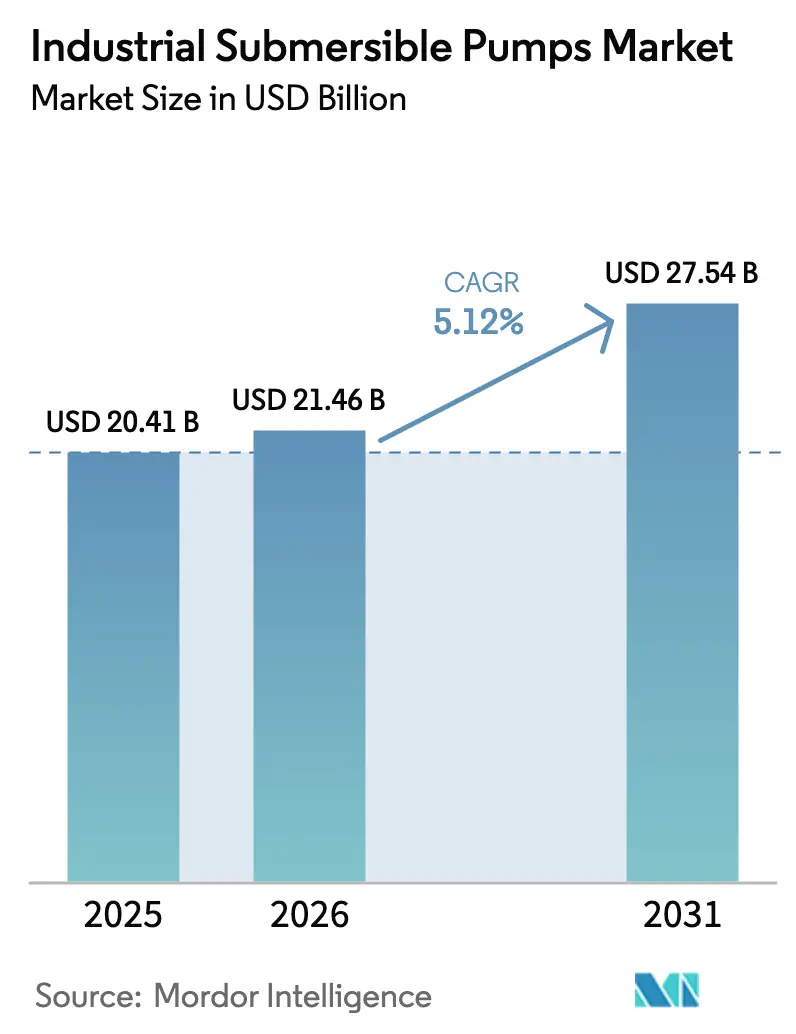
The industrial submersible pumps market size was valued at USD 20.41 billion in 2025 and estimated to grow from USD 21.46 billion in 2026 to reach USD 27.54 billion by 2031, at a CAGR of 5.12% during the forecast period (2026-2031). Growth rests on simultaneous infrastructure upgrades, water-security spending, and tightening energy-efficiency mandates that shorten replacement cycles. Utilities modernize pump stations to curb leakage; oil and gas operators revive electric submersible pump (ESP) programs to lift mature wells; and farms adopt solar-powered irrigation kits to offset high diesel costs. The interplay of urban expansion, stricter motor-efficiency rules, and climate-resilience investments positions the industrial submersible pumps market as a long-run beneficiary of both public- and private-sector capital outlays. Manufacturers that bundle high-efficiency motors with remote monitoring platforms capture pricing power because asset owners increasingly judge lifetime cost over upfront price.
Key Report Takeaways
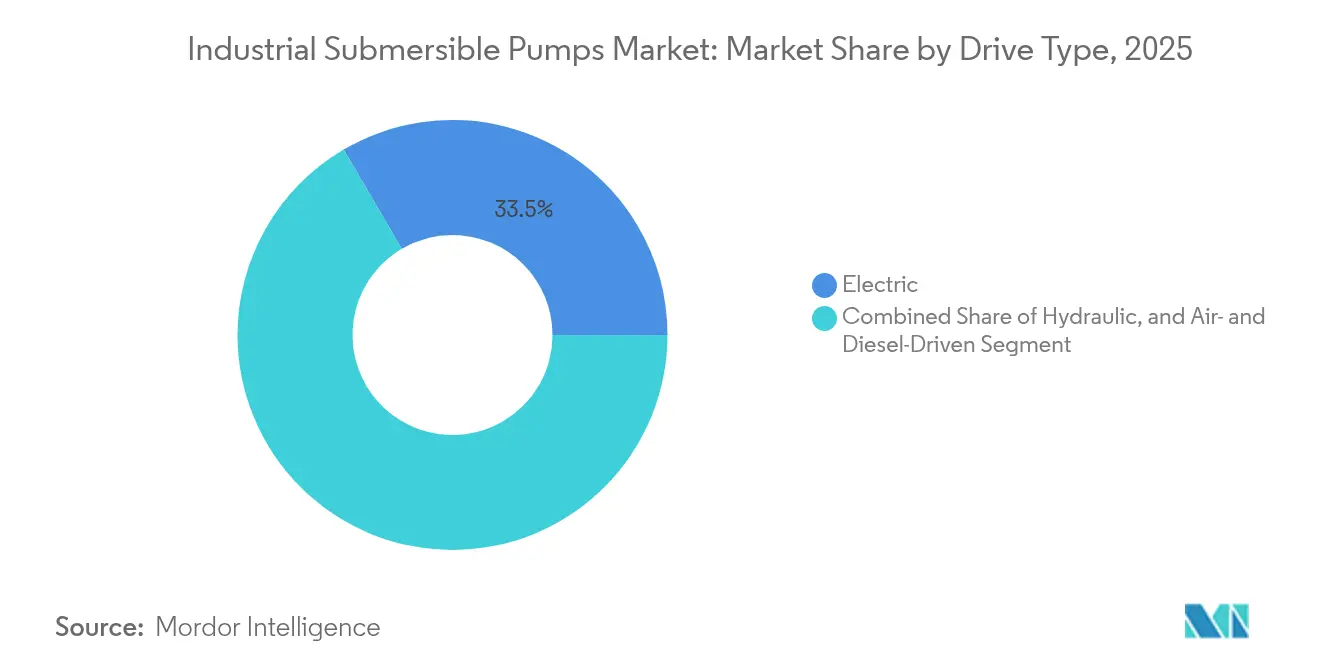
- By drive type, electric systems led with 33.45% of industrial submersible pumps market share in 2025, while hydraulic systems are projected to post the segment-high 5.43% CAGR to 2031.
- By pump type, borewell units accounted for 40.15% revenue share in 2025; slurry and dewatering pumps are expected to expand at a 6.18% CAGR through 2031.
- By end-user industry, water and wastewater held 37.55% share of the industrial submersible pumps market size in 2025, whereas agriculture and irrigation is on track for a 6.85% CAGR.
- By power rating, medium-power pumps (15-100 kW) captured 35.85% share in 2025; high-power systems (>100 kW) represent the fastest-growing band at 5.39% CAGR.
- By head depth, shallow-head applications (<50 m) commanded 39.75% market share in 2025; deep-head installations (>100 m) are projected to rise at a 5.67% CAGR.
- By geography, Asia-Pacific dominated with 44.05% of the industrial submersible pumps market in 2025, while the Middle East & Africa is poised for a 6.03% CAGR to 2031.
Note: Market size and forecast figures in this report are generated using Mordor Intelligence’s proprietary estimation framework, updated with the latest available data and insights as of 2026.
Market Trends and Insights
Drivers Impact Analysis of Industrial Submersible Pumps Market*
| Driver | (~) % Impact on CAGR Forecast | Geographic Relevance | Impact Timeline |
|---|---|---|---|
| Expanding global water and wastewater infrastructure | +1.2% | Global (Asia-Pacific & Middle East focus) | Long term (≥ 4 years) |
| Rapid urbanization and construction projects | +0.9% | Asia-Pacific core, spill-over to Africa | Medium term (2-4 years) |
| Recovery in upstream oil and gas drilling (ESP adoption) | +0.7% | North America & Middle East | Medium term (2-4 years) |
| Government push for industrial energy-efficiency retrofits | +0.6% | Europe, North America, developed Asia | Long term (≥ 4 years) |
| Surge in solar-powered pump subsidies for agriculture | +0.5% | India, Southeast Asia, Sub-Saharan Africa | Short term (≤ 2 years) |
| Rapid digitalisation: IoT-enabled condition-monitoring | +0.4% | Global, early adoption in developed markets | Medium term (2-4 years) |
| Source: Mordor Intelligence | |||
Expanding Global Water and Wastewater Infrastructure
Municipal utilities worldwide upgrade pump stations to stem leakage and meet new capacity standards. Texas allocated USD 481 million in 2025 for clean-water schemes that include submersible pump retrofits.[1] Puerto Rico’s USD 4.2 billion rebuild covers 1,267 pumping assets, illustrating the scale of demand in climate-exposed regions. Smaller, distributed treatment plants proliferate in dense cities, requiring more pumps per megaliter of capacity than legacy centralized plants. Utilities also seek IE5-class motors to curb electricity bills, a cost line that can exceed 80% of lifetime pump spending. Suppliers able to certify energy savings now win multi-year framework contracts that insulate revenues from commodity-price swings.
Rapid Urbanization and Construction Projects Across the Globe
Asia hosts the biggest wave of new urban developments, with the Asian Development Bank estimating USD 1.7 trillion in yearly infrastructure needs to 2030. Deep excavation for metro tunnels, basements, and power tunnels favors compact submersible dewatering sets because surface-mounted alternatives cause noise and block limited site space. Foreign direct investment into ASEAN hit USD 230 billion in 2024, much of it channeled to renewable-energy parks that rely on corrosion-resistant pumps for process water circulation. Building-information-modeling software now sizes pumps accurately, trimming overspecification and reinforcing demand for high-precision hydraulic units. These trends sustain a steady call-off schedule for project-driven pump orders even when general industrial capex softens.
Recovery in Upstream Oil and Gas Drilling (ESP Adoption)
Rising crude prices revive ESP programs that lift mature reservoirs. Baker Hughes introduced permanent-magnet ESPs with wider gas-handling envelopes, enabling operators to defer workovers in high-gas wells.[2] SLB’s Reda Agile system fits smaller casing while cutting carbon emissions by up to 55%, aligning with operators’ decarbonization targets.[3] Offshore extended-reach wells carry premium pump pricing because retrieval costs are high; as a result, producers pay a markup for diagnostics-ready motors and metal-matrix coatings that extend mean time between failures. Integrated digital twins predict ESP run life, turning what was once a product sale into a performance-based service contract.
Government Push for Industrial Energy-Efficiency Retrofits
Europe enforced IE4 motor rules up to 200 kW in 2024, obliging factories to upgrade legacy pumps or face penalty tariffs. The U.S. Department of Energy will tighten certification for commercial and industrial pumps in May 2025, making nameplate efficiency a procurement prerequisite. Grundfos already markets IE5 motors with 95.7% efficiency, winning early-mover advantage with end users that value future-proof compliance. Retrofits routinely bundle variable-frequency drives and cloud-based monitoring that slice electricity use by up to 81% in building systems, proving that efficiency and digitalisation now reinforce rather than cannibalize each other.
Restraints Impact Analysis of Industrial Submersible Pumps Market*
| Restraint | (~) % Impact on CAGR Forecast | Geographic Relevance | Impact Timeline |
|---|---|---|---|
| High lifecycle maintenance and pull-out costs | –0.8% | Global, acute in offshore & deep-well sites | Long term (≥ 4 years) |
| Volatility in stainless-steel and rare-earth materials | –0.6% | Global, highest in Asia-Pacific supply chains | Short term (≤ 2 years) |
| Absence of IE3 mandates in some regions | –0.4% | Emerging markets | Medium term (2-4 years) |
| Motor failures bottleneck critical infrastructure | –0.3% | Global utilities & mining | Medium term (2-4 years) |
| Source: Mordor Intelligence | |||
High Lifecycle Maintenance and Pull-Out Costs
Deep-well and offshore pumps often require costly workovers because each retrieval can halt production for days. Electrical faults account for 61% of ESP failures, and mean time between failures shortens as wells age, inflating operating budgets for field operators. Innovations such as single-tank dual-pump arrays reduce downtime yet push capital costs higher, creating a trade-off that slows adoption for cost-sensitive producers. Where surface-mounted sets can meet head requirements, asset owners sometimes shelve submersible upgrades, holding back market volume growth. Suppliers respond with modular ESPs that allow motor or seal section swaps without full pull-out, but these designs still command a premium that not all buyers can absorb.
Volatility in Stainless-Steel and Rare-Earth Motor Materials
Submersible casings favor duplex stainless steel for corrosion resistance, while high-efficiency motors use neodymium and dysprosium magnets. The International Energy Agency warns that refining of key energy minerals is concentrated in a handful of countries, leaving buyers exposed to policy risk.[4] Cobalt demand topped 200 kilotons in 2024, yet oversupply pressured prices, complicating contract hedging for motor OEMs. When prices swing wildly, procurement teams delay bulk orders, lengthening sales cycles. Some manufacturers pivot to ferrite-based motors with lower power density but steadier material costs, illustrating how commodity volatility shapes design roadmaps.
*Our forecasts treat driver/restraint impacts as directional, not additive. The impact forecasts reflect baseline growth, mix effects, and variable interactions.
Industrial Submersible Pumps Market Segment Analysis
By Drive Type:
Efficiency Gains Sustain Electric DominanceThe electric segment accounted for 33.45% of industrial submersible pumps market share in 2025, supported by grid-connected municipal and industrial sites that prize predictable power supply. Widespread availability of IE5 permanent-magnet motors lets operators trim electricity bills without redesigning piping, reinforcing electric leadership. Variable-frequency drives now ship as standard, letting plants match flow to real-time demand and avoiding throttling losses. Hydraulic drive systems, though a smaller base, are slated for a 5.43% CAGR through 2031 as deep-well mining and offshore rigs need precise speed control under extreme pressure. Compact power packs and new fluid-conditioning circuits reduce leakage, making hydraulics viable where electric insulation is difficult. Air and diesel sets keep niche relevance for disaster response and remote construction where grid power is absent. Across all formats, digital interfaces standardize telemetry, letting operators mix fleets without losing visibility into condition data.
The industrial submersible pumps market continues to reward suppliers that tailor drive offerings to application risk profiles. Electric systems win on life-cycle cost in water utilities, but hydraulics attract premium margins in high-head mines that face abrasive slurries. Diesel packages still secure emergency contracts from flood-prone cities wanting standalone resilience. As governments add carbon taxes, some mineshafts consider hybrid electric-hydraulic sets powered by onsite solar arrays, underscoring how drive choice is becoming an energy-strategy decision rather than a pure engineering call. Suppliers that maintain multi-drive catalogs hedge demand shifts and capture back-end service revenue by unifying data streams onto single dashboards.

By Pump Type:
Borewell Leadership Meets Rising Slurry DemandBorewell pumps captured 40.15% share of the industrial submersible pumps market in 2025 by catering to deep agricultural and municipal wells that demand high head at modest flow. Multistage centrifugal designs now feature corrosion-resistant impellers that stretch service intervals even in brackish aquifers. Non-clog sewage pumps occupy wastewater plants where ragging can choke open-well units; their vortex impellers lower maintenance hours. Slurry and dewatering pumps will deliver a 6.18% CAGR into 2031 thanks to expanded copper, lithium, and iron-ore projects that handle dense tailings. Abrasion-resistant coatings and adjustable wear rings extend life, reducing downtime in remote pits.
Pump-type selection is increasingly data-driven as operators deploy sensors to log solids loading and duty cycles. This shift favors vendors with application engineering teams that can simulate wear patterns and recommend right-sized models, reducing both capex and spares inventory. The industrial submersible pumps market also sees crossover equipment such as hybrid borewell-slurry designs for municipal projects that face both sand ingress and variable flow. In food factories, stainless sanitary pumps gain traction where hygiene codes ban painted surfaces. Each niche offers margin uplift for manufacturers that can certify compliance with sector-specific standards, from NSF to ATEX.
By End-User Industry:
Infrastructure Steady, Agriculture AcceleratingWater and wastewater utilities held the largest stake, accounting for 37.55% of the industrial submersible pumps market size in 2025 as cities modernized treatment plants and lifted resilience budgets. Decentralized treatment modules multiply pump count per project because each unit needs its own lift station. Agriculture and irrigation, helped by solar incentive schemes, is set for a 6.85% CAGR, the fastest among end users. The U.S. Department of Agriculture’s Rural Energy for America grants cover up to 50% of solar pump costs, unlocking paybacks under three seasons for small farms. Mining, oil, and gas remain cyclic but require specialized ESPs and slurry pumps with high gross margins, offsetting volume volatility.
Sector diversification cushions suppliers from single-sector shocks. When oilfield spending fell in 2020-2022, water utilities and agriculture held demand stable. Now, upstream recovery adds another leg to revenue. Industrial submersible pumps industry players integrate IoT modules that let farmers schedule irrigation via smartphone and let utilities schedule predictive maintenance before festival peak loads. Cross-learning from one end user to another-such as applying oilfield monitoring analytics to municipal lift stations—creates service upsell opportunities and further embeds vendors inside client operations.
By Power Rating:
Medium Band Predominates, High-Power Gains ShareMedium-power pumps between 15 kW and 100 kW represented 35.85% market share in 2025 because their capacity fits most municipal lift stations and factory process lines. Standardized footprints enable drop-in replacements, helping operators avoid piping changes. However, high-power units above 100 kW will grow 5.39% annually as desalination plants, large mines, and centralized wastewater hubs scale capacity. These projects justify premium-priced motors with active cooling and online vibration diagnostics that prevent catastrophic failures. Low-power pumps under 15 kW remain common in rural water schemes and solar kits where panel output is limited; ongoing module price declines make such systems cost-competitive even without subsidies.
Future procurement increasingly bundles pumps into containerized skids pre-wired with drives and telemetry. This favors high-power packages that shorten on-site commissioning windows. The industrial submersible pumps market thus grapples with a paradox: unit counts may tilt toward smaller solar pumps, yet revenue skews to fewer, larger, digitally enabled machines. Suppliers that optimize manufacturing for both extremes-modular low-power lines and bespoke high-power builds-will balance volume and margin streams.

By Head Depth:
Deep-Head Projects Command Premium MarginsShallow-head installations under 50 m held 39.75% of industrial submersible pumps market share in 2025, largely through municipal distribution loops and surface-water irrigation. These pumps face cost pressure, pushing vendors to streamline casting and automate assembly. Medium-depth applications (50-100 m) serve industrial bores and township wells where moderate casing diameter allows standard pump/motor combos, creating a value sweet spot between price and performance. Deep-head projects beyond 100 m are poised for a 5.67% CAGR because mining firms exploit deeper ore bodies and water-stressed regions tap confined aquifers. Permanent-magnet motors and ceramic bearing sleeves mitigate heat build-up at these depths, commanding price premiums.
Digital pressure gauges and fiber-optic temperature sensors feed real-time data to surface dashboards, allowing operators to spot scale build-up early and schedule acidizing before pump seizure. Given the retrieval cost of deep-head units, many mine sites sign service contracts that guarantee uptime, effectively outsourcing risk to pump OEMs. The industrial submersible pumps market thus shifts from a product-sale model toward lifecycle-performance contracting, a trend most visible in deep-head segments where stakes are highest.
Geography Analysis
APAC Industrial Submersible Pumps Market
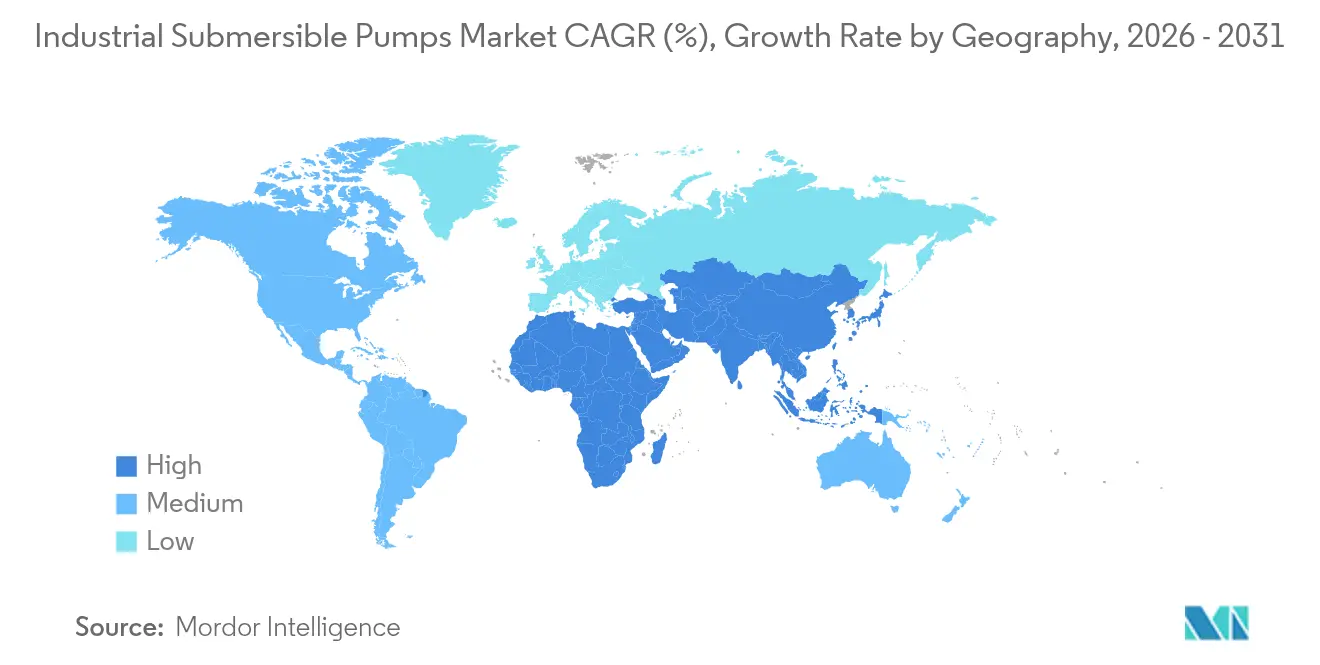
Asia-Pacific remained the epicenter, holding 44.05% of industrial submersible pumps market value in 2025, and is forecast to track the overall 5.12% CAGR. China’s replacement of aging city mains, India’s Jal Jeevan Mission, and ASEAN manufacturing inflows underpin steady order books, while domestic suppliers scale up to meet price-sensitive rural demand. Japanese and South Korean firms push efficiency frontiers, seeding IoT pilot projects that later diffuse across the region.
MEA Industrial Submersible Pumps Market
The Middle East and Africa, although smaller, is expected to log a 6.03% CAGR through 2031 as desalination, district cooling, and mega-infrastructure projects proliferate. Saudi Arabia launched USD 293 million of sewage and pipeline contracts in 2025, and Morocco secured a EUR 100 million IFC loan for a 219 km desalinated-water pipeline ifc.org. NEOM’s net-zero water network illustrates how the region leapfrogs to solar-powered, digitally orchestrated pumping platforms.
The Americas and Europe Industrial Submersible Pumps Market
North America and Europe show mature yet resilient growth as utilities replace post-war assets and comply with tighter efficiency mandates. The U.S. DOE standard effective May 2025 forces industrial campuses to file pump-efficiency reports, steering purchases toward IE4 and IE5 systems. Texas water-board funding of USD 481 million and Puerto Rico’s climate-proof rebuild confirm that even developed markets still offer sizeable addressable pockets for submersible suppliers. South America contributes opportunistic upside via new lithium brine projects in Chile and solar-irrigation rollouts in Brazil’s cerrado, broadening the global revenue footprint.
Value Chain Analysis
The value chain starts upstream with metals, magnet and insulation inputs, including duplex stainless casings, copper windings, rare-earth permanent magnets, stator laminations, and seal and elastomer compounds. Component specialists then provide motors, mechanical seals, bearings, power cables, variable-frequency drives, and sensors. OEMs carry out hydraulic design, casting and machining, winding and motor assembly, sealing, and testing against efficiency and safety protocols, before packaging systems for application use, increasingly with controls and telemetry for SCADA and IoT integration.
Downstream, demand and delivery typically flow through direct OEM tendering for utilities and energy operators, EPC contractors on large infrastructure jobs, and regional distributors and rental fleets for dewatering and construction work. Aftermarket service, covering field commissioning, pull-out and overhaul, seal and motor replacement, and spares logistics, forms a major value pool because deep-well, mining, and offshore retrieval costs are high. This cost profile shifts asset owners toward condition-monitoring and performance-based maintenance. Recent 2026 project ordering patterns, including ANDRITZ contracts tied to India pumped-storage projects and Weir supply for a slurry pipeline phase in Maharashtra, also point to EPC-led infrastructure programs driving system-level demand while keeping local service networks and lead-time control central.
Competitive Landscape
The industrial submersible pumps market shows moderate fragmentation: global leaders compete with strong regional champions. Grundfos, Xylem, and Sulzer differentiate through IE5 motors, condition-monitoring sensors, and cloud analytics. Grundfos’s 95.7%-efficient IE5 motor has become a reference point in utility tenders. Sulzer’s brand-agnostic Sense platform lets plant managers monitor mixed-manufacturer fleets, lowering barriers to platform adoption.
Consolidation accelerates. SLB agreed in April 2024 to buy ChampionX for USD 7.8 billion, expanding its artificial-lift reach and promising USD 400 million in synergies slb.com. Franklin Electric purchased PumpEng in February 2025 to deepen exposure to Asia-Pacific mining clients. Such deals combine technology portfolios with new sales channels, aiming to lift share in an otherwise price-competitive arena.
Strategic moves extend beyond M&A. Baker Hughes ties ESP hardware to its production-optimization software, turning equipment sales into recurring analytics revenue. Grundfos’s acquisition of Culligan’s commercial division beefs up service density around European industrial parks. Meanwhile, niche players target white spaces: Australian firms retrofit submersibles for acid-mine drainage, and Indian startups supply plug-and-play solar pumps to micro-irrigation dealers. Digital service platforms and portfolio breadth now matter as much as hydraulic pedigree, raising entry barriers for single-product manufacturers.
Industrial Submersible Pumps Industry Leaders
-
Baker Hughes Co.
-
Schlumberger Limited
-
Halliburton Co.
-
Weir Group PLC
-
Borets International Ltd
- *Disclaimer: Major Players sorted in no particular order
Industrial Submersible Pumps Market Companies Covered in this Report
- Grundfos Group
- Xylem Inc.
- Sulzer Ltd
- KSB SE and Co. KGaA
- Weir Group PLC
- Franklin Electric Co. Inc.
- Baker Hughes Co.
- Schlumberger Ltd
- Halliburton Co.
- Atlas Copco AB
- Ebara Corporation
- Tsurumi Manufacturing
- Flowserve Corporation
- Wilo SE
- Kirloskar Brothers Ltd
- Pentair PLC
- Gorman-Rupp Company
- Borets International
- Shakti Pumps (India) Ltd
- WEG Industries
Market Opportunities and Future Outlook
The near-term opportunity centers on compliance-driven replacement and specification upgrades as efficiency and noise requirements tighten across multiple jurisdictions. In China, the Standardization Administration of China (SAC) rolled out GB/T 24674-2025 in March 2026, setting mandatory energy-efficiency grades and noise limits for submersible pumps. SAC also published GB/T 17389-2026 for submersible electric pump cables, with a September 1, 2026 implementation date, which shifts procurement toward certified pump-motor-cable packages and raises barriers for lower-end offerings. At the same time, EU Regulation 2019/1781 keeps IE4 as a minimum motor efficiency level, supporting demand for high-efficiency motor retrofits and integrated drive packages where lifecycle energy cost is decisive.
System integration is also emerging as the main whitespace for end users that previously purchased pumps as discrete equipment. Buyers are moving from basic flow-and-head checks to multi-parameter specifications that include efficiency indices, solids-handling fit, and interoperability with plant telemetry, creating space for OEMs and integrators that bundle pumps, drives, sensors, and analytics into standardized, serviceable platforms. Large-scale water and energy infrastructure programs provide visible demand pools for these integrated packages, including new pump-station investments in Australia under the NSW Government water-security workstream and pumped-storage project ordering in India that pulls in pump-turbine and electromechanical supply chains, expanding regional service and assembly footprints.
Recent Industry Developments in Industrial Submersible Pumps Market
- June 2026: SLB OneSubsea won an EPC contract from BP to supply a subsea pumping system for the Thunder Horse project in the Gulf of Mexico. The award reinforces subsea boosting as a premium niche within industrial submersible pumping, favoring suppliers with high-reliability hardware, controls integration, and offshore service execution.
- December 2025: Baker Hughes signed a multi-year agreement with Kuwait Oil Company to supply advanced artificial lift systems, including ESPs integrated with FusionPro intelligent production drives and Leucipa automated field production solutions. The scope signals tighter coupling between ESP hardware and production-automation software, supporting bundled offerings and recurring digital services alongside equipment supply.
- April 2024: SLB introduced the Reda Agile system as part of new artificial lift offerings aimed at enhancing operating range for ESP applications. The product focus on performance and deployment flexibility supports replacement and upgrade cycles in mature wells where operators prioritize uptime and efficiency improvements.
Industrial Submersible Pumps Market Report Scope and Research Methodology
Market Definition and Coverage
For this study, the market includes industrial-duty submersible pumps that operate fully submerged to lift, transfer, or dewater fluids across industrial and utility-linked use cases. The sizing is in value terms (USD) across major regions.
Scope exclusions: We exclude non-submersible pump types and non-industrial products such as household sump pumps, small decorative units, and aquarium pumps.
Segments Covered in This Report
-
By Drive Type
- Electric
- Hydraulic
- Air- and Diesel-Driven
-
By Pump Type
- Borewell
- Open-well
- Non-clog Sewage
- Slurry and Dewatering
-
By End-user Industry
- Water and Wastewater
- Oil and Gas
- Mining and Construction
- Power Generation
- Food and Beverage
- Agriculture and Irrigation
-
By Power Rating
- Low (Less than 15 kW)
- Medium (15-100 kW)
- High (Higher than 100 kW)
-
By Head Depth
- Below 50 m
- 50 - 100 m
- Above 100 m
-
By Geography
-
North America
- United States
- Canada
- Mexico
-
South America
- Brazil
- Argentina
- Rest of South America
-
Europe
- Germany
- United Kingdom
- France
- Italy
- Spain
- Russia
- Rest of Europe
-
Asia-Pacific
- China
- India
- Japan
- South Korea
- Australia
- Rest of Asia-Pacific
-
Middle East and Africa
- Gulf Cooperation Council Countries
- Turkey
- South Africa
- Rest of Middle East and Africa
-
North America
Data Sources, Market Sizing, and Validation
Desk Research
Desk work starts by building a clean view of demand drivers that typically pull industrial submersible pumps, and mapping them to likely replacement and new-install volumes by region. Public sources such as the US Energy Information Administration, the World Bank, the International Energy Agency, and UN Comtrade help us cross-check industrial activity trends, energy mix changes, and trade direction for pump-related equipment.
We also review sources such as USGS mining statistics, water and wastewater program publications from environmental agencies, and procurement notices that indicate pumping station upgrades and dewatering projects. Annual reports, investor presentations, and product catalogs are used to understand typical price bands, duty conditions, and where submersible designs are preferred. In a few cases, we also referenced paid databases for company financials and news, and shipment-level import and export signals to verify directionality. These sources are illustrative and not exhaustive, and many other public documents were also checked for data collection, validation, and clarification.
Primary Interviews and Surveys
Primary work was used to validate how volumes split across water and wastewater, mining and construction, oil and gas, power, and irrigation. We also confirmed what buyers actually replace versus repair in the field. Interviews covered pump manufacturers, distributors, EPC and maintenance firms, and end users. This set was used to pressure-test assumptions on pricing, lead times, and common duty ranges across APAC, EMEA, and the Americas.
Distribution of primary research fieldwork respondents
| Company type | Respondent position | Region |
|---|---|---|
| Top tier: 39% | CXOs: 13% | APAC: 42% |
| Mid tier: 47% | Functional/Unit leaders: 39% | EMEA: 36% |
| Smaller Players: 14% | Managers: 48% | Americas: 22% |
Market-Sizing & Forecasting
Sizing is built using a top-down and bottom-up approach. Regional demand pools are first reconstructed from end-use activity and asset needs, and then totals are checked against supply-side reality. On the top-down side, indicators such as wastewater treatment capacity additions, mine development and dewatering intensity, irrigation electrification, oil and gas lift requirements, and power plant water handling needs are used to shape unit demand and spending patterns.
To keep the results grounded, we corroborate with selective bottom-up approximations, including channel checks on typical order sizes, sampled price ranges by duty class, and supplier revenue exposure from public disclosures where available. When product boundaries blur in interviews, such as when a buyer compares submersibles with vertical pumps for similar duties, we only count values tied to submerged operation and industrial-grade specifications. Any gaps are handled through conservative interpolation based on adjacent project pipelines and replacement cycles.
Forecasting uses scenario analysis supported by expert inputs, since capital spending cycles in water infrastructure, mining, and energy projects can shift faster than simple trend lines. Assumptions are adjusted using near-term signals such as tender flow, major project timelines, energy efficiency regulation momentum, and regional construction activity, and then normalized back to realistic price progression in USD.
Data Validation & Update Cycle
Outputs are checked through triangulation across independent signals, and then reviewed for unusual jumps by region, end user, or implied pricing before sign-off. When variances appear, analysts re-check the underlying driver series, revisit interview notes, and, if needed, re-contact respondents to determine whether the change is structural or event-driven.
The report is refreshed annually. Interim updates are made when there are material changes such as sharp commodity swings affecting mining activity, major policy shifts in water spending, or meaningful supply constraints. Before delivery, an analyst performs a final pass to ensure the latest public data releases and recent industry events are reflected in the numbers and narrative.
Mordor Intelligence's Global Industrial Submersible Pumps Market Size Compared Against Other Published Estimates
Published market sizes for industrial submersible pumps often differ because authors draw the market boundary differently and rely on different mixes of project data, replacement assumptions, and pricing logic. Timing also plays a part, since the chosen base year and the currency conversion window can shift the reported USD value.
By checking end-user demand signals and refreshing inclusion rules, Mordor Intelligence keeps the model tied to industrial-duty submerged pumps and removes adjacent items like household sump units, which is a common reason totals spread across studies.
Benchmark comparison
| Source | Market Size | Gaps in Research Methodology |
|---|---|---|
| Mordor Intelligence | USD 21.46 B (2026) | |
| Trade Journal A | USD 11.65 B (2025) | This estimate appears to use a narrower demand pool and may undercount large industrial and utility-linked deployments, and the base year choice can also compress the USD value when earlier-year prices are applied. |
| Regional Consultancy B | USD 1.31 B (2025) | The scale suggests a sub-segment view (for example, a limited set of industrial applications or geographies) rather than a full global industrial scope, which can materially reduce the addressable value. |
Looking across the table, the biggest driver is scope, since smaller numbers usually reflect a restricted application set or a broader pump definition being split into sub-markets. Our approach stays repeatable because the size is built from visible industrial activity and replacement needs, and then cross-checked with price and channel feedback before the final total is locked.
Key Questions Answered in the Report
What is the current size of the industrial submersible pumps market?
The industrial submersible pumps market stands at USD 21.46 billion in 2026 and is projected to rise to USD 27.54 billion by 2031.
Which region leads demand for industrial submersible pumps?
Asia-Pacific accounts for 44.05% of global revenue, fueled by large-scale water infrastructure upgrades and manufacturing expansion.
Which application segment is growing fastest?
Agriculture and irrigation is forecast to grow at 6.85% CAGR through 2031, supported by government subsidies for solar-powered irrigation systems.
How are efficiency regulations affecting pump procurement?
New IE4 and IE5 motor mandates in Europe and the United States push operators to retrofit older pumps with high-efficiency, variable-speed units.
What drives adoption of digital condition monitoring?
Utilities and oil producers seek to cut unplanned downtime; platforms such as Sulzer Sense provide 24/7 analytics, turning maintenance into a predictive activity
Are material price swings influencing design choices?
Yes; volatility in stainless steel and rare-earth magnets prompts some manufacturers to explore ferrite-based motors and modular casing designs to stabilize costs.