
Image Sensor For Security Application Market Size and Share
Market Overview
| Study Period | 2020 - 2031 |
|---|---|
| Market Size (2026) | USD 3.73 Billion |
| Market Size (2031) | USD 5.55 Billion |
| Growth Rate (2026 - 2031) | 8.32 % |
| Fastest Growing Market | Middle East |
| Largest Market | Asia-Pacific |
| Market Concentration | Medium |
Major Players *Disclaimer: Major Players sorted in no particular order Image © Mordor Intelligence. Reuse requires attribution under CC BY 4.0. | |
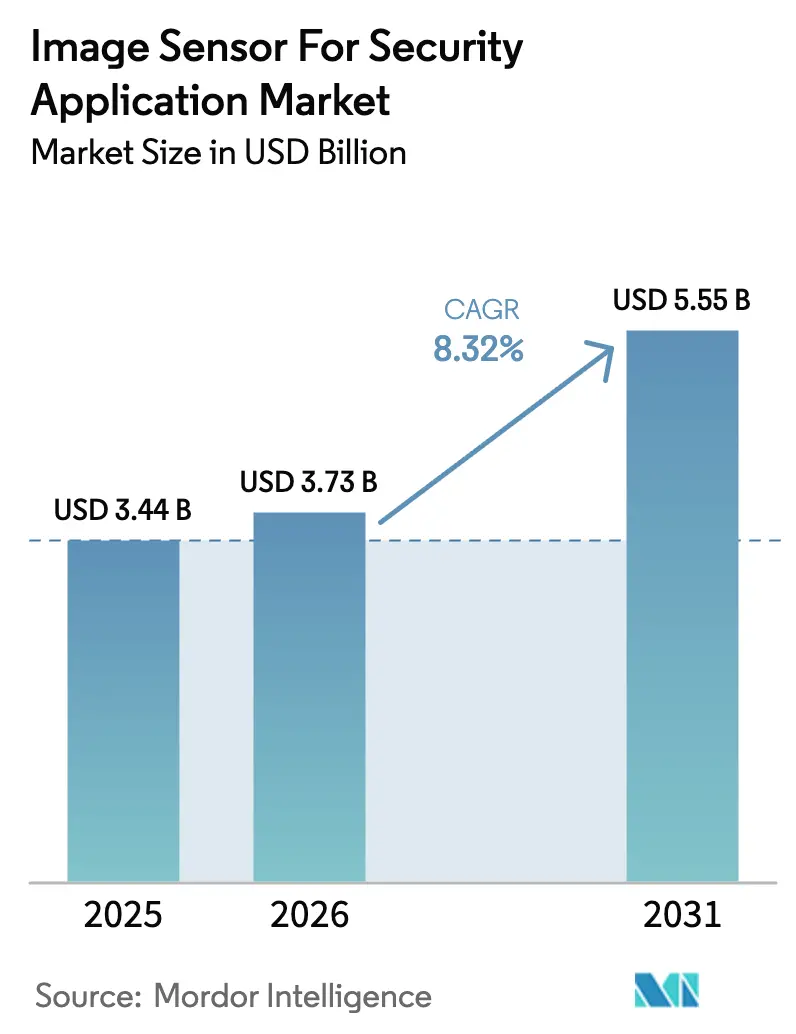
Image Sensor For Security Application Market Analysis by Mordor Intelligence
The image sensor for security application market size was valued at USD 3.44 billion in 2025 and estimated to grow from USD 3.73 billion in 2026 to reach USD 5.55 billion by 2031, at a CAGR of 8.32% during the forecast period (2026-2031). Growth rests on three pillars: sovereign-AI mandates that push analytics to the edge, rising regulatory pressure for real-time threat detection at borders and critical infrastructure, and a broad shift from passive recording to predictive analytics in commercial and residential settings. Procurement cycles in defense are intensifying, and commercial integrators are standardizing on stacked CMOS designs that fold neural accelerators directly onto the sensor die, trimming latency and network load. Supply constraints related to 300 mm wafers remain a headwind, but new capacity announcements by leading foundries signal potential medium-term relief. Finally, privacy legislation serves as both a brake and a catalyst, forcing edge-only processing while simultaneously nudging buyers to upgrade from legacy analog cameras.
Key Report Takeaways
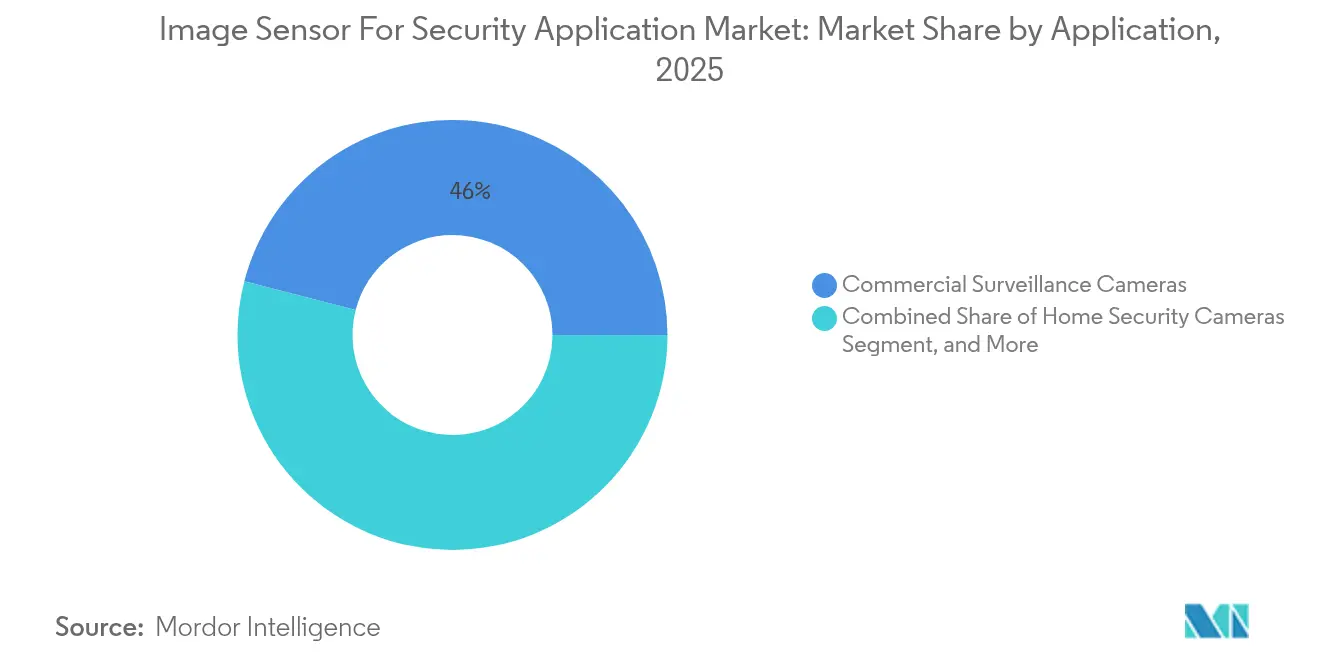
- By application, commercial surveillance cameras led the image sensor for security application market with a 45.98% share in 2025; defense and border surveillance cameras are projected to advance at a 11.05% CAGR through 2031.
- By technology, CMOS commanded 91.62% share of the image sensor for security application market size in 2025, while emerging technologies including InGaAs and SWIR variants are forecast to expand at 9.28% CAGR to 2031.
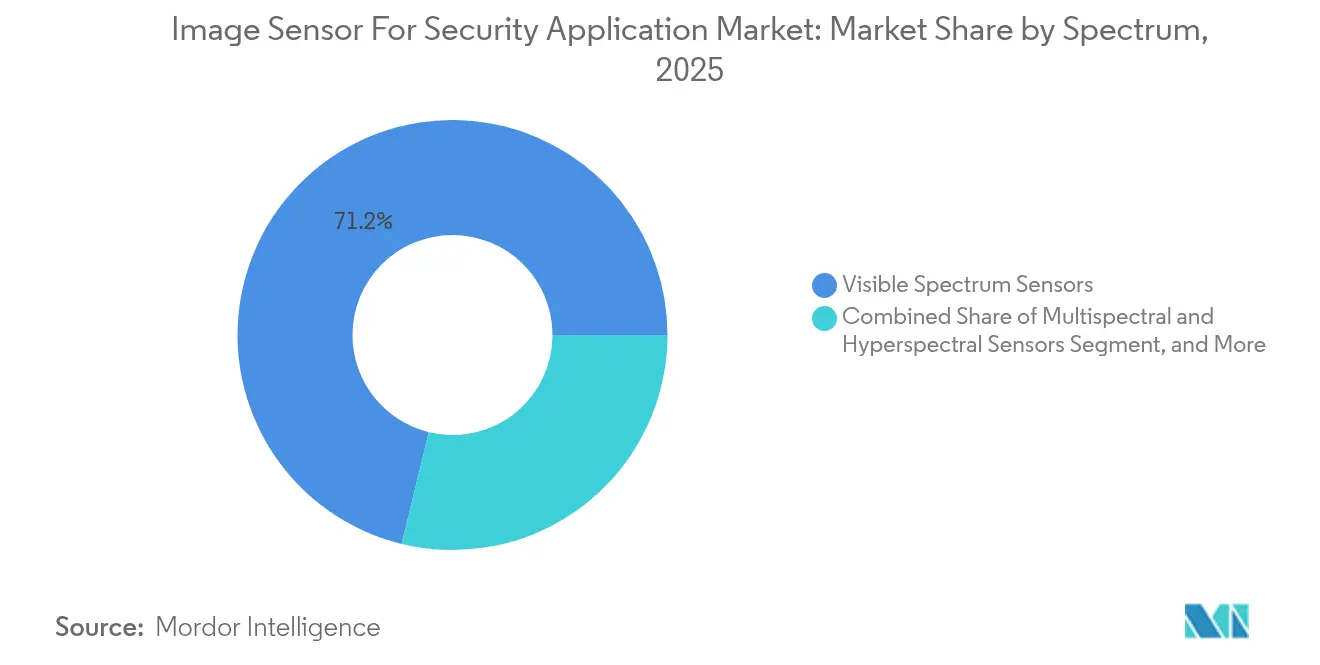
- By spectrum, visible-range sensors held a 71.20% share of the image sensor for security application market size in 2025; multispectral and hyperspectral sensors are projected to grow at a 10.95% CAGR through 2031.
- By processing type, 2D devices captured 68.05% of the image sensor for security application market share in 2025; neuromorphic event-based sensors are projected to climb at a 9.63% CAGR over the same horizon.
- By end-use sector, commercial and industrial deployments represented 43.89% of the image sensor for security application market size in 2025, while defense and military demand is projected to rise at a 11.08% CAGR to 2031.
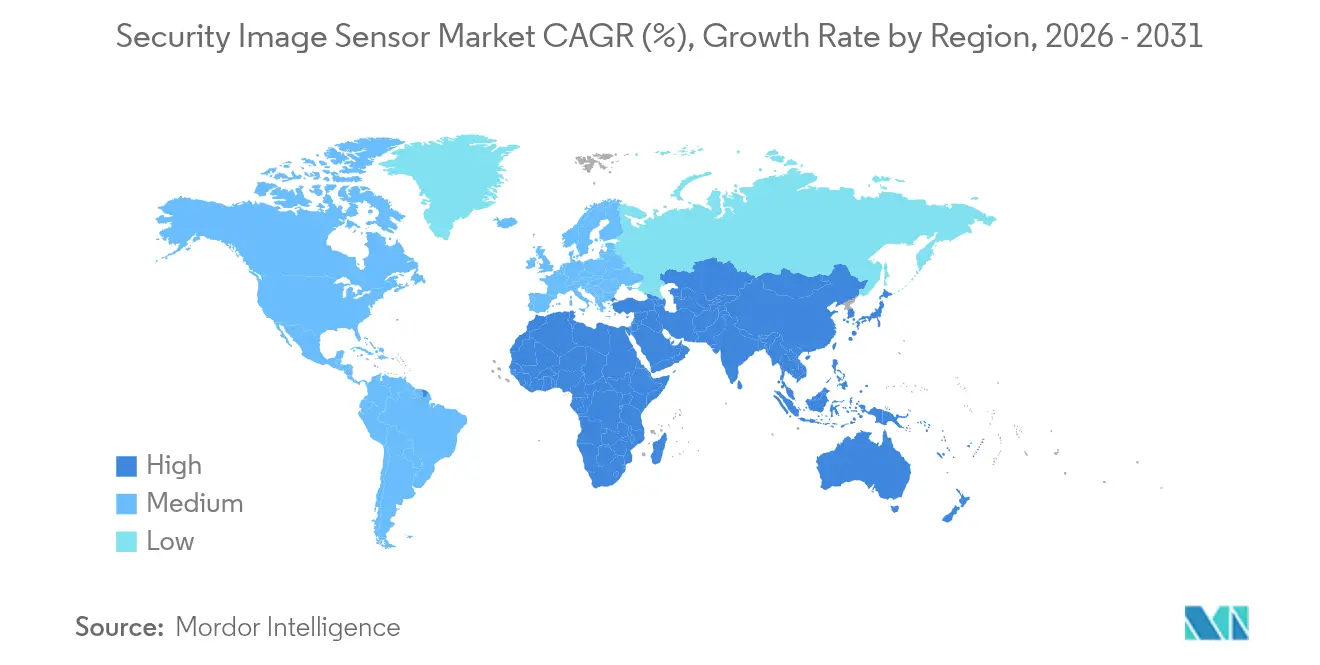
- By geography, the Asia Pacific held 42.05% of the image sensor for security application market share in 2025; the Middle East is on track for the fastest growth at a 10.42% CAGR through 2031.
Note: Market size and forecast figures in this report are generated using Mordor Intelligence’s proprietary estimation framework, updated with the latest available data and insights as of 2026.
Market Trends and Insights
Drivers Impact Analysis of Image Sensor For Security Application Market*
| Driver | (~) % Impact on CAGR Forecast | Geographic Relevance | Impact Timeline |
|---|---|---|---|
| Growing Demand from Smart Cities | +2.1% | Asia Pacific core, Middle East expansion, spillover into Latin America | Medium term (2-4 years) |
| Integration of AI-Powered Video Analytics at the Edge | +1.8% | Global, early adoption in North America and Europe | Short term (≤2 years) |
| Proliferation of IoT-Enabled Home Security Cameras | +1.4% | North America and Europe residential, emerging Asia Pacific urban | Medium term (2-4 years) |
| Regulatory Mandates for Public Safety Camera Installations | +1.3% | Europe, Middle East, India, select U.S. municipalities | Long term (≥4 years) |
| Adoption of Event-Based Neuromorphic Image Sensors | +0.9% | Global, niche defense and remote-infrastructure | Long term (≥4 years) |
| Growth of SWIR and Multispectral Sensors | +1.2% | Defense-focused, North America, Middle East, Asia Pacific | Medium term (2-4 years) |
| Source: Mordor Intelligence | |||
Growing Demand From Smart Cities
Smart-city programs in Riyadh, Dubai, Shenzhen, and Hyderabad each deploy camera densities exceeding 1,000 nodes per square kilometer, creating a throughput burden that only sensors with on-chip inference and embedded DRAM can manage effectively.[1] Saudi Arabia’s NEOM project alone awarded contracts in 2024 for 50 000 AI-ready cameras capable of real-time crowd-flow analysis across 26 500 km². These rollouts prioritize stacked CMOS architectures because DRAM layers buffer 4K streams at 60 fps without off-sensor memory, slashing backhaul bandwidth by 70%. India’s Smart Cities Mission has budgeted INR 480 billion (USD 5.8 billion) through 2024, and procurement guidelines earmark up to 22% of project spending for sensors, thereby establishing a vast addressable base. In all markets, data-sovereignty rules drive architects toward encrypted on-die storage, ensuring that biometric footage never crosses borders.
Integration of AI-Powered Video Analytics at the Edge
Moving inference from the cloud to the camera reduces detection latency from 800 ms to under 50 ms, which is vital for perimeters where intruders can cross critical distances in seconds.[2] Sony’s IMX500 sensor showcases the model, executing MobileNet and EfficientNet at 12 fps on less than 1 W and enabling battery-powered units to run 18 months on a single charge. The design shift realigns market power: sensor vendors now partner with AI software firms to deliver turnkey stacks, and camera OEMs differentiate on model libraries rather than megapixels. Compliance frameworks such as the European Union AI Act require embedded inference metadata logs and secure over-air firmware, which further cements value in the silicon rather than the server.
Proliferation of IoT-Enabled Home Security Cameras
Residential shipments accounted for 28% of global units in 2024, driven by subscription bundles from Ring, ADT, and other providers that bundle hardware with AI alerts and cloud storage. Ring alone shipped more than 3 million doorbells in H1 2024, each integrating a 5-MP CMOS sensor whose on-device motion filtering cuts false positives by 40%. Privacy statutes, led by California’s Consumer Privacy Act, push developers to create edge-only modes that avoid cloud upload, favoring sensors with 32 GB to 64 GB embedded flash. Lower cloud fees and fewer legal liabilities offset the incremental BOM cost of USD 8 to USD 12.
Regulatory Mandates for Public Safety Camera Installations
European directives mandate public-safety cameras on transportation corridors and high-footfall venues, and cities such as Milan and Barcelona now earmark capital budgets specifically for AI-ready devices that can anonymize data on-sensor. Local ordinances in Dubai and Riyadh likewise require every new commercial building to integrate cameras capable of face mask detection, driving volume orders for mid-tier 4-MP CMOS sensors. Municipalities in the United States increasingly align with Chicago’s model, where police networks integrate license-plate recognition at 400 intersections; these programs propel steady demand even when commercial spending pauses. Long planning horizons of four years or more make the related funding predictable despite cyclical dips in other verticals.
Restraints Impact Analysis of Image Sensor For Security Application Market*
| Restraint | (~) % Impact on CAGR Forecast | Geographic Relevance | Impact Timeline |
|---|---|---|---|
| High Manufacturing Costs of Large-Chip Image Sensors | -0.8% | Global, acute in high-resolution defense and infrastructure | Medium term (2-4 years) |
| Increasing Concerns over Data Privacy and Surveillance Regulations | -1.1% | Europe, North America, emerging Asia Pacific | Short term (≤2 years) |
| Shortage of 300 mm Wafer Capacity for Stacked CMOS Sensors | -0.6% | Global supply-chain bottleneck | Short term (≤2 years) |
| Vulnerabilities in Sensor Firmware Leading to Cybersecurity Risks | -0.4% | Global, reputational and liability for integrators | Medium term (2-4 years) |
| Source: Mordor Intelligence | |||
High Manufacturing Costs of Large-Chip Image Sensors
Die sizes beyond 12 mm by 12 mm often see yields under 60% on 300 mm wafers, pushing unit costs above USD 40 and making price-sensitive deployments infeasible. Stacked architectures add USD 8 to USD 15 in packaging, so the return on investment becomes defensible only when edge AI or ultra-high frame rates are mandatory. Sony and Tower command most of the stacked capacity, and both prioritize higher-margin handset and automotive customers, leaving security buyers in a queue that stretches past 26 weeks in peak quarters. Integrators, therefore, revisit smaller die options or even CCD designs for niche low-light needs, demonstrating how manufacturing economics ripple through solution design.
Increasing Concerns Over Data Privacy and Surveillance Regulations
The European Union’s GDPR empowers regulators to levy fines of up to EUR 20 million (USD 22.6 million) or 4% of annual revenue for each violation. In 2024, Italy fined two municipalities for facial-recognition pilots that lacked DPIA filings.[3] California’s Delete Act introduced a 45-day deletion mandate, compelling cloud analytics firms to revise their data retention policies. These pressures accelerate demand for sensors with hardware-level anonymization and mechanical privacy shutters, such as Sony’s lens-block feature. Budget allocations now include USD 50 000 to USD 200 000 per deployment to cover legal reviews and audit trails, squeezing smaller city councils out of advanced analytic upgrades.
*Our forecasts treat driver/restraint impacts as directional, not additive. The impact forecasts reflect baseline growth, mix effects, and variable interactions.
Image Sensor For Security Application Market Segment Analysis
By Application:
Defense Spending Reshapes Demand MixDefense and border surveillance orders, while smaller in unit volume, add premium value to the image sensor for security application market because procurement favors thermal and SWIR models with pricing multiples of three to five times commercial CMOS. The segment is forecast to post an 11.05% CAGR, the fastest among all application verticals, reflecting heightened tensions in Eastern Europe, the South China Sea, and the Middle East. Commercial surveillance, which owned 45.98% of the image sensor for security application market share in 2025, continues to dominate shopping malls, logistics hubs, and corporate campuses but is maturing in North America and Europe as saturation nears. Home security grew briskly in 2024, supported by subscription economics that subsidize hardware and add recurring revenue streams, and it remains a vital feeder for new edge-AI features. Infrastructure and traffic monitoring represents a balanced, medium-growth pocket: intelligent transportation systems in Singapore, Tokyo, and Dubai now require 4-MP resolution with wide dynamic range to register plates in glare and at night.
The defense sub-segment’s performance also reflects technology cross-pollination: uncooled microbolometer arrays and InGaAs focal-plane devices trickling from aerospace into ground-based applications. Contracts from the U.S. Department of Defense worth USD 340 million in 2024 channel demand toward domestically fabricated sensors, locking in secure supply chains. Commercial buyers, by contrast, lean on image sensors with embedded neural accelerators that lower false alarms by as much as 80%, saving significant labor in monitoring centers. These architectures increase the average selling price but reduce the total cost of ownership. The emerging migration pattern is clear: advanced capabilities debut in defense, cascade into critical infrastructure, and finally arrive in residential devices as cost curves bend.

By Technology:
CMOS Dominance Masks Niche DisruptionCMOS captured an overwhelming 91.62% of the image sensor for security application market size in 2025 and still records healthy unit growth because silicon scaling keeps reducing cost per pixel. Yet the same strength hides cracks. InGaAs shortwave infrared devices, though accounting for a single-digit share, are expanding at 9.28% CAGR as border agencies specify covert night-vision options. CCD, once the incumbent, declined 12% in shipments during 2024 but refuses to exit entirely; its superior quantum efficiency underpins persistent demand from scientific surveillance where quantum-limited detection is essential. Quantum-dot overlays on CMOS wafers debut as an economic challenger to InGaAs, offering 40% to 60% lower unit cost albeit at reduced sensitivity.
Teledyne ramped InGaAs capacity by 30% in 2024 after acquiring a Tower Semiconductor 300 mm line, signaling confidence in defense requirements. Meanwhile, stacked CMOS continues to attract R&D efforts because its logic-pixel separation enables both high resolution and integrated AI. The persistent wafer shortage pushes many mid-tier integrators back toward 200 mm flows, balancing cost, availability, and performance. As foundries bring 300 mm lines online for CMOS image sensors in 2026, the trade-off gap may close, but until then niche disruptions hold strategic relevance. The net result is that while CMOS remains dominant, buyer diversification into specialty technologies will raise the competitive stakes for incumbents.
By Spectrum:
Multispectral Gains Reflect Threat ComplexityVisible-range devices still supplied 71.20% of overall revenue in 2025, largely because retail, residential, and city-center installs prioritize color fidelity and compatibility with legacy analytics. Infrared add-ons, including near-infrared LED arrays, bridge nighttime gaps but risk revealing sensor locations to adversaries equipped with night-vision goggles. Multispectral and hyperspectral products, though nascent, boast an 10.95% forecast CAGR because border forces and petrochemical operators require chemical-signature detection at stand-off distances. Thermal cameras based on uncooled microbolometers thrive in perimeter scenarios where smoke, fog, or foliage blinds visible optics, even though resolutions remain modest at 640 by 480 pixels.
Prototype hyperspectral rigs from FLIR and Specim fell below 2 kg and 15 W in 2024, making them deployable on vehicles and towers rather than only aircraft. Export rules tighten on such gear: U.S. ITAR classifications restrict the distribution of devices offering sub-10 nm band resolution, locking global buyers into defined supply chains and favoring local overhaul centers. Data volumes often exceeding a gigabit per second complicate edge processing, but as chiplets embed spectral unmixing algorithms directly under the pixel plane, these systems will migrate beyond airports into industrial security applications. Overall, the image sensor for security application market recognizes that no single spectral range satisfies all threat vectors, and multi-band fusion will gradually permeate standard bids.
By Processing Type:
Neuromorphic Sensors Target Power-Constrained Niches2D frame-based products accounted for 68.05% of revenue in 2025 and remain the default choice because most video-management software expects standard video streams. Neuromorphic event-based designs, however, are growing at 9.63% CAGR on the back of applications requiring latency under 1 ms and sub-100 mW power budgets, such as solar-powered fences and micro-UAV payloads. Time-of-flight 3D sensors gain traction in access-control terminals where liveness detection stops spoof attacks, though they incur a USD 25 to USD 50 premium over 2D parts. AI-enabled on-chip sensors shipped more than 2 million units in 2024, hinting at an inflection toward inference at the pixel plane.
Prophesee’s Metavision Gen4 hit 1-MP resolution with 10-µs latency and under 50 mW consumption, illustrating the performance leap event-based architectures offer. Integration barriers linger, including limited codec support and scarce expertise in spiking neural networks, which keeps the adoption niche. Time-of-flight modules embed secure illumination at 850 nm for facial geometry mapping, but visibility of the emitter to smartphones raises privacy flags in public spaces. OEMs hedge by designing hybrid boards that accept both frame-based and event-based dies, future-proofing products until standards stabilize. As algorithms converge and toolchains mature, processing-type diversity will redefine upgrade paths for integrators.

By End-Use Sector:
Military Budgets Drive Premium SegmentsDefense and military programs are on course for an 11.08% CAGR, the highest among all end-uses, driven by procurement for thermal, hyperspectral, and SWIR arrays capable of target recognition through smoke, haze, and electronic countermeasures. Commercial and industrial settings, which accounted for 43.89% of 2025 revenue, face flatter trajectories because many retail sites have already deployed multi-camera meshes. Residential systems are growing steadily as subscription business models offset capital expenses for homeowners. Critical-infrastructure operators such as power grids, airports, and pipelines maintain mid-single-digit growth, sustained by regulatory mandates for 30-day video retention and automatic incident alerts.
Defense buyers demand radiation-hardened, encrypted sensors meeting NSA Type-1 criteria, which pushes ASPs far above commercial rates. The U.S. Army’s Integrated Visual Augmentation System awarded USD 220 million of contracts in 2024, stipulating sub-2 W power draw and unmatched low-light acuity. Commercial verticals gravitate toward metadata extraction rather than raw video storage, trimming legal exposure under GDPR and CCPA. Integrators now expect sensors to output object counts, dwell time, and queue length, not just frames, reshaping firmware roadmaps. Across all sectors, the image sensor for security application market continues to polarize: premium military and analytics-heavy commercial tiers thrive, while mid-spec devices face price compression from low-cost Chinese fabless entrants.
Geography Analysis
APAC Image Sensor for Security Application Market
Asia Pacific dominated with 42.05% share of the image sensor for security application market in 2025, underpinned by China’s vast social-credit camera network that topped 700 million units and India’s Safe City Mission funding of INR 480 billion (USD 5.8 billion). Domestic suppliers such as GalaxyCore and SmartSens leverage cost advantages, pricing 5-MP sensors at USD 6 to USD 8 and taking share from incumbents. Japan and South Korea focus on AI-enhanced elder-care deployments: Tokyo’s 2024 tender for 15,000 fall-detection cameras sets a template for super-aging societies.
Europe, North America and Middle East Image Sensor for Security Application Market
The Middle East clocks the fastest growth at 10.42% CAGR, propelled by mega-projects like Saudi Arabia’s NEOM and Dubai’s Smart City scheme, both mandating AI analytics and on-die encryption to observe strict data-localization rules. Israel and Turkey expand defense purchases for thermal and SWIR kits aimed at border surveillance, while Gulf Cooperation Council states issue tenders linking camera density to facility risk ratings. The climate, characterized by dust, heat, and low-contrast night scenes, favors stacked CMOS and InGaAs options, adding premium value to regional orders. North America and Europe jointly represented 37.55% of 2025 revenue but show slower gains because privacy litigation lengthens procurement cycles. The U.S. lacks a federal privacy law, yet California’s Delete Act and Illinois' BIPA raise compliance costs per site by USD 50,000 to USD 200,000. European buyers now lean toward edge-only deployments to skirt GDPR penalties, suspending centralized facial recognition in multiple cities. That said, defense and critical-infrastructure projects remain vibrant: the U.S. Department of Homeland Security awarded USD 420 million for border systems in 2024, and the EU’s NIS2 directive underpins airport analytics spending.
Regulatory Landscape
Regulation affecting image sensors used in security applications is shifting from electrical safety and radio compliance toward software-defined cybersecurity, lifecycle patching, and interoperability requirements. In the United States, the FCC moved ahead with a voluntary IoT cybersecurity labeling program (US Cyber Trust Mark) in 2024, while CISA issued Binding Operational Directive 26-02 in February 2026. The directive directs federal civilian agencies to remove end-of-support edge devices, including IoT cameras, that no longer receive vendor security updates. These policies elevate secure boot, signed firmware, credential management, and updateability from differentiators to procurement prerequisites, shaping sensor and camera module BOM decisions.
Across major buying regions, market access is increasingly tied to named standards and certification schemes. India expanded mandatory essential requirements through MeitY/STQC enforcement in April 2025 for CCTV/camera systems, covering firmware integrity, network security, and supply-chain integrity. South Korea advanced mandatory IP camera security controls via KATS enforcement of KS X 3007:2026 (May 2026), including digital signature verification and TLS 1.2 or higher. In Europe, CEN released EN 62676-4:2026 (July 2026), codifying interoperability by requiring ONVIF Profile T and Profile M support for 8K edge cameras linked to CE-marking eligibility from January 2027. Meanwhile, the EU AI Act reinforces requirements around logging and controls for high-risk uses that often overlap with public-space surveillance deployments.
Competitive Landscape
Sony Semiconductor Solutions, Samsung Electronics, OmniVision Technologies, ON Semiconductor, and STMicroelectronics collectively own roughly 60% of sector revenue, illustrating moderate concentration. Chinese fabless challengers GalaxyCore, SmartSens Technology, and Superpix Micro Technology are eroding price points in the mainstream 5-MP CMOS market by offering discounts of 25% to 35%, expanding their share in Latin America and Southeast Asia. Competitive strategy has shifted to integrating AI accelerators and image signal processors onto the pixel die so that real-time object classification happens at the source, enabling compliance with data-localization statutes.
Sony’s IMX500 exemplifies the pivot, running MobileNet and EfficientNet at 12 fps on under 1 W and reframing the marketing narrative from pixel count to algorithm throughput. Samsung and SK hynix have deepened their commitment to event-based architectures through a KRW 180 billion (USD 135 million) joint venture, targeting 2-MP neuromorphic sensors by 2027. Teledyne’s acquisition of Tower’s 300 mm line widens the shortwave infrared moat and signals vertical expansion into substrate control.
White-space lies in shortwave infrared and neuromorphic domains where price premiums or power advantages offer room for new entrants. Prophesee closed EUR 50 million in Series C funding to scale its Metavision Gen4 platform, while Gpixel shipped 1.2 million specialty sensors for industrial automation. Standards bodies such as IEEE draft secure-boot specifications that could raise compliance costs, inadvertently favoring large incumbents that already maintain security-certification teams. As pricing pressure collides with feature innovation, the image sensor for security application market is likely to polarize between low-cost commodity suppliers and premium, AI-centric solution vendors.
Image Sensor For Security Application Industry Leaders
-
Sony Semiconductor Solutions Corporation
-
Samsung Electronics Co., Ltd.
-
OmniVision Technologies, Inc.
-
ON Semiconductor Corporation
-
STMicroelectronics N.V.
- *Disclaimer: Major Players sorted in no particular order
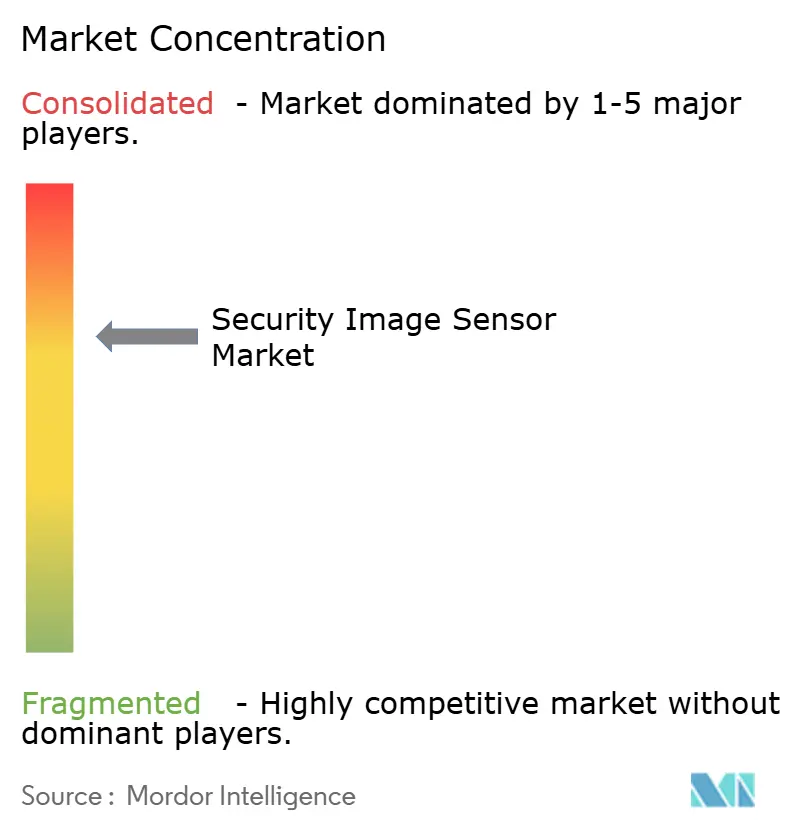
Image Sensor For Security Application Market Companies Covered in this Report
- Sony Semiconductor Solutions Corporation
- Samsung Electronics Co., Ltd.
- OmniVision Technologies, Inc.
- ON Semiconductor Corporation
- STMicroelectronics N.V.
- GalaxyCore Shanghai Limited Corporation
- SmartSens Technology (Shanghai) Co., Ltd.
- SK hynix Inc.
- Canon Inc.
- Panasonic Holdings Corporation
- Toshiba Electronic Devices & Storage Corporation
- PixArt Imaging Inc.
- Hamamatsu Photonics K.K.
- Teledyne Technologies Incorporated
- ams-OSRAM AG
- Himax Technologies, Inc.
- Teledyne e2v Semiconductors SAS
- Gpixel Inc.
- Tower Semiconductor Ltd.
- Forza Silicon Corporation
Read Analysis of Image Sensor For Security Application Companies
Market Opportunities and Future Outlook
Edge analytics programs in smart cities and critical infrastructure create a product opportunity for sensors that combine high dynamic range, low-light performance, and on-device compute. The aim is to reduce raw video movement while still meeting threat-detection mandates. Sony Semiconductor Solutions announcement of the IMX908 in March 2026, a 4K security-camera image sensor using 1.45 micrometer LOFIC pixels to deliver 96 dB HDR in a single-shot exposure, points to where OEM roadmaps are clustering: high-contrast capture that preserves evidentiary detail in glare, headlights, and backlit entries, backed by architectures that support more intelligence at the camera. This aligns with procurement patterns highlighted in the report, where buyers standardize on stacked CMOS and on-sensor processing to cut latency and network load.
Cybersecurity and interoperability tightening also creates whitespace for vendors that can bundle security features and compliance artifacts into the sensor-plus-module offering. Requirements emerging through programs such as the FCC IoT label, India STQC essential requirements, and South Korea KS X 3007:2026 push camera makers to refresh legacy analog and early-IP fleets. Designs increasingly need signed firmware, secure OTA updates, and stronger transport security. That raises the value of sensors that integrate security-oriented functions, including authenticated data paths, tamper-aware operation, and metadata-friendly processing pipelines. In Europe, the move to codify ONVIF-related interoperability for higher-end deployments (EN 62676-4:2026 for 8K edge cameras) supports sensor suppliers that work upstream with VMS, codec, and profile compliance stacks. This is especially relevant in commercial surveillance cameras, which held 45.98% share in 2025 and are moving from passive recording toward analytics-heavy deployments.
Recent Industry Developments in Image Sensor For Security Application Market
- March 2026: Sony Semiconductor Solutions announced the IMX908 4K CMOS image sensor for security cameras, using 1.45 micrometer LOFIC pixels to deliver 96 dB high dynamic range in a single-shot exposure. The release targets difficult surveillance scenes such as entrances and roadways where simultaneous shadow and glare detail matters for identification and evidence capture.
- October 2025: OMNIVISION launched the OX05C, a 5-megapixel global shutter HDR sensor for in-cabin driver and occupant monitoring systems, with mass production scheduled for 2026. The program underscores how global-shutter and HDR architectures developed for safety-critical vision systems are being scaled for always-on sensing use cases that overlap with security and access-control design requirements.
- February 2024: The MIPI Alliance released camera security specifications to enable flexible end-to-end protection of image sensor data streams in automotive camera systems. The framework supports industry alignment around authentication and data protection concepts that camera and sensor vendors can carry into security deployments where firmware integrity and trusted data paths are becoming procurement requirements.
Image Sensor For Security Application Market Report Scope and Research Methodology
Market Definition and Coverage
This market covers revenue from image sensors that are designed into security and surveillance cameras and systems, where the sensor is the key component used to capture usable images for monitoring and threat detection.
Scope exclusions: We exclude complete camera modules, lenses, recorders, video management software, and installation services, unless they are inseparable from the priced image sensor component.
Segments Covered in This Report
- By Application
- Home Security Cameras
- Commercial Surveillance Cameras
- Infrastructure and Traffic Cameras
- Defense and Border Surveillance Cameras
- By Technology
- CMOS Image Sensors
- CCD Image Sensors
- Emerging Technologies (e.g., InGaAs, SWIR)
- By Spectrum
- Visible Spectrum Sensors
- Infrared and Near-Infrared Sensors
- Thermal Sensors
- Multispectral and Hyperspectral Sensors
- By Processing Type
- 2D Image Sensors
- 3D/Time-of-Flight Image Sensors
- AI-Enabled On-Chip Image Sensors
- Neuromorphic Event-Based Sensors
- By End-Use Sector
- Residential
- Commercial and Industrial
- Critical Infrastructure
- Government and Law Enforcement
- Defense and Military
- By Geography
- North America
- United States
- Canada
- Mexico
- Europe
- United Kingdom
- Germany
- France
- Italy
- Rest of Europe
- Asia-Pacific
- China
- Japan
- India
- South Korea
- Rest of Asia
- Middle East and Africa
- Middle East
- Saudi Arabia
- United Arab Emirates
- Rest of Middle East
- Africa
- South Africa
- Egypt
- Rest of Africa
- Middle East
- South America
- Brazil
- Argentina
- Rest of South America
- North America
Data Sources, Market Sizing, and Validation
Desk Research
Desk work started by setting clear boundaries around what counts as a security application image sensor, and then mapping how these sensors flow into cameras used in residential, commercial, infrastructure, and public safety use cases. We used public sources such as US Census trade statistics, Eurostat trade data, the UN Comtrade database, and standards and guidance pages from bodies such as IEC and IEEE to cross-check terminology and device classes.
To anchor supply and demand context, we also reviewed public company filings and investor presentations, reputable press coverage, and patent databases to understand sensor feature shifts (for example, low-light performance and on-chip processing). Where it helped, paid subscriptions for company financials and news intelligence were used to keep product cycle timing and capacity signals consistent in the model. These examples are not exhaustive, and many other sources were also reviewed for data collection, validation, and clarification.
Primary Interviews and Surveys
Primary interviews and surveys were used to test what the desk research could not confirm cleanly, especially how security camera makers and system integrators choose sensor types for different lighting, distance, and latency needs. We spoke with a mix of component suppliers, camera OEMs, distributors, and security project stakeholders across APAC, EMEA, and the Americas so assumptions on pricing, adoption pace, and replacement cycles could be corrected before finalization.
Distribution of primary research fieldwork respondents
| Company type | Respondent position | Region |
|---|---|---|
| Top tier: 26% | CXOs: 15% | APAC: 46% |
| Mid tier: 58% | Functional/Unit leaders: 37% | EMEA: 36% |
| Smaller Players: 16% | Managers: 48% | Americas: 18% |
Market-Sizing & Forecasting
The market size is built using a top-down and bottom-up approach, where the top-down side reconstructs demand from the installed base and shipment mix of security cameras, and then translates that into sensor value using realistic attach rates and average selling prices. Once the main demand pool is formed, we pressure-test it with selective bottom-up checks, such as rolling up sampled supplier revenues tied to security camera programs and running channel checks on typical sensor pricing by performance tier.
Inputs in the model include camera shipment trends by use case (home, commercial, infrastructure, and border security), the share shift toward higher resolution and low-light sensors, the split between visible and infrared capable designs, replacement and upgrade cycles driven by regulations and privacy requirements, and wafer supply or capacity utilization signals that can move pricing. Since some parts of the market are not reported as a standalone line item, gaps were handled through ratio-based allocations that were validated in expert calls, and then rechecked against independent camera market direction.
For forecasting, scenario analysis was used so the outlook can reflect how fast edge analytics adoption, public safety spending, and infrastructure surveillance rollouts are moving in each region. Assumptions on price erosion and mix uplift were updated with what interviewees expected for the next product cycles, and then applied consistently across the forecast period.
Data Validation & Update Cycle
Outputs were cross-verified through triangulation across camera shipment direction, trade and production signals, and the implied sensor revenue per camera, which helps catch totals that look too high or too low for the real device base. When large variances showed up, we re-ran the sensitive inputs, documented the reason for the change, and re-contacted sources if a key assumption could not be defended with evidence.
A multi-step internal review is followed before sign-off, where another analyst checks the math flow, units, and year alignment, and then tests whether growth rates match the stated drivers. Reports are refreshed annually, and interim updates are made when there are material events that change pricing, supply availability, or security spending. Before delivery, a final pass is done so clients receive the most current view available at that time.
Mordor Intelligence's Global Image Sensor Market for Security Application Market Size Compared Against Other Published Estimates
Published market sizes for security application image sensors can look far apart, even when the topic name seems similar, because sources often count different product boundaries and time points. The other big reason is that pricing and mix assumptions can be handled differently, especially when higher performance sensors start gaining share.
The benchmark table shows a noticeable spread that usually comes from what gets counted as a security camera sensor versus what is treated as adjacent imaging demand. In Mordor Intelligence's model, the scope is kept at image sensors used in security and surveillance cameras by application and spectrum, and totals are checked against camera shipment direction and realistic sensor ASP progression rather than bundling camera modules, analytics software, or unrelated industrial imaging demand into the same number.
Benchmark comparison
| Source | Market Size | Gaps in Research Methodology |
|---|---|---|
| Mordor Intelligence | USD 3.73 B (2026) | |
| Trade Journal A | USD 6.14 B (2024) | Uses an earlier year and is likely closer to a security camera supply chain view, which can pull camera-level revenue or module value into what is described as an image sensor market. |
| Regional Consultancy B | USD 2.10 B (2023) | Narrower definition appears to emphasize CMOS sensors only and a limited security subset, which can exclude infrared capable designs, defense and border programs, or higher value processing types included in broader security application coverage. |
Looking across the figures, the main takeaway is that year selection and what gets bundled with the sensor drive most of the gap. By keeping assumptions tied to camera demand signals, spectrum mix, and a clear pricing logic that can be rechecked, our number stays easier to explain and replicate when users update inputs over time.
Key Questions Answered in the Report
How large is the image sensor market for security uses in 2026?
The image sensor market size stands at USD 3.73 billion in 2026 and is projected to grow at an 8.32% CAGR to 2031.
Which application is expanding the quickest?
Defense and border surveillance cameras lead growth with an 11.05% CAGR, driven by rising geopolitical tensions and demand for SWIR and multispectral sensors.
What share of revenue did Asia Pacific hold last year?
Asia Pacific commanded 42.05% of global revenue in 2025, anchored by extensive deployments in China and India.
Why are stacked CMOS sensors important now?
Stacked CMOS combines the pixel array with a logic die, enabling on-chip AI and higher frame rates while reducing backhaul bandwidth and meeting data-localization rules.
What is the biggest supply-chain risk?
A shortage of 300 mm wafer capacity for stacked CMOS continues to extend lead times beyond 26 weeks, pressuring integrators to consider smaller wafers or alternative technologies.
Which new technology might reshape low-power perimeter cameras?
Neuromorphic event-based sensors promise sub-1 ms latency and under 100 mW power draw, making always-on solar-powered surveillance feasible in remote sites.