
Market Overview
| Study Period | 2021 - 2031 |
|---|---|
| Market Size (2026) | USD 14.62 Billion |
| Market Size (2031) | USD 22.47 Billion |
| Growth Rate (2026 - 2031) | 8.98 % |
| Fastest Growing Market | Asia Pacific |
| Largest Market | Asia Pacific |
| Market Concentration | Medium |
Major Players *Disclaimer: Major Players sorted in no particular order Image © Mordor Intelligence. Reuse requires attribution under CC BY 4.0. | |
HVDC Transmission Systems Market Analysis by Mordor Intelligence
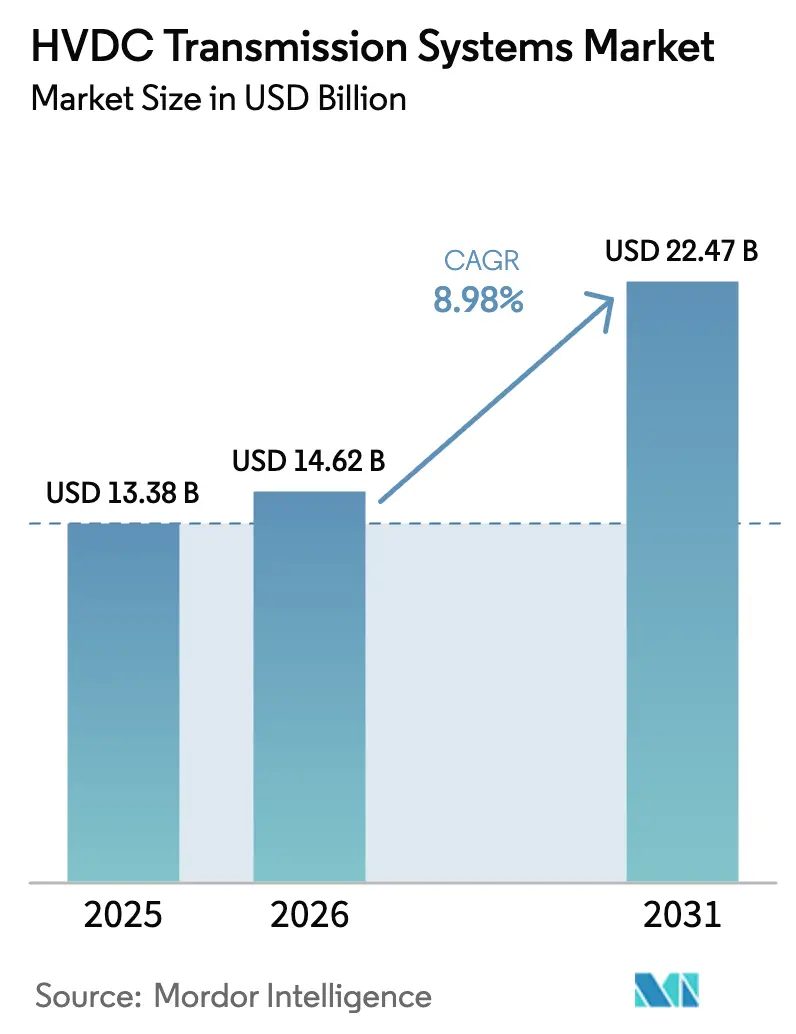
The HVDC Transmission Systems Market size is expected to grow from USD 13.38 billion in 2025 to USD 14.62 billion in 2026 and is forecast to reach USD 22.47 billion by 2031 at 8.98% CAGR over 2026-2031.
Strong capital spending on offshore wind export cables, ultra-high-voltage corridors in Asia, and grid-hardening programs in North America and Europe are steering this advance. Developers increasingly favor voltage-source converter (VSC) schemes because they inject or absorb reactive power without synchronous condensers, cutting both footprint and lifetime operating cost. Converter manufacturers are also capitalizing on an electronics refresh cycle: modular multilevel converter (MMC) stations using 6.5 kV IGBTs, reducing harmonic distortion to below 1% and enabling compliance with stricter grid codes. Meanwhile, cable suppliers are booking record orders as seabed routes outpace overhead corridors; each new gigawatt of offshore wind typically consumes up to 120 km of ±525 kV XLPE cable. A parallel driver is the replacement of aging 1960s-era alternating-current lines whose capacity no longer meets modern renewable build-out targets.
Key Report Takeaways
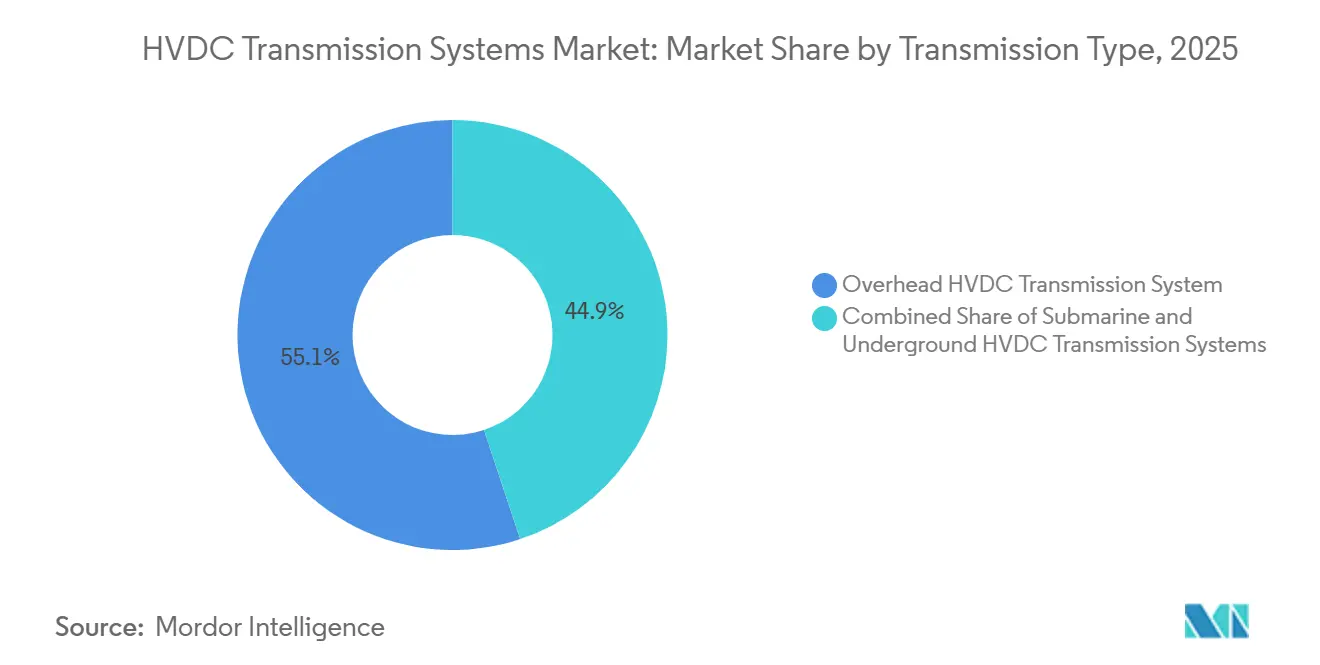
- By transmission type, overhead systems held 55.1% of the HVDC transmission systems market share in 2025, whereas submarine schemes are forecast to expand at an 11.3% CAGR to 2031.
- By component, converter stations captured 53.5% revenue in 2025; the accessories category is advancing at a 10.1% CAGR through 2031.
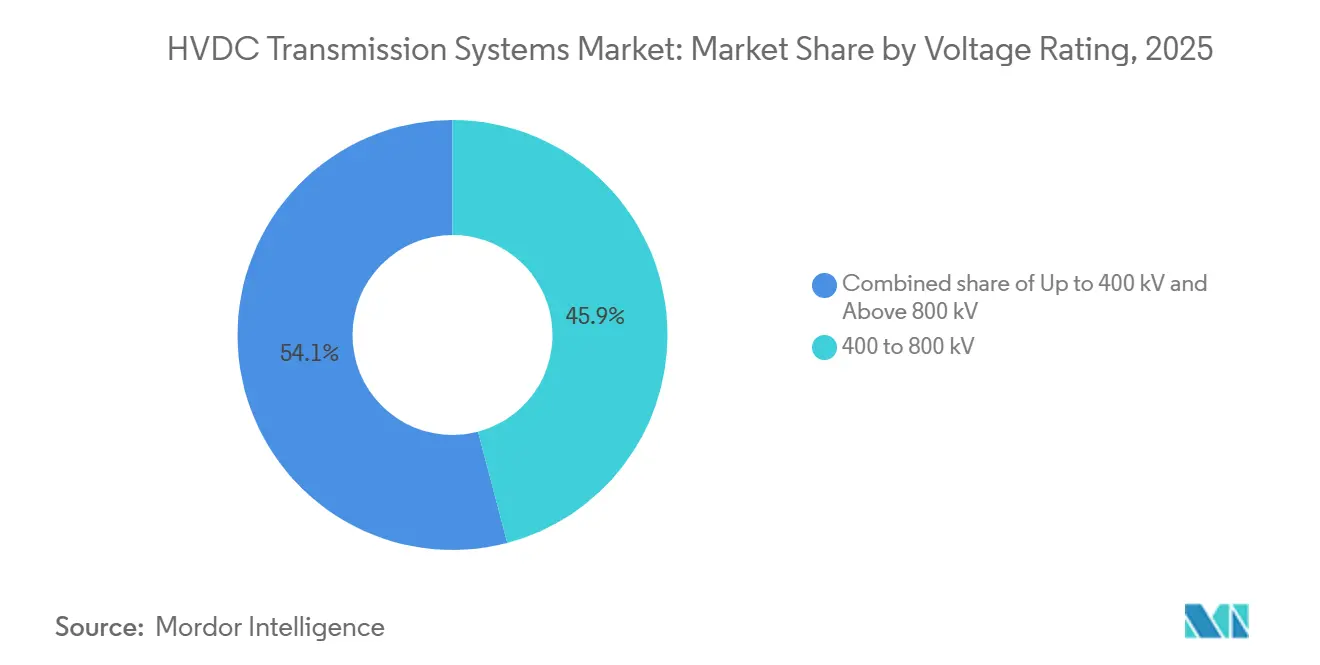
- By voltage rating, the 400 to 800 kV class accounted for 45.9% of installations in 2025, while the above-800 kV tier is expected to post an 11.6% CAGR by 2031.
- By geography, Asia-Pacific commanded 41.6% of 2025 revenue and is set to grow at a 9.9% CAGR through 2031.
Note: Market size and forecast figures in this report are generated using Mordor Intelligence’s proprietary estimation framework, updated with the latest available data and insights as of January 2026.
Market Trends and Insights
Drivers Impact Analysis of HVDC Transmission Systems Market*
| Driver | (~) % Impact on CAGR Forecast | Geographic Relevance | Impact Timeline |
|---|---|---|---|
| Increasing integration of renewable energy generation | +2.1% | Global, with concentration in APAC (China, India), Europe (North Sea offshore wind), North America (Atlantic coast offshore wind) | Medium term (2-4 years) |
| Aging grids & T&D reinvestment cycles | +1.8% | North America & Europe, with spillover to Australia and select Latin American markets (Brazil, Argentina) | Long term (≥ 4 years) |
| Need for long-distance, high-capacity interconnections | +1.6% | APAC core (China west-to-east corridors, India renewable zones), ASEAN cross-border, Middle East GCC grid | Medium term (2-4 years) |
| Electrification of offshore oil & gas assets | +0.9% | North Sea (Norway, UK), Middle East (Saudi Arabia, UAE), Southeast Asia (Malaysia, Indonesia) | Medium term (2-4 years) |
| Multi-vendor offshore wind HVDC hubs | +1.2% | Europe (North Sea Wind Power Hub, TenneT DC overlay), APAC (Taiwan, Japan floating wind), North America (Atlantic Shores) | Long term (≥ 4 years) |
| Defense-critical islanded power corridors | +0.5% | National, with early adoption in strategic island territories (Taiwan, Japan, Australia) | Long term (≥ 4 years) |
| Source: Mordor Intelligence | |||
Increasing Integration of Renewable Energy Generation
Utilities are deploying HVDC corridors to relieve curtailment as variable renewables outpace local load absorption. China’s desert bases host 120 GW of wind and solar, yet local demand absorbs less than 30% of output; the ±800 kV Gansu–Zhejiang link now moves 8 GW across 2,383 km with only 3.2% losses, roughly half those on a 750 kV AC route. In offshore wind, VSC platforms export power beyond 40 km from shore, where AC export becomes uneconomic; the 3,600 MW Dogger Bank project validated this model in 2024. The United Kingdom, India, and Germany now mandate HVDC for renewable zones over 5 GW, accelerating new project sanctions. National regulators increasingly stipulate synthetic inertia delivery, favoring MMC converters that can modulate power within 50 milliseconds. These factors make renewable integration the single largest driver of the HVDC transmission systems market through 2031.[1]Central Electricity Authority of India, “Renewable Evacuation Guidelines,” ceaindia.gov.in
Aging Grids & T&D Reinvestment Cycles
North American and European utilities are replacing 1960s-era AC lines with HVDC to double capacity on existing rights-of-way. The U.S. Department of Energy reserved USD 2.5 billion in 2025 for HVDC corridors that bypass congested 345 kV interties.[2]U.S. Department of Energy, “Transmission Facilitation Program Funding,” energy.gov Germany’s SuedLink, re-scoped from overhead AC to underground ±525 kV HVDC, cut 15 years of local opposition and secured a 2028 go-live date. Brazil’s Furnas added modular multilevel converters to its Rio Madeira bipole, boosting transfer capacity by 1 GW without new conductors. Although converter stations cost USD 150 million to USD 300 million per GW, they defer even costlier parallel AC builds that face lengthy environmental reviews. Consequently, reinvestment cycles will prop up the HVDC transmission systems market for at least the next decade.
Need for Long-Distance, High-Capacity Interconnections
Economic dispatch favors HVDC once overhead lines exceed 600 km or submarine routes surpass 50 km. China’s Baihetan–Jiangsu ±800 kV link spans 2,087 km and moves 8 GW of hydropower, displacing coal generation that would emit 28 million tCO₂ annually. ASEAN’s 1,400 km Lao-Thailand-Malaysia-Singapore corridor plans to carry 3 GW by 2030. Australia’s 1,500 MW Marinus Link chose HVDC after AC studies showed the need for three parallel cables and reactive compensation platforms costing AUD 1.2 billion more. Bidirectional flow capability also underpins the 3 GW Saudi-Egypt link, which balances seasonal peaks across the Red Sea. These examples illustrate how long-haul corridors continue to expand the HVDC transmission systems market.
Electrification of Offshore Oil & Gas Assets
Regulators are placing carbon-pricing pressure on offshore installations powered by gas turbines that emit up to 20 million tCO₂ yearly in the North Sea alone. Norway now requires shore-power evaluations for all new fields, prompting 450 MW of HVDC orders covering Johan Sverdrup, Johan Castberg, and Snorre. Saudi Aramco followed in 2025 with two 300 MW VSC links to the Marjan and Berri complexes, freeing associated gas for petrochemical feedstock. Economics hinge on carbon prices above EUR 90 per tonne, where avoided emissions offset converter capital cost over a 15-year field life. Even in lower-priced carbon regimes such as Malaysia, operators have begun feasibility studies to hedge against future regulation. Such projects add a specialized but expanding niche to the HVDC transmission systems market.
Restraints Impact Analysis of HVDC Transmission Systems Market*
| Restraint | (~) % Impact on CAGR Forecast | Geographic Relevance | Impact Timeline |
|---|---|---|---|
| High upfront capital & permitting hurdles | -1.4% | Global, with acute impact in North America (NEPA reviews), Europe (cross-border approvals), Latin America (financing constraints) | Short term (≤ 2 years) |
| Distributed & behind-the-meter generation growth | -0.7% | North America, Europe, Australia (rooftop solar penetration), with emerging impact in India and Southeast Asia | Medium term (2-4 years) |
| Global shortage of XLPE / MI HVDC cable core | -1.1% | Global, with supply bottlenecks concentrated in Europe (Prysmian, Nexans, NKT production lines) | Short term (≤ 2 years) |
| Lack of interoperability standards for multi-vendor MT-HVDC | -0.6% | Europe (North Sea hubs), APAC (China-ASEAN interconnections), North America (offshore wind meshed grids) | Long term (≥ 4 years) |
| Source: Mordor Intelligence | |||
High Upfront Capital & Permitting Hurdles
Converter stations cost 50%–70% more per MW than comparable AC substations, and permitting often exceeds four years. The 1,250 MW Champlain Hudson Power Express required 14 years of approvals, pushing costs from USD 2.2 billion to USD 3.9 billion. Germany’s SuedLink saw its budget triple to EUR 10 billion after 27 route changes mandated by regulators. Emerging-market developers face higher financing costs: Brazil’s Belo Monte line needed 70% debt underwriting from BNDES because commercial banks balked at currency risk.[3]BNDES, “Belo Monte Transmission Financing,” bndes.gov.br
Distributed & Behind-the-Meter Generation Growth
Rooftop solar and residential batteries reduce peak-hour demand, weakening the utilization case for bulk transmission in mature economies. Behind-the-meter solar in California reached 18 GW in 2025, forcing curtailment of 2.4 TWh of utility-scale renewables and deferring planned HVDC links with Arizona.[4]California ISO, “2025 Annual Curtailment Report,” caiso.com Australia’s residential battery installations grew 40% in 2025, prompting a 1 GW downgrade of proposed interconnectors. Similar trends in Germany caused regulators to question the Ultranet HVDC corridor.
*Our forecasts treat driver/restraint impacts as directional, not additive. The impact forecasts reflect baseline growth, mix effects, and variable interactions.
HVDC Transmission Systems Market Segment Analysis
By Transmission Type:
Subsea Cables Outpace Overhead GrowthOverhead corridors held 55.1% of the HVDC transmission systems market share in 2025. They remain the least-cost option for long-haul terrestrial transfers; China’s ±800 kV lines deliver power at USD 0.012 per kWh per 1,000 km, roughly 40% below comparable AC rates. Yet environmental opposition and urban density are slowing new overhead builds. Germany buried SuedLink underground at a 35% cost premium to avoid a decade of litigation.
Submarine links are forecast to grow at an 11.3% CAGR between 2026 and 2031, the fastest among transmission types. Offshore wind pipelines in the North Sea alone require 60 km–120 km of export cable per gigawatt, keeping factories at Prysmian and Nexans booked well into 2029. Underground HVDC sits between the two, typically chosen where overhead rights-of-way face insurmountable opposition; Italy’s 1,000 MW Tyrrhenian Link accepted a 35% premium to preserve UNESCO sites.


By Component:
Converter Stations Dominate, Accessories AccelerateConverter stations garnered 53.5% of 2025 revenue because each GW of VSC capacity demands 400–600 IGBT submodules that can total USD 150 million–USD 300 million per GW. Although cable revenue ranks second, XLPE extrusion bottlenecks now cap cable growth at an 8.5% CAGR through 2031.
Accessories, control systems, DC breakers, and cybersecurity modules will rise at a 10.1% CAGR thanks to emerging meshed grids. Hitachi Energy’s hybrid breaker interrupts 16 kA in 2 milliseconds and has already logged 60 unit orders for North Sea projects.
By Voltage Rating:
Ultra-High Voltage Gains TractionInstallations in the 400 to 800 kV band captured 45.9% of 2025 deployments. ±525 kV VSC links balance semiconductor losses with manageable converter costs, making them the default choice for offshore wind exports. Ultra-high-voltage systems above 800 kV will grow at an 11.6% CAGR during 2026-2031, driven by China’s ±1,100 kV corridors carrying 12 GW over 3,000 km with sub-7% losses.
Sub-400 kV links hold niche roles such as electrifying offshore platforms; Norway approved six ±320 kV projects totaling 1.8 GW since 2024. Each voltage class thus aligns to distinct application needs, collectively expanding the HVDC transmission systems market.
Geography Analysis
APAC HVDC Transmission Systems Market
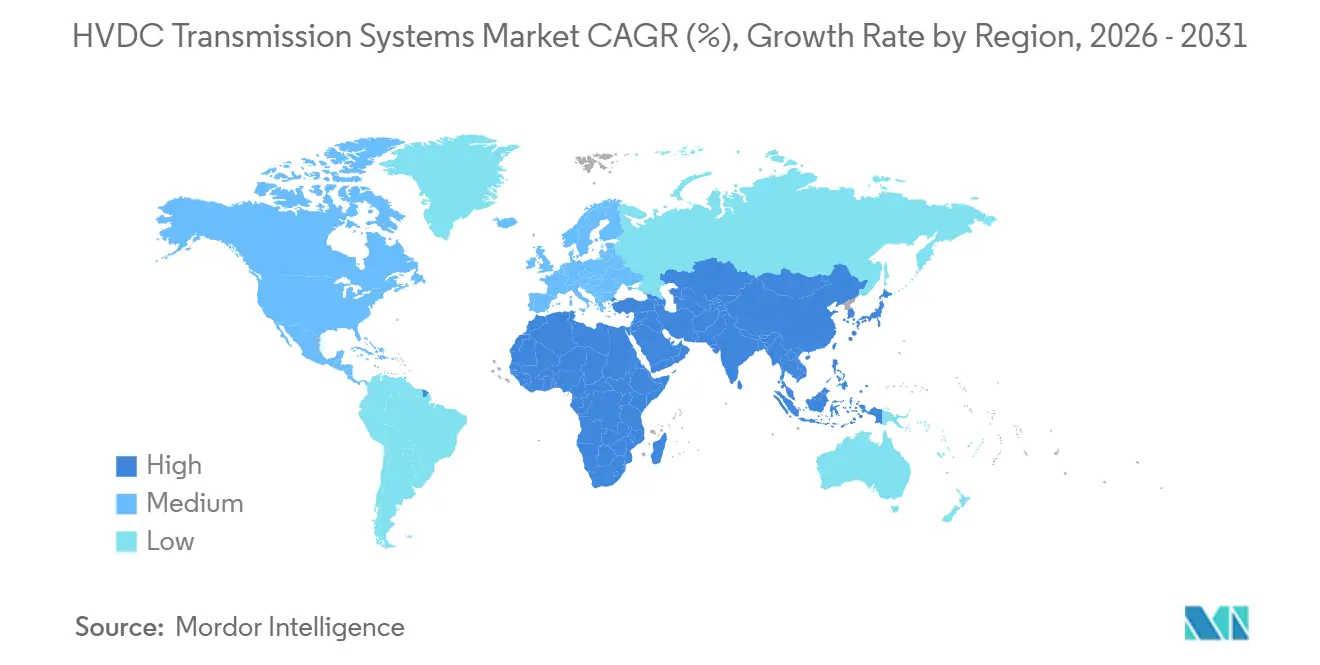
Asia-Pacific generated 41.6% of global revenue in 2025 and is expected to post a 9.9% CAGR to 2031. State Grid commissioned the 16 GW Baihetan–Jiangsu and Baihetan–Zhejiang lines in 2025, shrinking east-coast coal burn by 35 million t annually. India’s Phase-II Green Energy Corridors add 6 GW via the 1,830 km Raigarh–Pugalur link and three intra-state projects, cutting renewable curtailment from 12% in 2024 to below 3% by 2028. ASEAN’s 3 GW power-integration corridor and Australia’s 1.5 GW Marinus Link underscore regional momentum.
Europe HVDC Transmission Systems Market
Europe follows with aggressive offshore mandates. The TEN-E regulation requires HVDC for any wind farm beyond 12 nautical miles, triggering EUR 8 billion of cable and converter orders since 2024. Germany’s SuedLink and A-Nord underground projects will send 8 GW southward by 2028, enabling lignite retirements. The UK’s Dogger Bank export cables and Eastern Link subsea route add another 7.6 GW of transfer capacity. Nordic hydropower balancing via NordLink and North Sea Link earned Norway EUR 500 million in arbitrage revenue during 2025.
The Americas HVDC Transmission Systems Market
North America remains bifurcated. Atlantic offshore wind requires radial HVDC exports, yet onshore converter permitting stretches three years, delaying Empire Wind to 2028. Cross-border schemes such as the 1.25 GW Champlain Hudson Power Express reached service in 2025, delivering Canadian hydropower into New York. Mexico’s Baja-Sonora study and Brazil’s long-distance corridors round out the hemisphere’s activity.

Regulatory Landscape
HVDC projects are governed by grid-connection codes, licensing regimes, and procurement rules that increasingly formalize performance requirements for converter-based assets and cross-border operability. In Europe, Commission Regulation (EU) 2016/1447 (Network Code on HVDC) sets technical requirements for HVDC systems and DC-connected power park modules, with implementation coordinated through ENTSO-E. In January 2024, ACER issued Recommendation 01/2024 proposing amendments that expand the code to cover additional DC-connected assets such as energy storage modules, power-to-gas units, and asynchronously connected demand facilities, aligning HVDC compliance work with the growing mix of controllable loads and storage connected to transmission networks.
In India, inter-state HVDC development is shaped by Central Electricity Regulatory Commission (CERC) processes for transmission licensing and by Ministry of Power tariff-based competitive bidding (TBCB) guidelines used to procure new transmission capacity. In February 2026, KPS III HVDC Transmission Limited received a recommendation for a transmission license from the Central Transmission Utility for the Khavda Phase-V HVDC project in Gujarat, reflecting continued use of centralized licensing and structured procurement to accelerate renewable evacuation corridors. At the technical standard level, IEC documentation for multi-vendor HVDC grid systems (for example, IEC TS 63291-1:2023) supports planning and specification practices that reduce integration risk as multi-terminal and multi-vendor HVDC hubs become more common.
Competitive Landscape
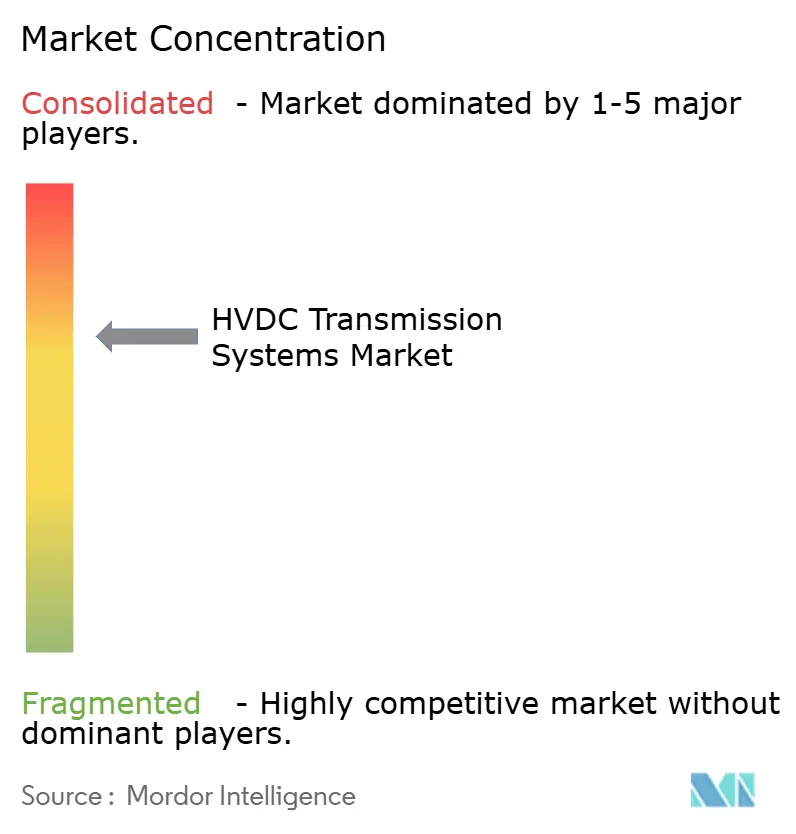
The five largest converter suppliers, Hitachi Energy, Siemens Energy, GE Vernova, Mitsubishi Electric, and TBEA, collectively hold about 60% of global revenue, leaving room for regional challengers. Hitachi Energy leads VSC deliveries with 40% of the installed base and 60 hybrid DC breakers on order. Siemens Energy is vertically integrating IGBT fabrication, shaving converter costs by 12% and capturing recent Saudi contracts. Chinese firms dominate ultra-high-voltage LCC projects and leverage concessional financing from China Development Bank to win Southeast Asian bids.
Hybrid AC-DC software coordination has emerged as a white-space opportunity. GE Vernova’s Grid Software unit aims to supply the algorithms that balance power flows across dual networks. Medium-sized players such as Hyosung Heavy Industries and LS Cable target 200–400 MW shore-power packages, undercutting Tier-1 bespoke solutions by 20%. Product roadmaps reveal diverging bets: Siemens files patents on low-cost submodule designs, while Chinese suppliers focus on insulation breakthroughs for ±1,500 kV corridors.
HVDC Transmission Systems Industry Leaders
Siemens Energy AG
Nexans S.A.
Prysmian Group
ABB Ltd (Hitachi Energy)
GE Vernova, Inc.
- *Disclaimer: Major Players sorted in no particular order
HVDC Transmission Systems Market Companies Covered in this Report
- ABB Ltd (Hitachi Energy)
- Siemens Energy AG
- GE Vernova, Inc.
- Mitsubishi Electric Corporation
- Toshiba Corporation
- Prysmian Group
- Nexans S.A.
- NKT A/S
- Sumitomo Electric Industries
- LS Cable & System
- TBEA Co., Ltd.
- State Grid Corporation of China
- NR Electric Co., Ltd.
- Bharat Heavy Electricals Ltd.
- CHINT Group
- Trench Group
- Schneider Electric SE
- Hyosung Heavy Industries
- ZTT Group

Market Opportunities and Future Outlook
Programmatic renewable evacuation and interconnection buildouts are creating near-term whitespace for turnkey HVDC packages and for enabling technologies that reduce delivery risk, particularly where regulators are tightening schedule discipline. In India, a CERC transmission license granted in May 2026 to KPS III HVDC Transmission Limited for a 2.5 GW, 500 kV HVDC bipole in Gujarat (Khavda renewable evacuation) reinforces the project pipeline around high-capacity corridors. The Central Electricity Authority's June 2026 move to standardize timelines with a maximum completion period of 54 months for new HVDC projects shifts attention to solutions that improve constructability, commissioning readiness, and multi-party interface management. This environment favors suppliers with validated converter platforms, proven control and protection stacks, and delivery models that can align permitting, procurement, and factory slots.
Standardization and utility-led specification work are also opening opportunities in multi-vendor planning, grid-forming controls, and interoperability toolchains that support VSC-heavy networks and offshore export systems. The publication of IEC TR 63179:2026 provides structured planning guidance for comparing LCC, VSC, and AC alternatives, helping utilities formalize architecture selection beyond lowest-capex approaches. In Korea, KEPCO's February 2026 consulting contract with Hitachi Energy to define technical specifications for the 2 GW, 525 kV Saemangeum-Seohwaseong VSC project highlights demand for front-end engineering, system studies, and specification support that can be replicated across national programs. On the North American side, the completion of the 1,250 MW Champlain Hudson Power Express HVDC link provides an operating reference for long-distance, high-capacity HVDC delivery into dense load centers, supporting follow-on opportunities in converter station upgrades, lifecycle services, and grid-software coordination for mixed AC-DC operation.
Recent Industry Developments in HVDC Transmission Systems Market
- June 2026: Hitachi Energy won a EUR 770 million contract from Terna and STEG to deliver the converter stations for the Elmed interconnector between Italy and Tunisia. The project advances a first-of-its-kind Europe-North Africa DC link, supporting demand for large VSC converter station engineering and cross-border grid-code compliance capabilities.
- December 2025: GE Vernova and Seatrium secured a major contract from TenneT for offshore HVDC converter platforms and related equipment for 2 GW grid connections. The award underlines the shift toward repeatable 2 GW-class offshore HVDC platforms and adds volume visibility for OEM manufacturing and marine integration capacity.
- June 2024: LS Cable and System started mass production of 525 kV HVDC cables intended for TenneT's 2 GW grid connection systems, BalWin4 and LanWin1. Scaling 525 kV cable output supports the North Sea offshore wind export pipeline and helps ease one of the main supply constraints affecting HVDC project schedules.


HVDC Transmission Systems Market Report Scope and Research Methodology
Market Definition and Coverage
For this study, the market covers HVDC transmission systems sold for power transmission, including converter stations, transmission medium (cables and related line items), and associated system equipment that enables long distance DC power transfer across overhead, underground, and submarine routes.
Scope exclusions: We exclude routine grid O&M services and general EPC services that are not specific to HVDC system supply.
Segments Covered in This Report
- By Transmission Type
- Submarine HVDC Transmission System
- Overhead HVDC Transmission System
- Underground HVDC Transmission System
- By Component
- Converter Stations
- Transmission Medium (Cables)
- Others (Control & Protection Systems, Reactive Power Equipment, Accessories)
- By Voltage Rating
- Up to 400 kV
- 400 to 800 kV
- Above 800 kV
- By Geography
- North America
- United States
- Canada
- Mexico
- Europe
- United Kingdom
- Germany
- France
- Italy
- NORDIC Countries
- Russia
- Rest of Europe
- Asia-Pacific
- China
- India
- Japan
- South Korea
- ASEAN Countries
- Australia and New Zealand
- Rest of Asia-Pacific
- South America
- Brazil
- Argentina
- Colombia
- Rest of South America
- Middle East and Africa
- United Arab Emirates
- Saudi Arabia
- South Africa
- Egypt
- Rest of Middle East and Africa
- North America
Data Sources, Market Sizing, and Validation
Desk Research
Desk research was used to build the market context, set clear scope boundaries, and assemble the starting inputs that can be checked against public data. We mainly relied on sources such as energy regulator and ministry publications, transmission operator planning documents, grid interconnection announcements, and international energy statistics from bodies such as IEA and IRENA.
To ground the model in real build activity, we also reviewed sources such as customs and trade statistics, public tender portals for transmission projects, and standards and technical papers from IEEE and CIGRE. These inputs helped validate typical configurations and how voltage classes are adopted in practice. Company annual reports, investor presentations, and credible press releases were used to confirm order intake themes and project timing, and a paid subscription for company financials and patent intelligence was referenced selectively to cross-check supplier exposure and technology direction. These examples are not exhaustive, and other public and paid sources were also used for data collection, validation, and clarification.
Primary Interviews and Surveys
Primary work focused on validating what is actually being bought and installed across regions, then tightening assumptions that desk research cannot confirm consistently. We spoke with a mix of OEM and component-side experts, utilities and transmission developers, and engineering consultants across APAC, EMEA, and the Americas. This helped align the final model to regional project pipelines and pricing realities.
Distribution of primary research fieldwork respondents
| Company type | Respondent position | Region |
|---|---|---|
| Top tier: 33% | CXOs: 14% | APAC: 41% |
| Mid tier: 49% | Functional/Unit leaders: 39% | EMEA: 32% |
| Smaller Players: 18% | Managers: 47% | Americas: 27% |
Market-Sizing & Forecasting
Sizing was built using a top-down approach where grid expansion signals, HVDC project commissioning schedules, and voltage class penetration patterns are used to reconstruct annual demand in value terms. The totals were then checked with selective bottom-up approximations by rolling up sampled supplier disclosures and using sanity checks like typical converter station value per link and cable value per km, which helped adjust for under-reporting and timing gaps.
Key inputs tracked (illustrative) included announced and under-construction HVDC links, overhead versus underground versus submarine mix, voltage rating split (up to 400 kV, 400-800 kV, and above 800 kV), order-to-delivery lag for major projects, and ASP movement tied to metals and high voltage cable pricing cycles. When project disclosures were incomplete, missing parameters were filled using benchmarks from similar projects and then re-validated through interviews so the gap handling stayed consistent.
For forecasting, scenario analysis was used around build-out pace and project slippage, and then the most probable path was selected based on expert consensus on policy support for renewables integration, cross-border interconnectors, and grid reliability needs. Regional growth rates were not applied mechanically, because shifts in submarine demand and very high voltage corridors can change the mix quickly, and the model needed to capture that.
Data Validation & Update Cycle
Outputs were triangulated against independent signals like project awards, commissioning trackers, and regional transmission spending indicators, then reviewed for anomalies such as step-changes that did not align with known project timing. When a variance was spotted, the related assumptions were revisited and, if needed, respondents were re-contacted to confirm whether the change was real or timing-related.
Before sign-off, the model and narrative are reviewed in multiple steps so the calculation logic, currency handling, and scope alignment remain consistent across regions and years. Reports are refreshed annually, with interim updates when material events occur, and a final pre-delivery check is completed so clients receive an up-to-date view.
Mordor Intelligence's Global Hvdc Transmission Systems Market Market Size Measured Against Other Published Estimates
Published market sizes for HVDC transmission systems often vary because the category can be defined differently across equipment, project types, and what is counted as a system sale versus broader grid spending. Differences also show up when firms pick different base years, use different currency timing, or treat project delays in separate ways.
EPC-only project revenue sits outside Mordor Intelligence's scope, which is why estimates that bundle total turnkey transmission project value can appear higher even when the project pipeline is similar. The spread can also come from how converter stations versus transmission medium are priced, whether very high voltage corridors are weighted more heavily, and how submarine link announcements are converted into yearly revenue when delivery schedules shift.
Benchmark comparison
| Source | Market Size | Gaps in Research Methodology |
|---|---|---|
| Mordor Intelligence | USD 13.38 B (2025) | |
| Global Consultancy A | USD 12.69 B (2025) | Uses a narrower revenue build that can undercount ancillary system equipment and may smooth project timing, which reduces step-ups tied to large corridor commissioning. |
| Industry Publisher B | USD 11.70 B (2025) | Leans more on reported system shipments and headline project values without consistently normalizing voltage class mix and regional pricing, which can pull down the base year when APAC dominates installations. |
Looking across the three numbers, most of the gap is explained by what is included in a system sale, plus how project slippage and voltage class mix are translated into annual revenue. By keeping inputs tied to observable project schedules, component splits, and region-level pricing checks, the final figure stays traceable and repeatable even when announcements change.


Key Questions Answered in the Report
How large is the HVDC transmission systems market today?
It stood at USD 14.62 billion in 2026 and is forecast to reach USD 22.47 billion by 2031, reflecting an 8.98% CAGR.
Which segment holds the highest HVDC transmission systems market share?
Overhead corridors led with 55.1% share in 2025, mainly due to lower per-kilometer costs over long terrestrial routes.
What is the fastest-growing transmission type?
Submarine schemes tied to offshore wind are projected to grow at 11.3% CAGR between 2026 and 2031.
Why are converter stations the largest revenue contributor?
Each gigawatt of VSC capacity requires hundreds of power-electronic modules, pushing converter costs to USD 150 million–USD 300 million per GW.
Which region offers the strongest growth outlook?
Asia-Pacific is expected to expand at a 9.9% CAGR through 2031, driven by ultra-high-voltage corridors in China and India’s Green Energy Corridors.
Page last updated on:


 Your data is secure and never sold or shared.


