
Market Overview
| Study Period | 2020 - 2031 |
|---|---|
| Market Size (2026) | USD 14.48 Billion |
| Market Size (2031) | USD 19.4 Billion |
| Growth Rate (2026 - 2031) | 6.05 % |
| Fastest Growing Market | Asia-Pacific |
| Largest Market | North America |
| Market Concentration | Medium |
Major Players *Disclaimer: Major Players sorted in no particular order Image © Mordor Intelligence. Reuse requires attribution under CC BY 4.0. | |
Household Coffee Machine Market Analysis by Mordor Intelligence
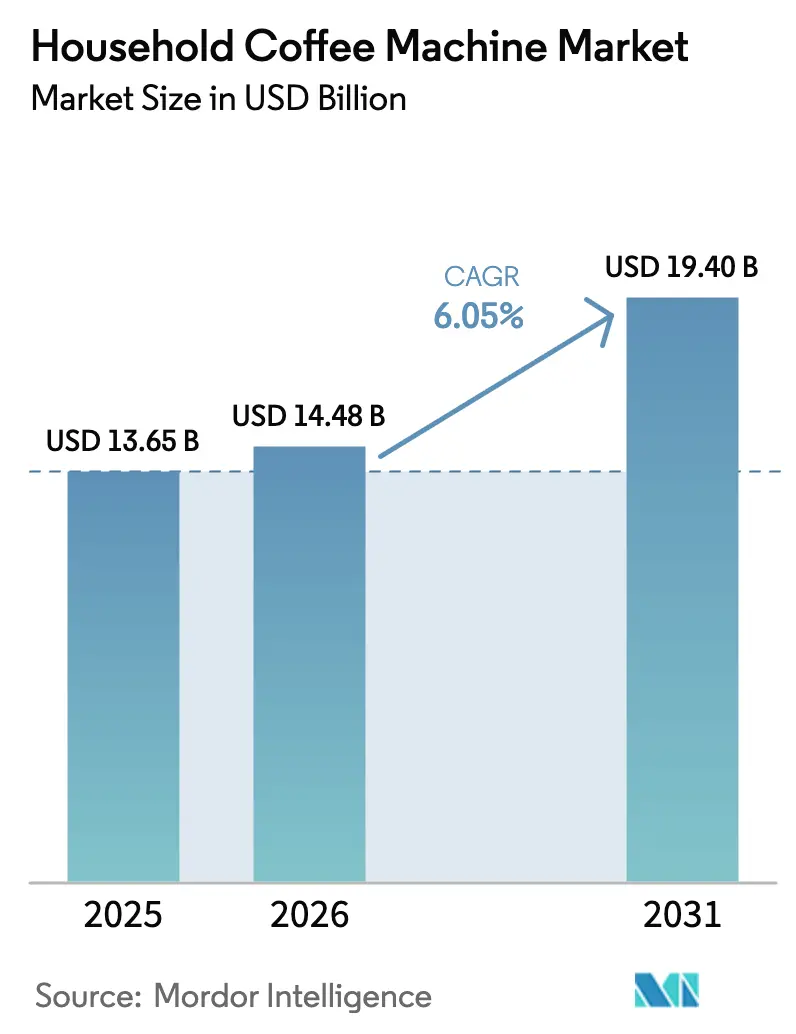
The household coffee machines market size was valued at USD 13.65 billion in 2025 and estimated to grow from USD 14.48 billion in 2026 to reach USD 19.4 billion by 2031, at a CAGR of 6.05% during the forecast period (2026-2031). Rising in-home coffee preparation, premium home-brewing experiences that undercut café prices, and improving smart-appliance technology combine to accelerate the coffee machine market. Consumers in developed economies increasingly substitute retail visits with premium pods, bean-to-cup automation, and connected brewers that mimic barista output. Regulatory moves that reward energy-efficient designs spur innovation and replacement demand, while digital shopping habits broaden access to a wider product range. The fast-evolving competitive field now blends long-standing appliance leaders with agile entrants leveraging e-commerce reach and smart-home ecosystems.
Key Report Takeaways
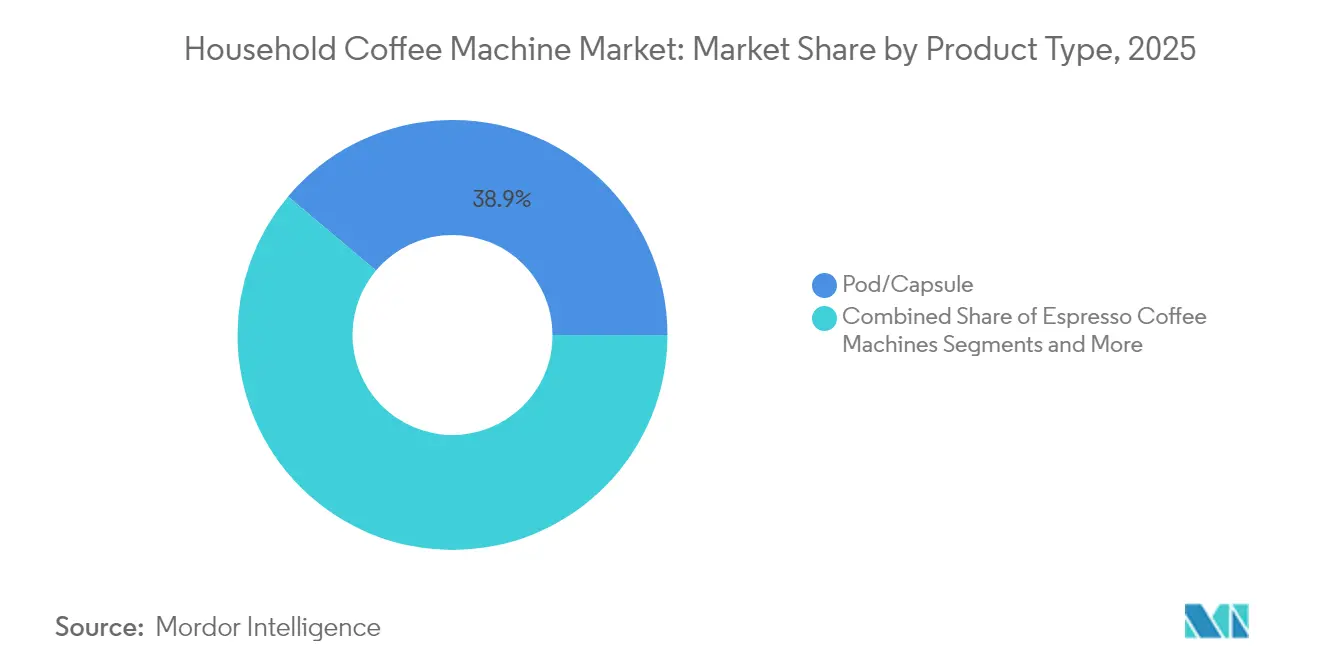
- By product type, pod and capsule machines led with 38.86% of household coffee machines market share in 2025, while bean-to-cup machines are projected to expand at an 8.34% CAGR through 2031.
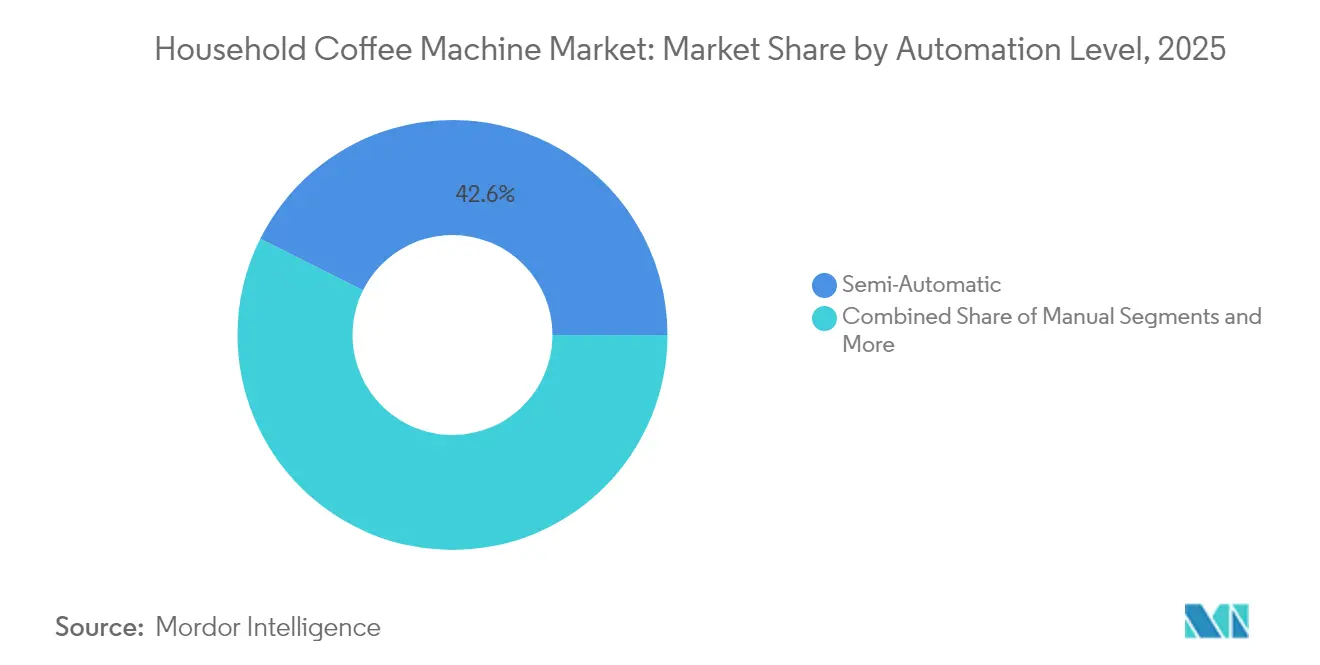
- By automation level, semi-automatic machines accounted for 42.62% of the household coffee machines market size in 2025; fully automatic units recorded the fastest trajectory at 7.75% CAGR.
- By distribution channel, supermarkets and hypermarkets held 46.85% of the household coffee machines revenue share in 2025, whereas online retail is advancing at a 9.22% CAGR to 2031.
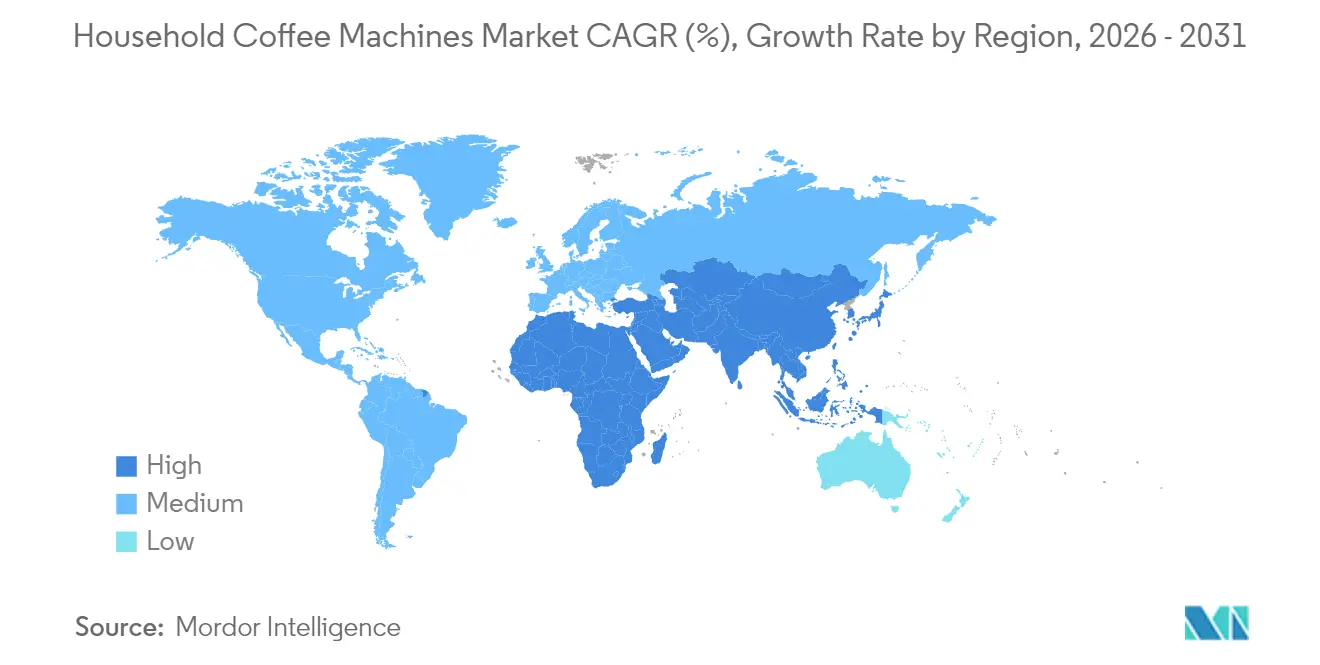
- By geography, North America represented 32.88% of the household coffee machines revenue in 2025, while Asia-Pacific is set to post the highest regional CAGR at 7.41% by 2031.
- Keurig Dr Pepper, De’Longhi Group, Nestlé Nespresso, Breville Group, and Hamilton Beach collectively controlled a sizable portion of the global market in 2024.
Note: Market size and forecast figures in this report are generated using Mordor Intelligence’s proprietary estimation framework, updated with the latest available data and insights as of 2026.
Market Trends and Insights
Drivers Impact Analysis of Household Coffee Machine Market*
| Driver | (~) % Impact on CAGR Forecast | Geographic Relevance | Impact Timeline |
|---|---|---|---|
| Consumer Shift to At-Home Coffee Rituals in North America & Europe | +1.8% | North America & Europe | Medium term (2-4 years) |
| Convenience-Led Surge in Pod/Capsule Subscriptions | +1.2% | Global, strongest in North America | Short term (≤ 2 years) |
| Growing Espresso Culture in Tier-1 Asian Cities | +1.5% | Asia-Pacific core, spill-over to MEA | Long term (≥ 4 years) |
| IoT-Enabled Smart Machines Elevating Replacement Demand | +0.9% | Global, led by North America & Europe | Medium term (2-4 years) |
| Energy-Efficient Designs Driven by EU Eco-Directives | +0.7% | Europe, with global manufacturing implications | Long term (≥ 4 years) |
| Direct-to-Consumer Bundled Coffee-Machine Plans | +0.4% | Global, strongest in developed markets | Short term (≤ 2 years) |
| Source: Mordor Intelligence | |||


Consumer Shift to At-Home Coffee Rituals in North America and Europe
Remote and hybrid work patterns entrenched a daily home-brewing habit across developed markets. Household penetration of single-serve and bean-to-cup appliances rose alongside inflation-driven café avoidance. The National Coffee Association reported that coffee would replace bottled water as the most purchased beverage by US consumers in 2025[1]Source: National Coffee Association, “National Coffee Data Trends 2025,” ncausa.org . Manufacturers responded with compact countertop designs and flavor-forward recipes that replicate café specials, such as pistachio lattes, boosting premium equipment sales. Seasonal flavor experimentation resonates with Gen Z buyers who favor personalization. These lifestyle shifts sustain demand beyond cyclical income changes, embedding long-term volume growth for the coffee machines market.
Convenience-Led Surge in Pod and Capsule Subscriptions
Subscription plans that bundle brewers with recurring capsule deliveries transform one-time hardware purchases into annuity streams for brand owners. Keurig Dr Pepper reported an installed base exceeding 38 million US households, demonstrating the lock-in advantage of closed systems. Nespresso’s direct-to-consumer expansion in Asia couples rapid capsule replenishment with premium positioning that appeals to new urban consumers. EU circular-economy rules accelerate the shift toward aluminum and compostable capsules, and industry leaders fund in-market recycling schemes that mitigate environmental concerns. Convenience, portion control, and mess-free disposal keep pod machines central to daily routines, ensuring sustained volume momentum.
Growing Espresso Culture in Tier-1 Asian Cities
Rising middle-class incomes and aspirational café lifestyles underpin strong espresso adoption in Mainland China, India, and Southeast Asia. China overtook the United States in branded coffee shop outlets in 2024, and Sucafina forecasts Asian coffee consumption to climb above 4.4% annually by 2026. Mobile-app ordering now accounts for 80% of Chinese coffee transactions, setting expectations for connected home devices that integrate with popular payment and loyalty platforms. First-time buyers often enter through affordable capsule systems before trading up to bean-to-cup units as palates mature. The region’s demographic profile and digital openness position Asia-Pacific as the primary growth engine for the coffee machines market.
IoT-Enabled Smart Machines Elevating Replacement Demand
Connected brewers move coffee preparation from manual prints to data-rich experiences. ThermoplanConnect enables live diagnostics, remote recipe updates, and fleet management, reducing downtime for commercial operators. At the household level, voice assistants trigger scheduled brewing, while apps learn consumption patterns to optimize energy use. The US Department of Energy has published upgraded energy conservation standards for coffee brewers that take effect in 2029[2]Source: Federal Register, “Energy Conservation Program: Revised Standards for Commercial Coffee Brewers,” federalregister.gov . Compliance favors new-generation machines with smart power management and efficient heating elements, prompting accelerated replacement cycles. The technology premium widens margins and differentiates brands in a crowded field.
Restraints Impact Analysis of Household Coffee Machine Market*
| Restraint | (~) % Impact on CAGR Forecast | Geographic Relevance | Impact Timeline |
|---|---|---|---|
| High ASPs Limiting Penetration in Price-Sensitive South America | -0.8% | South America, with spillover to emerging markets | Medium term (2-4 years) |
| Regulatory Scrutiny on Single-Use Capsules in the EU | -0.6% | Europe, with global implications for manufacturers | Long term (≥ 4 years) |
| Semiconductor Shortages Inflating Lead-Times | -0.5% | Global, most acute in Asia-Pacific manufacturing | Short term (≤ 2 years) |
| RTD Coffee Popularity Cannibalising Entry-Level Machines | -0.4% | Global, strongest in North America | Medium term (2-4 years) |
| Source: Mordor Intelligence | |||
High ASPs Limiting Penetration in Price-Sensitive South America
Currency devaluation and commodity-driven inflation lift the cost of imported appliances in several Latin markets. Retail coffee prices in Brazil spiked in 2024, and additional increases are forecast for 2025, constraining discretionary spending. Entry-level machines hold their ground, yet premium espresso systems struggle for reach. Select manufacturers pivot to modular designs that allow gradual feature upgrades, improving affordability. Simultaneously, premium coffee beans enjoy double-digit growth in metropolitan Brazil, signaling distinct niches within the region. Targeted promotional finance and local assembly agreements could narrow the price gap over the medium term.
Regulatory Scrutiny on Single-Use Capsules in the EU
Europe continues to tighten sustainability mandates. The new Ecodesign Regulation (EU) 2024/1781 enforces minimum energy-efficiency thresholds and recyclable materials for coffee appliances[3]Source: European Parliament, “Regulation (EU) 2024/1781 Establishing Ecodesign Requirements,” europarl.europa.eu . Manufacturers must also prepare digital product passports that track resource usage over a unit’s life. Compliance costs weigh more heavily on smaller producers, prompting consolidation and technology partnerships. Market leaders invest in recycled aluminum flows and biodegradable polymer research to preserve capsule convenience while meeting environmental objectives. Although the rules raise short-term costs, they stimulate innovation that supports long-term competitiveness in the coffee machines market.
*Our forecasts treat driver/restraint impacts as directional, not additive. The impact forecasts reflect baseline growth, mix effects, and variable interactions.
Household Coffee Machine Market Segment Analysis
By Product Type:
Pod Systems Drive Volume, Bean-to-Cup Captures ValuePod and capsule machines delivered 38.86% of global revenue in 2025, reflecting the twin appeal of speed and consistency. Many households regard capsule brewers as the simplest path to espresso-quality drinks without barista skills. The subscription sales model for consumables locks in brand switching costs while generating predictable replenishment volume. Nespresso leverages this framework by offering boutique recycling hubs and loyalty rewards that anchor premium positioning. Domestic Chinese challengers such as Joyoung price aggressively, broadening entry-level access and propelling regional growth.
Bean-to-cup machines, by contrast, dominate the upper price tiers and represent the fastest-growing line with an 8.34% CAGR to 2031. This segment attracts enthusiasts seeking freshly ground beans, automatic milk texturing, and personalized profiles. Commercial variants command list prices of USD 10,000–20,000 and offer programmable recipes for cafés and offices. As connectivity improves, cloud-based telemetry aids predictive maintenance, reducing downtime and justifying inclusive service contracts. Drip coffee makers retain relevance among budget-minded users, especially in North American markets where filter taste profiles remain popular. Traditional percolators and pour-over gear occupy cultural niches but contribute little incremental revenue. The diverging paths of convenience-driven pods and experience-driven bean-to-cup units highlight a barbell structure that guides product development and marketing investments across the coffee machines market.


By Automation Level:
Semi-Automatic Dominance Faces Full-Auto ChallengeSemi-automatic machines captured 42.62% of 2025 revenue, balancing hands-on extraction control with approachable learning curves. Enthusiast consumers appreciate the craft element yet benefit from built-in pressure stability and temperature accuracy. Manufacturer upgrades now bundle pressure profiles, smart tamping sensors, and PID controllers, extending the lifespan of the semi-automatic class. The category also enjoys robust aftermarket communities offering customizable portafilters and burr upgrades that lengthen ownership cycles.
Fully automatic systems grow the fastest at 7.75% CAGR because their one-touch simplicity resonates with busy households that prioritize repeatable results. Embedded grinders, milk systems, and self-cleaning programs compress preparation time to seconds. The coffee machines market size for fully automatic equipment reached USD 4.88 billion in 2026 and is forecast to top USD 7.07 billion by 2031. IoT integration further elevates the appeal by enabling remote start, consumable reordering, and energy-saving modes. Voice assistants such as Alexa and Google Home now pair with several flagship brewers, bringing coffee routines into broader smart-home ecosystems. Manual lever machines serve a passionate niche of purists but lack the scale to challenge mainstream segments
By Distribution Channel:
Digital Transformation Accelerates Retail EvolutionOnline retail represents the fastest trajectory, advancing at 9.22% CAGR through 2031. The pandemic-era shift to digital discovery persisted as consumers learned to compare specifications, read peer reviews, and access niche brands beyond local shelves. Lavazza reported a 28% year-on-year rise in global e-commerce revenue in 2024. Leading marketplaces amplify promotional peaks, with coffee machine demand spiking during events such as Prime Day. Brands bundle subscription offers and extended warranties to reinforce direct orders, capturing first-party shopper data that informs product roadmaps.
Despite digital gains, supermarkets and hypermarkets maintained 46.85% channel share in 2025 by offering instant product availability and the convenience of same-basket capsule refills. Omnichannel strategies now merge physical displays with QR-code access to online content, bridging information gaps. Specialty coffee retailers preserve a role as experiential hubs for machine demonstrations, latte art tutorials, and accessory cross-selling. Direct-to-consumer brand stores expand through high-footfall malls where immersive brewing bars educate potential buyers and convert trial into sales.
Geography Analysis
North America Household Coffee Machine Market
North America contributed 32.88% of global revenue in 2025 and remains the largest regional market. High household penetration and a mature café culture form a solid baseline, yet innovation continues to unlock incremental spending. Keurig Dr Pepper shipped 10.4 million brewers in 2024, reinforcing replacement cycles and pod subscription growth. Smart-home adoption catalyzes demand for Wi-Fi and voice-controlled units, while sustainability concerns channel attention to energy ratings and recyclable materials. Canadian consumers mirror US preferences, with premium single-serve units outperforming entry-level drip models, and Mexico records steady uptake driven by urban middle-class expansion.
APAC Household Coffee Machine Market
Asia-Pacific is the fastest-growing territory, recording a 7.41% CAGR toward 2031. The coffee machines market size for the region stood at USD 3.58 billion in 2026 and is projected to exceed USD 5.12 billion in 2031. China’s branded café boom spills into home adoption as consumers seek to replicate familiar espresso beverages. Domestic appliance makers integrate local payment apps and social-sharing features, tailoring value propositions to tech-savvy millennials. India follows with strong demand in metropolitan pockets, while Vietnam, Indonesia, and the Philippines expand from low installed bases. Local assembly initiatives limit tariffs and customize voltage specifications, enhancing affordability and cultural fit.
EMEA and South America Household Coffee Machine Market
Europe delivers stable growth despite strict environmental legislation. The Ecodesign Regulation compels appliance makers to redesign heating blocks, standby consumption, and material recyclability. Early adopters accept marginal price premiums for units carrying EU energy labels, reinforcing a virtuous cycle of sustainability investment. Southern Europe’s espresso tradition underpins demand for semi-automatic machines, whereas Northern markets lean toward fully automatic convenience. South America’s potential remains tempered by macroeconomic volatility. Retailers in Brazil introduce installment plans to mitigate currency depreciation, yet replacement cycles lengthen as consumers delay non-essential upgrades. The Middle East and Africa offer niche prospects, anchored by specialty café proliferation in the Gulf and rising urbanization in East Africa, although fragmented distribution and price sensitivity pose challenges.

Regulatory Landscape
Regulation is tightening around safety and energy performance for household coffee machines, which is pushing OEMs to update electronics, heating systems, and user-accessible parts. In the European Union, Commission Regulation (EU) 2023/826 (Standby Regulation) became fully applicable in May 2025, setting stricter limits for standby and off-mode power for products placed on the EU market. In the United States, safety compliance continues to be shaped by standards updates such as UL 1082 (Sixth Edition, updated through July 2024 revisions), alongside active enforcement actions such as the U.S. Consumer Product Safety Commission recall (June 2026) of Kidisle single-serve coffee makers due to burn hazards, underscoring the role of flow-path safety, temperature control, and blockage mitigation in single-serve designs.
Asia is also adding more mandatory and quasi-mandatory requirements that affect imports and local manufacturing. India published the Safety of Household, Commercial and Similar Electrical Appliances (Quality Control) Order, 2026, which mandates BIS certification for coffee machines effective October 1, 2026, raising the bar for testing, labeling, and conformity documentation for suppliers serving the Indian market. China implemented GB/T 46503-2025 from May 2026, covering electrical safety, electromagnetic compatibility, standby power, and performance, increasing the need for region-specific certification planning and bill-of-material alignment for global platforms.
Value Chain Analysis
The value chain starts with component sourcing (heating elements/thermoblocks, pumps, grinders, sensors, control boards, plastics/metal housings) and moves into assembly, certification, and multi-channel distribution (mass retail, specialty stores, online, and direct-to-consumer subscriptions). As machines add connectivity and tighten standby-power controls, electronics sourcing, firmware, and compliance testing have become more central, while spare-parts logistics and warranty execution increasingly shape brand perception and total cost of ownership.
Partnership and service-network choices are also changing downstream economics and time-to-repair. De’Longhi strengthened aftermarket fulfillment by appointing Encompass Supply Chain Solutions as its primary parts distributor in North America (March 2025), consolidating warehousing and procurement to improve service levels. On the ecosystem side, Keurig Dr Pepper and Lavazza expanded their partnership (February 2024), with Keurig taking exclusive manufacturing and sourcing rights for Lavazza K-Cup pods and responsibility for sales and distribution in the United States and Canada, reflecting how consumables, distribution scale, and installed-base economics link together. Sustainability-related reverse logistics is becoming more structured as well, illustrated by Nestle Nespresso working with Stemin S.p.A. and Groupe Bader (September 2025) to recover aluminum from capsules and reintegrate it as new alloys, connecting consumables programs to materials supply loops.
Competitive Landscape
The household coffee machine industry increasingly depends on companies' ability to innovate while maintaining operational efficiency. Incumbent players must focus on continuous product development, incorporating advanced features like customization options and smart connectivity while ensuring user-friendly interfaces. Building strong distribution networks, particularly in emerging markets, remains crucial for market expansion. Companies need to develop comprehensive after-sales service networks and maintain strong relationships with retailers and e-commerce platforms to ensure market penetration and customer satisfaction.
For contenders looking to gain market share, differentiation through unique features, design aesthetics, or price positioning is essential. The relatively low risk of substitution from alternative coffee brewing equipment methods provides opportunities for new entrants to establish themselves in specific market segments. Success factors include developing strong brand identities, establishing efficient supply chains, and creating compelling value propositions that address specific consumer needs. Regulatory compliance, particularly regarding product safety and environmental standards, plays a crucial role in market success, with companies needing to adapt their products and processes to meet evolving requirements across different regions.
Household Coffee Machine Industry Leaders
Keurig Dr Pepper Inc.
De’Longhi Group
Nestlé Nespresso SA
Breville Group Ltd.
Hamilton Beach Brands Inc.
- *Disclaimer: Major Players sorted in no particular order

Household Coffee Machine Market Companies Covered in this Report
- Keurig Dr Pepper Inc.
- De Longhi Group
- Nestle Nespresso SA
- Breville Group Ltd.
- Hamilton Beach Brands Inc.
- Jura Elektroapparate AG
- Koninklijke Philips N.V. (Philips Domestic Appliances)
- Groupe SEB (Krups, Tefal)
- BSH Hausgerate GmbH (Bosch, Siemens)
- Spectrum Brands Holdings (Black+Decker, Russell Hobbs)
- Newell Brands Inc. (Mr. Coffee)
- Conair LLC (Cuisinart)
- Melitta Group
- Lavazza Group (Gaggia, Saeco)
- Smeg S.p.A.
- Panasonic Corporation
- Electrolux AB
- Morphy Richards
- Illycaffe S.p.A.
- Wilfa AS*

Market Opportunities and Future Outlook
Interoperable connected machines and smart-home integration create whitespace for differentiated features beyond basic brewing, particularly as online retail accelerates product discovery and specification-driven shopping. In May 2026, BSH reported Bosch and Siemens fully automatic coffee machines becoming the first home appliances optimized for Amazon Alexa+ integration, pointing to a higher-value upgrade path through voice control, routines, and app-based drink customization. In parallel, appliance connectivity standards (IEC 63510 family and related EN 50631 series, including 2025 releases) help enable cross-brand interoperability and energy-management use cases, giving coffee machines a more direct route into smart-home energy and device ecosystems.
Sustainability and lifecycle programs are another practical opportunity area, especially in Europe where standby-power and circular-economy requirements intersect with pod systems. Nespresso's circularity initiatives, including recovery and reuse of aluminum from used capsules via partners such as Stemin and Groupe Bader (September 2025), show how materials recovery and product-system design can preserve convenience while meeting EU expectations. On the brand and portfolio front, investment into faster product cycles supports more frequent refreshes of form factors, connectivity, and energy performance, as reflected in De’Longhi signaling an expanded launch pipeline in 2026 alongside increased investment in capabilities and brand communication.
Recent Industry Developments in Household Coffee Machine Market
- April 2026: Keurig Dr Pepper announced it acquired 96.22% of JDE Peet's shares and outlined plans for a future global coffee unit to be spun off. The acquisition expands Keurig Dr Pepper's scale and brand reach across coffee systems and formats. It reinforces the strategic tie between at-home brewers, pods, and branded coffee portfolios.
- June 2025: Keurig introduced the Keurig K-Mini Mate brewer, a compact single-serve machine positioned around small footprints and accessible pricing. This product supports broader household penetration in space-constrained kitchens. It also strengthens the installed base that drives recurring pod purchases.
- March 2024: Keurig announced the K-Brew + Chill brewer with QuickChill Technology, with availability planned for fall 2024. The hot-and-cold capability expands in-home beverage occasions. It also raises feature expectations in single-serve platforms, supporting premiumization within the category.


Household Coffee Machine Market Report Scope and Research Methodology
Market Definition and Coverage
For this report, the market covers household coffee machines sold for home use, counted as new equipment shipments through retail and direct channels, and valued in USD at the equipment level. It includes drip brewers, pod and capsule machines, semi-automatic espresso machines, and fully automatic bean-to-cup units.
Scope exclusions: Commercial coffee machines used in cafes, restaurants, offices, and vending settings are excluded from this sizing.
Segments Covered in This Report
- By Product Type
- Drip Coffee Machines
- Espresso Coffee Machines
- Pod/Capsule Coffee Machines
- Bean-to-Cup (Automatic Espresso) Machines
- Percolators & Others
- By Automation Level
- Manual
- Semi-Automatic
- Fully Automatic
- Smart Connected / IoT-Enabled
- By Distribution Channel
- Supermarkets & Hypermarkets
- Specialty Stores
- Online Retail
- Direct-to-Consumer (Brand Stores & Subscriptions)
- Other Offline Channels
- By Geography
- North America
- United States
- Canada
- Mexico
- South America
- Brazil
- Peru
- Chile
- Argentina
- Rest of South America
- Asia-Pacific
- India
- China
- Japan
- Australia
- South Korea
- South-East Asia (Singapore, Malaysia, Thailand, Indonesia, Vietnam, Philippines)
- Rest of Asia-Pacific
- Europe
- United Kingdom
- Germany
- France
- Spain
- Italy
- BENELUX (Belgium, Netherlands, Luxembourg)
- NORDICS (Denmark, Finland, Iceland, Norway, Sweden)
- Rest of Europe
- Middle East & Africa
- United Arab Emirates
- Saudi Arabia
- South Africa
- Nigeria
- Rest of Middle East & Africa
- North America
Data Sources, Market Sizing, and Validation
Desk Research
Desk research was used to set the market boundary and to collect the baseline data series used in the model. We referenced public sources such as UN Comtrade for trade flows, USITC DataWeb for tariff line context, Eurostat for household equipment and retail indicators, and the World Bank for macro variables used to normalize country trends.
To keep assumptions grounded, we also reviewed company annual reports and investor decks, official customs publications where available, and reputable business press coverage on small appliance demand and channel shifts. In addition, we used a paid subscription for company financials and news intelligence, plus a shipment-level import and export database to sanity check trade-linked movements in key markets. This list is illustrative only, and many other public and paid sources were also used for data collection, validation, and research clarifications.
Primary Interviews and Surveys
Primary work focused on interviews and surveys with a mix of home appliance brands, component and contract manufacturing contacts, distributors, and large-format retail channel experts, followed by online-led sellers and service partners where relevant. The discussions helped us tighten average selling price bands by format, clarify how pod and capsule penetration is shifting, and distinguish what is actually sold into households versus what may be purchased for small workplaces in different regions.
Distribution of primary research fieldwork respondents
| Company type | Respondent position | Region |
|---|---|---|
| Top tier: 30% | CXOs: 13% | APAC: 42% |
| Mid tier: 56% | Functional/Unit leaders: 29% | EMEA: 34% |
| Smaller Players: 14% | Managers: 58% | Americas: 24% |
Market-Sizing & Forecasting
Sizing starts with a top-down build that reconstructs household machine demand by country using appliance demand signals, trade and production context, and channel expansion patterns, and then converts that demand pool into value using price ladders that reflect each machine format. Once totals are formed, selective bottom-up checks are used to keep the numbers realistic, using sampled brand and retailer range checks, reported shipment direction from interviews, and ASP times volume spot checks for large markets.
A few inputs that matter a lot for this market include the replacement cycle for home brewers, the share shift between drip versus pod and capsule versus bean-to-cup, the mix of semi-automatic and fully automatic espresso machines, and online versus offline channel contribution to unit flow. Currency timing and price inflation are handled consistently by using the same conversion period for the base year and by separating true ASP movement from mix change where possible. For forecasting, scenario analysis is used because adoption is driven by both income trends and behavior changes, and expert feedback helped us set practical ranges for premiumization, pod penetration, and replacement frequency assumptions by region.
Data Validation & Update Cycle
Validation is done in layers so that one source does not drive the full outcome. Model outputs are compared against independent indicators like import and export direction, category sales commentary from major retailers, and the expected replacement pool implied by installed base estimates, and then the largest variances are reviewed by a second analyst before sign-off.
When a number looks off, the assumptions are re-checked and the related primary contacts are re-approached to confirm whether a shift is real or just timing noise. The report is refreshed annually, and interim updates are made when a material event affects pricing, supply availability, or large-region demand. Before delivery, a final review pass is completed so clients receive the latest updated view.
Mordor Intelligence's Global Household Coffee Machine Market Size Versus Other Published Estimates
Published market sizes for household coffee machines do not always match because researchers may count different machine types, use different value points in the chain, and anchor the model to different years. The spread also becomes wider when price ladders are built using broad appliance averages instead of format-level pricing.
Import and export direction checks, combined with channel mix signals for pod and capsule and fully automatic units, are the evidence points that keep Mordor Intelligence focused on household-only equipment shipments and consistent currency timing. This reduces noise from small-office and light commercial placements that can otherwise slip into category totals.
Benchmark comparison
| Source | Market Size | Gaps in Research Methodology |
|---|---|---|
| Mordor Intelligence | USD 14.48 B (2026) | |
| Global Consultancy A | USD 16.10 B (2026) | Often expands the counted demand pool by including small-office purchases and some light commercial placements, and may apply a blended ASP that overstates value when premium espresso formats are over-weighted. |
| Trade Journal B | USD 12.90 B (2026) | Commonly relies on a narrower tracked set of offline retail channels and undercounts direct-to-consumer and online-led sales, which can reduce unit capture in fast-growing markets and pull down the implied value. |
The comparison shows that the biggest differences come from what gets counted as household demand, plus how prices are assigned across drip, pod and capsule, and espresso formats. By keeping the scope limited to home-use shipments and by testing the totals against trade and channel signals, the resulting number stays traceable to repeatable inputs instead of broad appliance averages.


Key Questions Answered in the Report
What is the projected growth rate for the coffee machines market between 2026 and 2031?
The market is forecast to grow at a 6.05% CAGR, climbing from USD 14.48 billion in 2026 to USD 19.4 billion by 2031.
Which product segment is expanding the fastest?
Bean-to-cup automatic machines lead growth with an 8.34% CAGR through 2031, reflecting rising demand for café-quality drinks at home.
How quickly is online retail gaining ground as a sales channel?
Online retail is advancing at a 9.22% CAGR, outpacing all other channels as consumers favor digital research and direct-to-door delivery.
Which region offers the highest growth potential over the next five years?
Asia-Pacific shows the strongest outlook with a 7.41% CAGR, underpinned by China’s expanding espresso culture and rapid urbanization across India and Southeast Asia.
What regulatory changes are most likely to affect product design?
The EU Ecodesign Regulation, effective July 2024, and US energy-efficiency standards set for 2029 are pushing manufacturers toward more energy-efficient and recyclable machines.
Page last updated on:


 Your data is secure and never sold or shared.


