
Market Overview
| Study Period | 2020 - 2031 |
|---|---|
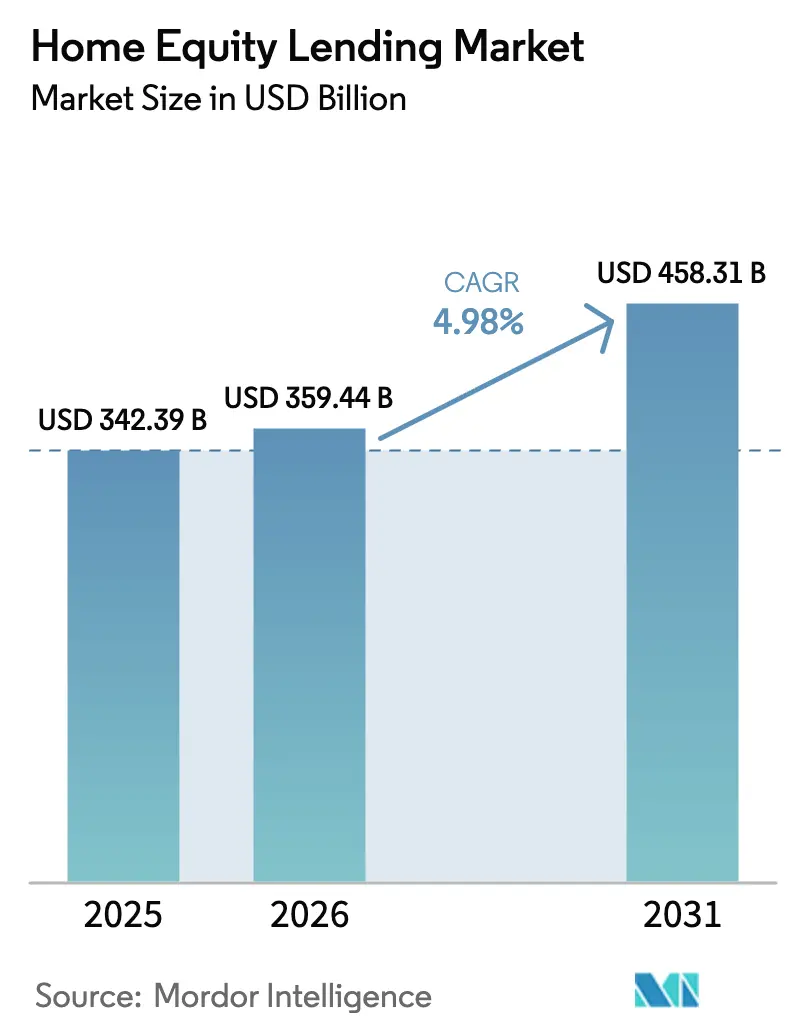
| Market Size (2026) | USD 359.44 Billion |
| Market Size (2031) | USD 458.31 Billion |
| Growth Rate (2026 - 2031) | 4.98 % |
| Fastest Growing Market | Asia Pacific |
| Largest Market | North America |
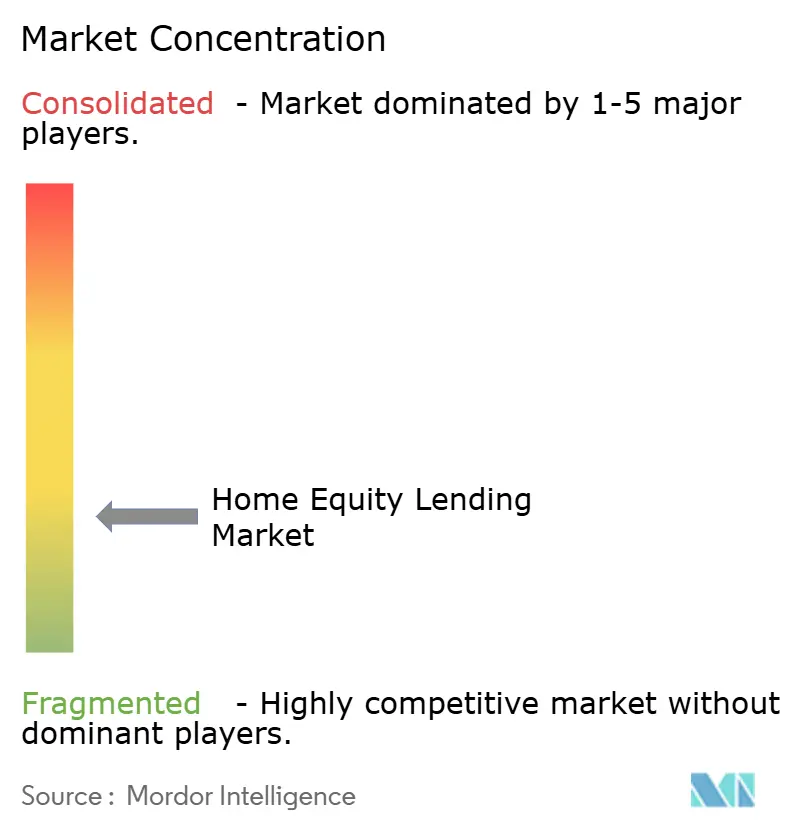
| Market Concentration | Low |
Major Players *Disclaimer: Major Players sorted in no particular order Image © Mordor Intelligence. Reuse requires attribution under CC BY 4.0. | |
Home Equity Lending Market Analysis by Mordor Intelligence
The Global home equity lending market size was valued at USD 342.39 billion in 2025 and estimated to grow from USD 359.44 billion in 2026 to reach USD 458.31 billion by 2031, at a CAGR of 4.98% during the forecast period (2026-2031). Elevated “tappable” equity, locked-in low first-lien mortgage coupons, and tax-advantaged borrowing costs keep demand resilient even as traditional cash-out refinancing wanes. Lenders are capitalizing on record USD 32 trillion of U.S. homeowner equity by rolling out flexible lines of credit, hybrid draw structures, and bundled renovation financing. North America retains the lion’s share of originations, yet Asia-Pacific is posting the quickest uptake as China and India liberalize consumer-credit rules. Across every region, automated valuation models (AVMs) and AI-driven underwriting shave processing costs by hundreds of dollars per loan, allowing price competition even in a rising-rate backdrop.
Key Report Takeaways
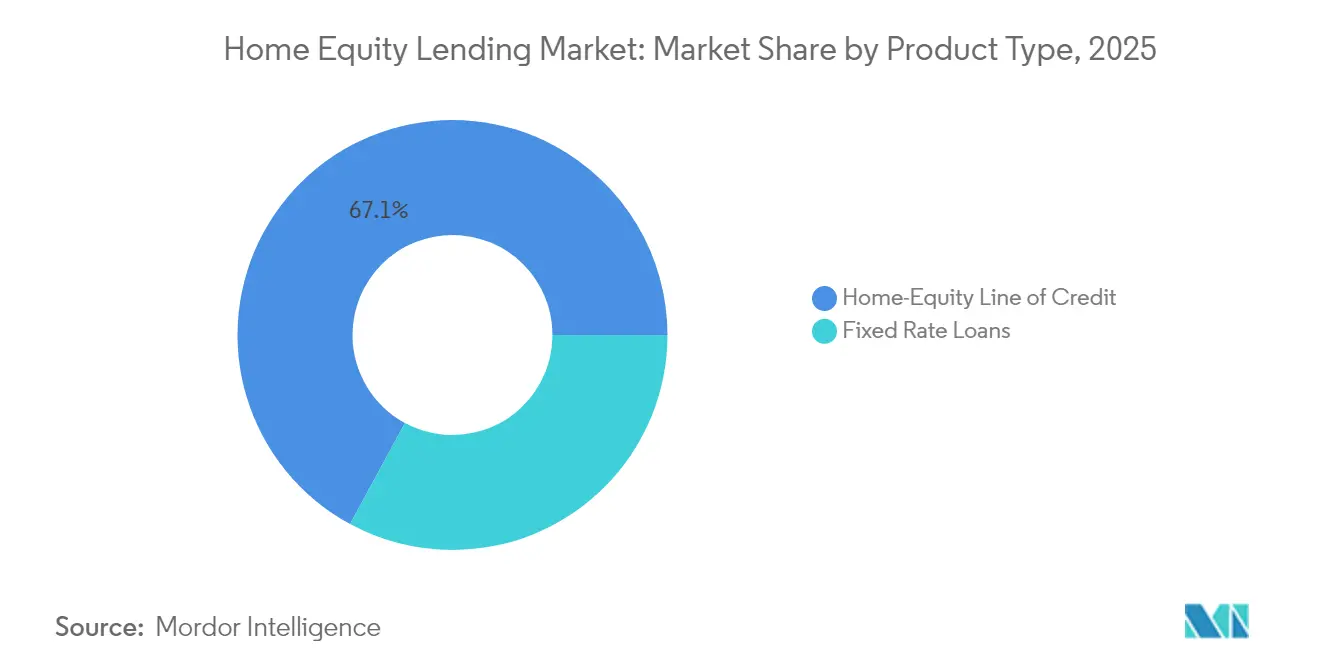
- By product type, home equity lines of credit (HELOCs) captured 67.10% share of the home equity lending market in 2025 and are forecasted to grow at a 6.08% CAGR through 2031.
- By provider, banks held 58.05% of the home equity lending market share in 2025, while fintech-led nonbanks posted the fastest 8.34% CAGR outlook.
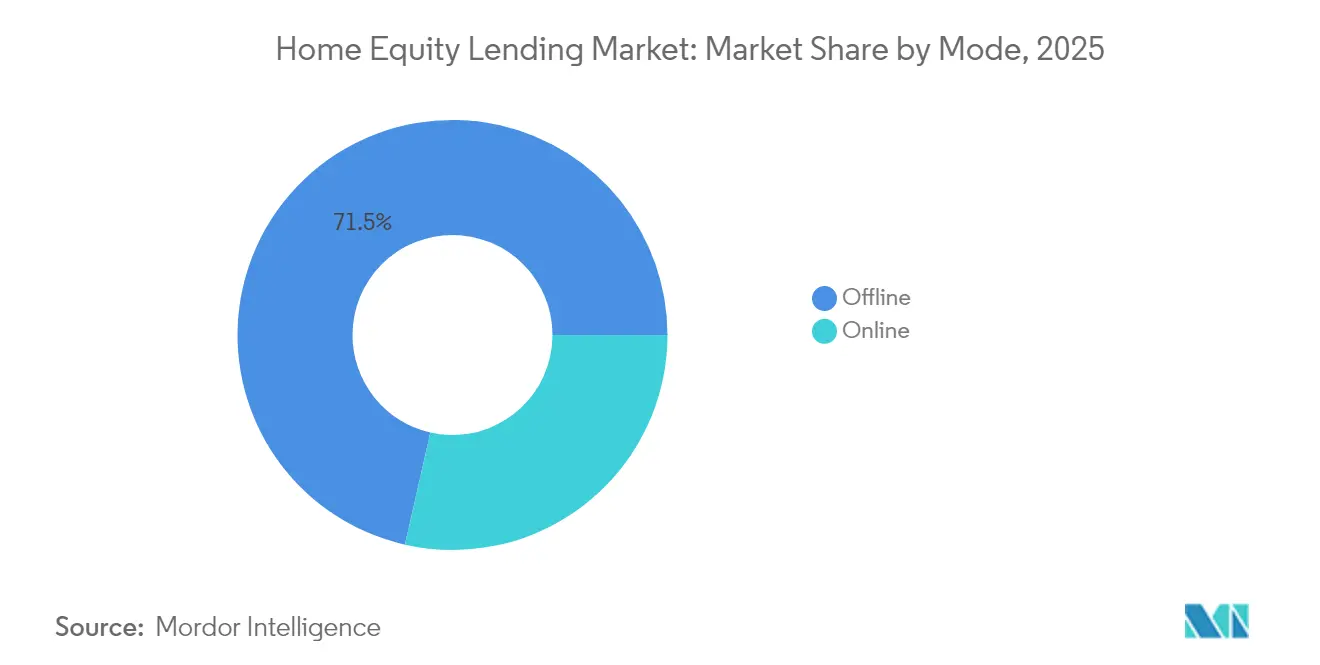
- By mode, offline channels retained a 71.45% share of the home equity lending market in 2025; online originations are growing 8.55% annually as digital document collection becomes mainstream.
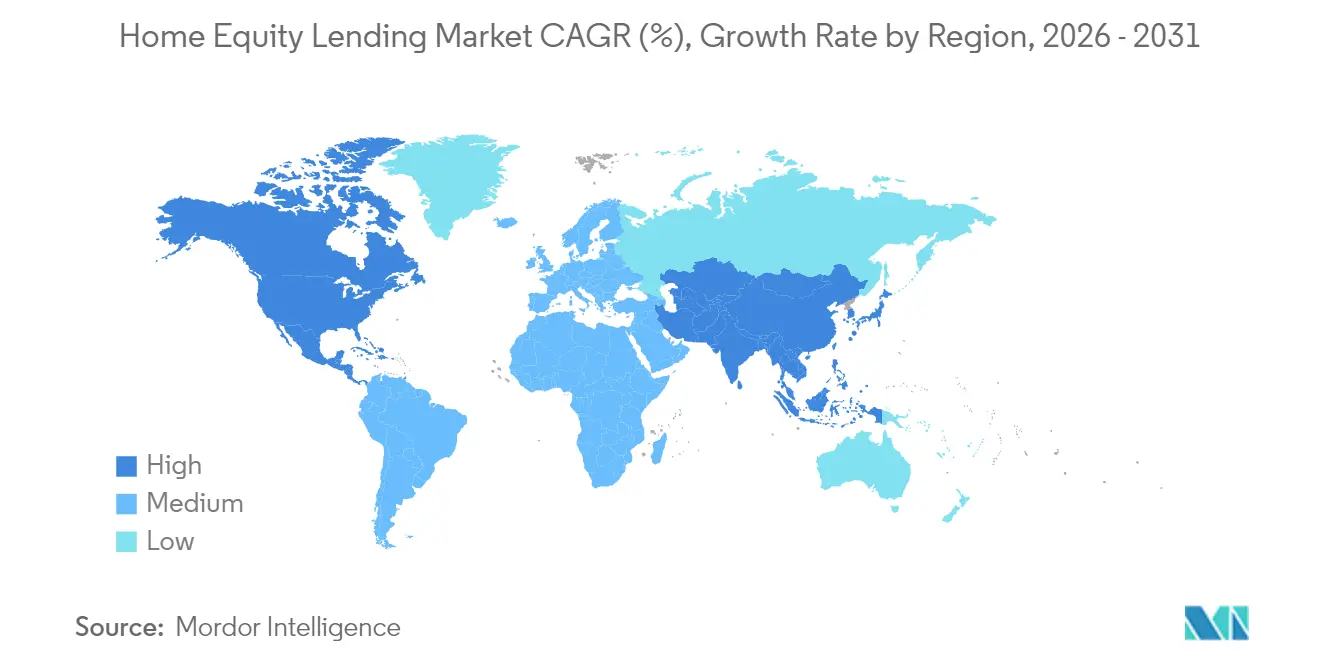
- By geography, North America commanded 63.05% share of the home equity lending market in 2025; Asia-Pacific is projected to widen at a 6.68% CAGR through 2031, outpacing all other regions.
Note: Market size and forecast figures in this report are generated using Mordor Intelligence’s proprietary estimation framework, updated with the latest available data and insights as of 2026.
Market Trends and Insights
Drivers Impact Analysis of Home Equity Lending Market*
| Driver | ( ~ ) % Impact on CAGR Forecast | Geographic Relevance | Impact Timeline |
|---|---|---|---|
| Rising home values expanding tappable equity | +1.2% | Global, concentrated in North America & Europe | Long term (≥ 4 years) |
| Digital lending platforms shortening approval times | +0.8% | Global, led by North America & Asia-Pacific | Medium term (2-4 years) |
| Favorable tax treatment of mortgage interest | +0.6% | North America, select European markets | Long term (≥ 4 years) |
| Embedded home-equity offers in fintech super-apps | +0.4% | Asia-Pacific core, spill-over to North America | Short term (≤ 2 years) |
| Automated valuation models cutting costs | +0.7% | Global, early adoption in North America | Medium term (2-4 years) |
| Aging-housing-stock renovation boom | +0.5% | North America & Europe, emerging in Asia-Pacific | Long term (≥ 4 years) |
| Source: Mordor Intelligence | |||
Rising Home Values Expanding Tappable Equity
Average tappable equity per U.S. homeowner closed 2024 at USD 203,000, a level that meaningfully lifts credit line ceilings without breaching 80% loan-to-value caps. Secondary metro areas, from Boise to Raleigh, now mirror price gains once confined to coastal hubs, broadening the addressable borrower pool. Because delinquency risk on primary residences remains low, lenders treat equity-backed credit as a defensive asset even in cyclical downturns. Credit unions leverage proximity to members to keep balances seasonally sticky, while specialty servicers bundle seasoned loans into high-grade securitizations for yield-hungry investors. Regional valuation peaks, however, foreshadow tighter underwriting in overheated sub-markets.
Digital Lending Platforms Shortening Approval Times
Best-in-class fintechs now fund a HELOC in under five days versus the conventional 45-60 day cycle, largely through straight-through processing and remote e-notary notarization. Figure Technologies alone surpassed USD 12.5 billion in funding by deploying blockchain-based lien management that slices fulfillment expenses. AVMs appear in 75% of transactions, eliminating appraiser bottlenecks and letting lenders quote same-day offers [1]“AVM Adoption Accelerates,” First American, firstam.com. Traditional banks are counterpunching with omnichannel rollouts that migrate branch workflows to cloud-native cores. Regulators are pressing for algorithmic fairness audits, adding cost but also erecting compliance barriers that favor scaled platforms.
Favorable Tax Treatment of Mortgage Interest
In the United States, interest linked to home-improvement HELOC draws remains deductible, lowering real borrowing costs by as much as 300 basis points for taxpayers in the top bracket. Similar allowances in Canada, the U.K., and the Netherlands cement home equity credit as a cheaper alternative to unsecured personal loans. Marketing campaigns highlight after-tax savings to affluent urban homeowners, a segment that also tends to pre-pay quickly, improving credit performance. Policy risk lingers, changes to deductibility could temper high-ticket renovation spending, so lenders are scenario-planning for margin compression.
Embedded Home-Equity Offers Inside Fintech Super-Apps
Embedded Home-Equity Offers inside fintech super-apps are becoming a powerful driver for the home equity lending market by integrating borrowing seamlessly into users’ everyday financial activities. Asian super-apps now surface real-time equity dashboards alongside payments, brokerage, and insurance, turning dormant home value into a one-tap liquidity option. Valley Strong Credit Union’s tie-up with Figure embeds a draw button directly in its app interface, nudging member engagement. Acquisition costs shrink when offers originate from an existing ecosystem, and younger borrowers show greater comfort pledging collateral digitally. These platforms reduce friction, personalize offers based on transaction behavior, and enable instant pre-approvals using embedded KYC and credit data. However, jurisdictional consumer-protection rules complicate roll-outs beyond core markets, requiring tailored compliance layers and partnerships with local entities.
Restraints Impact Analysis of Home Equity Lending Market*
| Restraint | ( ~ ) % Impact on CAGR Forecast | Geographic Relevance | Impact Timeline |
|---|---|---|---|
| Rising short-term interest rates elevating HELOC APRs | -0.9% | Global, most pronounced in North America | Short term (≤ 2 years) |
| Stagnant wage growth limiting debt-service capacity | -0.6% | Emerging markets, spill-over to developed economies | Medium term (2-4 years) |
| Data-privacy rules constraining alternative-data underwriting | -0.3% | Europe & North America, expanding globally | Long term (≥ 4 years) |
| Stricter post-crisis LTV caps limiting equity extraction | -0.4% | Global, varying by regulatory jurisdiction | Long term (≥ 4 years) |
| Source: Mordor Intelligence | |||
Rising Short-Term Interest Rates Elevating HELOC APRs
Prime-linked HELOCs climbed above 7.5% in early 2025, curbing draw volumes as rate-sensitive borrowers await monetary easing[2]Brook Lea, “HELOC Rates Continue to Rise,” National Mortgage News, nationalmortgagenews.com. The rising cost of borrowing has made many consumers hesitant to tap into their home equity, especially for discretionary spending or non-essential renovations. Fixed-rate equity loans cushion some fallout, and lenders are piloting 5/1 hybrid structures that swap to adjustable after an introductory period. Credit unions face earnings volatility because many keep HELOCs on the balance sheet at variable coupons. This rate environment also dampens lender appetite for aggressive marketing, as elevated APRs reduce competitiveness against unsecured alternatives and fintech-driven BNPL products.
Stagnant Wage Growth Limiting Debt-Service Capacity in EMs
Stagnant wage growth is constraining debt-service capacity in emerging markets, acting as a significant restraint on home equity lending. Emerging-market households encounter debt-to-income ceilings even as property prices sprint ahead, suppressing origination potential in Brazil, Mexico, and parts of Southeast Asia. Gig-economy income volatility forces lenders to adopt cash-flow analytics over payslip reviews, but prudential regulators often lag these innovations, prolonging approval cycles. As a result, even creditworthy borrowers struggle to qualify for equity-backed credit under traditional underwriting models. Inflation-adjusted incomes have failed to keep pace with rising debt burdens, tightening affordability metrics. Additionally, lenders remain cautious amid uncertain macroeconomic conditions, further limiting product innovation and rollout in lower-income segments.
*Our forecasts treat driver/restraint impacts as directional, not additive. The impact forecasts reflect baseline growth, mix effects, and variable interactions.
Home Equity Lending Market Segment Analysis
By Product Type:
HELOCs Dominate Through FlexibilityHELOCs held 67.10% of the home equity lending market share in 2025, a lead expected to widen as the segment advances at a 6.08% CAGR through 2031. Fixed-rate loans occupy a defensive niche among borrowers seeking payment certainty for renovation or debt-consolidation projects. The home equity lending market size attributed to HELOCs is forecast to reach USD 311.6 billion by 2031, equal to 68.00% of total originations. Credit unions reported November 2024 balances up 1.4% for closed-end equity loans and 2.6% for adjustable-rate mortgages, underscoring ongoing appetite.
Lenders are experimenting with combo products that lock an initial tranche at fixed terms while leaving a revolving line open for future draws. Marketing spotlights interest-only payment options that smooth household cash flow during renovation phases. Regulatory letters from the NCUA in late 2024 recommend tougher payment-shock stress tests, prompting portfolio managers to raise FICO and CLTV overlays on high-debt borrowers. Competitive momentum nevertheless favors HELOCs because their flexible advance feature matches today’s episodic funding needs—tuition, solar installations, and medical expenses—more cleanly than lump-sum alternatives.


By Provider:
Banks Lead While Fintechs AccelerateBanks commanded 58.05% of market share in 2025, but independent mortgage firms expanded their footprint in the small-balance lending segment, rising to 53% of loans under USD 100,000 from 50% two years earlier, while large banks slipped to just 15%. This shift signals growing borrower preference for faster, more flexible underwriting typically offered by nonbank lenders. Fintechs are exploiting cloud-native cores to post an 8.34% CAGR through 2031, edging their combined share toward one-quarter of the market. They leverage real-time income verification, mobile-first interfaces, and embedded analytics to streamline approvals. The home equity lending industry benefits when regulated banks co-opt fintech rails via white-label partnerships, enabling deposit-funded cost of capital with front-end speed parity. These alliances allow traditional players to stay competitive without rebuilding core systems, while fintechs gain regulatory cover and liquidity access through bank charters.
Portfolio economics differ sharply: depositories often retain servicing to deepen customer primacy, creating long-term cross-sell opportunities across mortgage, deposit, and investment products. This relationship-centric model helps banks maintain stickier funding bases and customer loyalty. In contrast, nonbanks typically monetize via forward bulk sales or securitization, prioritizing liquidity and asset turnover. FDIC research highlights systemic monitoring gaps in the nonbank segment, flagging liquidity-backed warehouse lines as a potential contagion vector during credit tightening. These exposures may amplify funding stress if interest rates spike or investor appetite wanes. Meanwhile, community banks cluster around branch-based cross-sell, bundling HELOCs with high-yield checking and wealth management to hold locally originated paper. Their strength lies in personalized service and geographic knowledge, though digital adoption remains uneven across this segment.
By Mode:
Digital Transformation AcceleratesOffline engagements accounted for 71.45% of market share in 2025, reflecting document complexity, borrower caution, and legacy regulatory workflows. Many transactions still require notarization, in-person appraisals, or paper-based disclosures that slow full digital migration. However, click-to-close platforms are expanding volume at a 8.55% annual clip, driven by advances in e-signature compliance, remote ID verification, and lender appetite for operational efficiency. Borrowers aged 35 and under initiate 62% of applications digitally, reflecting their digital comfort and preference for speed, while the 55+ cohort remains the majority in-branch due to trust, familiarity, or limited digital access. This demographic split is prompting lenders to adopt segmented strategies, with tailored user experiences across age groups and property types.
Platform providers are baking analytics into the workflow—Arc Home’s HomeEQ portal lets brokers keep the servicing relationship while automating verifications and lien management, enabling faster turnaround without compromising loan quality. These platforms also allow lenders to flag documentation inconsistencies in real-time, reducing rework and improving compliance readiness. Compliance frictions persist around “know-your-customer” rules that mandate in-person ID confirmation above certain draw thresholds, especially in jurisdictions with tighter anti-fraud regulations. This adds operational friction, particularly for high-value HELOCs or multi-party ownership structures. Winning lenders therefore adopt omni-channel orchestration: a borrower may start online, upload income documents via smartphone, but finalize closing at a title office to satisfy notarization law. This blended model balances digital speed with regulatory assurance, enabling scale without sacrificing risk controls or borrower trust.
Geography Analysis
North America Home Equity Lending Market
North America’s 63.05% grip in 2025 stems from codified lien laws, tax deductibility, and homeowners sitting on USD 32 trillion of aggregate equity. Canada’s reverse-mortgage niche is growing double-digits as aging owners monetize value without selling, with balances eclipsing CAD 7 billion (USD 5.5 billion) by 2025. Consolidation is reshaping scale economics: Rocket Companies now services 1 in 6 U.S. mortgages after absorbing Mr. Cooper in a USD 9.4 billion all-stock deal.
APAC Home Equity Lending Market
Asia-Pacific is the fastest-growing bloc at 6.68% CAGR, supported by regulatory easing in China, which lifted single-loan caps and extended tenors to seven years, and India, whose housing finance pool is projected to balloon significantly within five years. Japan’s major city banks are rolling out yen-denominated HELOCs pegged to the Tokyo Interbank Offered Rate, tapping households with sizeable unrealized gains from decades of urban appreciation. Yet slower wage growth tempers leverage expansion, prompting lenders to pilot income-share structures that synchronize repayment with earnings.
EMEA and South America Home Equity Lending Market
Europe, South America, and the Middle East & Africa represent a relatively limited market share but deliver important portfolio diversification. Euro-area mortgage growth sagged to a decade low in 2024 as the ECB tightened, though consultancies expect a 2025 rebound once rates stabilize. Brazil’s mortgage-to-GDP ratio climbed from 1.5% in 2003 to nearly 10% in 2018 but is leveling as real incomes flatten and underwriting standards strengthen. Gulf Cooperation Council markets are nibbling at equity-release pilots pegged to Sharia-compliant structures, with Dubai Islamic Bank rolling out a murabaha-based renovation facility.

Regulatory Landscape
Home equity lending operates within consumer-credit disclosure and fair-lending rules. In the United States, the Truth in Lending Act framework is implemented through Regulation Z (12 CFR Part 1026) for open-end home equity plans, including periodic and change-in-terms disclosures. Oversight and enforcement are shared across the Consumer Financial Protection Bureau (CFPB) for consumer protection and federal banking agencies (Federal Reserve, FDIC, and OCC) for safety-and-soundness expectations, including interagency credit-risk management guidance for home-equity portfolios and governance such as board-reviewed lending policies.
Regulatory scrutiny is also tightening around data quality and product design. HELOC reporting obligations under HMDA increase operational burden for higher-volume institutions that meet open-end line reporting thresholds, which raises the need for stronger loan-origination data controls and audit trails. At the same time, the CFPB has increased monitoring of Home Equity Contracts (including shared-equity or similar structures) and reiterated that home-loan protections can apply depending on product design, prompting lenders and fintechs to refresh disclosures, complaint management, and third-party oversight as innovation expands beyond traditional second-lien HELOCs.
Value Chain Analysis
The value chain starts with borrower acquisition, using bank branches, brokers, digital marketplaces, and embedded offers in lender or partner apps. Underwriting and collateral assessment follow, relying on credit bureaus, income and employment verification, and property valuation that increasingly uses AVMs to reduce appraisal friction. Title, lien recording, and closing are managed through title and settlement providers, with notaries (including remote online notarization where permitted) plus document generation and e-sign platforms. After origination, servicing and draw management become central to HELOC utilization, payment processing, and credit-line maintenance.
Funding and risk transfer sit at the back end. Depositories often retain loans on balance sheet, while nonbanks lean on warehouse lines, whole-loan sales, and securitization, making capital markets access a key throughput constraint when spreads widen. Recent activity reflects a growing role for secondary-market use of home-equity collateral and more hybrid operating models, including banks white-labeling fintech rails and fintech-originated assets being packaged for investors. Bottlenecks tend to cluster around lien perfection, title turn times, and the integration needed across valuation, closing, and servicing systems to compress cycle times.
Competitive Landscape
The market skews moderately concentrated. The top U.S. servicers control a considerable share of the market, but more than 250 originators jostle for regional and product niches. Rocket’s Mr. Cooper acquisition added USD 663 billion of servicing rights, vaulting its portfolio to USD 2.1 trillion. Wells Fargo keeps shares through cross-selling into its 68 million retail customers, revealing a 47% jump in Q4 2024 net income amid a pivot toward relationship-driven originations. Figure Technologies became the nation’s largest nonbank HELOC source, tallying USD 12.5 billion funded at sub-50-basis-point fulfillment cost.
Strategic archetypes bifurcate between scale aggregators and tech disruptors. Consolidators target servicing float, funding acquisitions via stock, while driving IT synergies that strip duplicate platforms. Disruptors lean on instantaneous credit decision-making, blockchain lien recordation, and referral embeddedness in real-estate portals. The January 2025 CFPB guidance on equity contracts forces all players to refresh disclosures, arguably advantaging compliance-mature incumbents over thinly staffed startups.
White-space remains in underserved small-balance lending where unit economics favor nimble independents. Community institutions deploy high-touch advisory models that generate cross-product stickiness. Fintechs, by contrast, are beta-testing synthetic HELOC securitizations to recycle capital faster, a move that could both escalate secondary-market depth and draw regulatory gaze.
Home Equity Lending Industry Leaders
Bank of America Corporation
U.S Bank
PNC Financial Services
Truist Financial Corp.
Figure Technologies Inc.
- *Disclaimer: Major Players sorted in no particular order
Home Equity Lending Market Companies Covered in this Report
- Bank of America Corp.
- U.S. Bank
- PNC Financial Services Group
- Truist Financial Corp.
- TD Bank Group
- JPMorgan Chase & Co.
- KeyBank
- Figure Technologies Inc.
- Spring EQ LLC
- LoanDepot LLC
- Pentagon Federal Credit Union
- Navy Federal Credit Union
- Fifth Third Bank
- BMO Harris Bank
- Regions Financial Corp.
- Citizens Bank
- Flagstar Bank
- TBK Bank, SSB
- Discover Bank
- Rocket Mortgage

Market Opportunities and Future Outlook
One clear opportunity is second-lien innovation that aligns homeowner rate lock-in with faster, more flexible HELOC fulfillment. Lenders can take share by pairing HELOC draw features with improved digital execution. Platform-led competition is already visible through fintech and nonbank workflow compression, where cycle times move from multi-week timelines toward days, and through large-scale funding activity for tech-enabled home-equity collateral, which supports product availability beyond deposit-funded balance sheets.
A second opportunity is scaling compliant shared-equity and other alternative home-equity products in jurisdictions where rules are being codified at the state level. In 2026, multiple US states advanced or enacted shared-appreciation or home equity investment-style frameworks with counseling, licensing, and disclosure requirements, including Illinois effective June 1, 2026 and Maine effective April 13, 2026. These updates create clearer operating lanes for providers that can standardize consumer protections, servicing practices, and reporting across states, which supports scalable compliance and configurable disclosures for lenders and platforms expanding beyond core geographies.
Recent Industry Developments in Home Equity Lending Market
- July 2026: Bank of America reported home-equity originations of USD 2.899 billion in Q2 2026, totaling USD 5.361 billion for the first half of the year. The volume disclosure signals continued recommitment to second-lien lending as an alternative to cash-out refinancing while also underlining the need to manage margin and credit performance in a higher-rate environment.
- June 2025: Figure Technology Solutions completed a USD 355 million securitization (FIGRE 2025-HE3) and reported that S&P Global Ratings rated all six bond classes. The transaction highlights how capital markets execution supports scaling home-equity assets and adds reference points for investors assessing tech-enabled collateral and servicing processes.
- October 2024: Figure launched a nationwide piggyback HELOC platform aimed at purchase borrowers and homeowners seeking to avoid higher first-lien rates. The rollout increased competitive intensity in embedded and point-of-sale second-lien offerings by pairing origination speed with a standardized product distributable through partners.


Home Equity Lending Market Report Scope and Research Methodology
Market Definition and Coverage
For this study, the market covers lending products secured against residential home equity, measured as the value of home equity lending issued and outstanding through formal lenders across major regions.
Scope exclusions: It does not include unsecured personal loans, first-lien mortgage purchase loans, or informal lending that is not reported through regulated channels.
Segments Covered in This Report
- By Product Type
- Fixed Rate Loans
- Home Equity Line of Credit
- By Provider
- Banks
- Credit Unions
- Non-Banking Financial Institutions
- Others (Fintech, Brokers, etc.)
- By Mode
- Online
- Offline
- By Region
- North America
- United States
- Canada
- Mexico
- South America
- Brazil
- Argentina
- Chile
- Colombia
- Rest of South America
- Europe
- United Kingdom
- Germany
- France
- Spain
- Italy
- Benelux (Belgium, Netherlands, and Luxembourg)
- Nordics (Sweden, Norway, Denmark, Finland, and Iceland)
- Rest of Europe
- Asia-Pacific
- China
- India
- Japan
- South Korea
- Australia
- South-East Asia (Singapore, Indonesia, Malaysia, Thailand, Vietnam, and Philippines)
- Rest of Asia-Pacific
- Middle East and Africa
- United Arab Emirates
- Saudi Arabia
- South Africa
- Nigeria
- Rest of Middle East and Africa
- North America
Data Sources, Market Sizing, and Validation
Desk Research
Desk research was used to set the frame for demand, supply, and regulation, before we built the market model. We leaned on public, non-paywalled sources such as central bank and prudential regulator releases on household credit, national statistics offices for housing stock and prices, and IMF and World Bank macro series for rates, inflation, and income.
To connect lending to real mortgage activity, we also reviewed housing and mortgage indicators from sources such as the BIS, OECD, and major mortgage and banking associations, along with lender annual reports and investor presentations that explain portfolio mix and risk limits. In a few cases, paid subscriptions were used for company financials and a patent database to confirm underwriting and valuation trends, plus news and financials databases to verify timing of policy shifts. These examples are not exhaustive, and many other public and industry sources were checked for data collection, validation, and clarification.
Primary Interviews and Surveys
Primary work was used to pressure-test how home equity products are priced and originated in different markets, and to confirm what should be counted as home equity lending in practice. We spoke with lenders, brokers, and risk and product leaders, and then added views from credit unions, non-bank lenders, and housing finance specialists across APAC, EMEA, and the Americas to close gaps left by public reporting.
Distribution of primary research fieldwork respondents
| Company type | Respondent position | Region |
|---|---|---|
| Top tier: 34% | CXOs: 14% | APAC: 39% |
| Mid tier: 50% | Functional/Unit leaders: 30% | EMEA: 35% |
| Smaller Players: 16% | Managers: 56% | Americas: 26% |
Market-Sizing & Forecasting
Sizing started with a top-down build that reconstructs the addressable home equity lending pool by combining household credit series, mortgage rate cycles, and housing equity signals, then filtering to second-lien style products secured against home value. The totals were checked using selective bottom-up approximations such as lender portfolio splits from filings, sampled pricing (APR and fees) translated into typical loan values, and channel checks on origination mix by product.
A few inputs that materially moved the model (illustrative, not exhaustive) included policy rate and mortgage rate spreads, home price movement and equity accumulation, borrower refinance incentives versus second-lien take-up, average credit line sizes for HELOC-style products, and lender credit appetite expressed through loan-to-value limits. Where country reporting was incomplete, proxy ratios were applied using comparable markets with similar housing finance structures, then adjusted after primary feedback.
For forecasting, scenario analysis was used because rate cuts, housing turnover, and lender risk posture can shift quickly and not always in a smooth time series. Each scenario was anchored to macro paths, then translated into product demand and pricing changes, with assumptions cross-checked through interviews so the final range stayed realistic.
Data Validation & Update Cycle
Outputs were validated through triangulation across independent signals, including household credit growth, housing market activity, and lender-reported portfolio trends, then checked for unusual jumps at the country and regional level. If a variance could not be explained by a known rate shock, rule change, or reporting break, we revisited the inputs and re-contacted selected respondents to confirm what changed.
Before sign-off, the model and assumptions go through multiple analyst reviews so definition, currency handling, and year mapping are consistent across regions. Reports refresh annually, and interim updates are made when material policy events, sharp interest rate moves, or housing market turns are observed. Right before delivery, a final review pass is completed so clients receive the latest updated view.
Mordor Intelligence's Global Home Equity Lending Market Size Measured Against Other Published Estimates
Published market values for home equity lending can differ more than people expect, even when the topic label looks the same. The spread usually comes from how each source defines the product set, whether it counts originations or outstanding value, and how it handles currency timing and interest rate swings.
Some estimates fold in adjacent products like cash-out refinancing, or they mix annual originations with stock measures such as balances or committed credit limits. For Mordor Intelligence, the count is limited to fixed-rate home equity loans and HELOCs, and the model is kept consistent in USD value terms with annual refresh checks on rates, housing equity signals, and lender behavior to avoid scope drift.
Benchmark comparison
| Source | Market Size | Gaps in Research Methodology |
|---|---|---|
| Mordor Intelligence | USD 342.39 B (2025) | |
| Trade Journal A | USD 387.00 B (2025) | The published figure appears to use a wider product scope that can include cash-out refinance and equity release items, and the metric definition (originations versus outstanding) is not clearly stated in the public summary. |
| Industry Association B | USD 167.40 B (2024) | This number reflects maximum credit extended at year-end for a specific survey base, so it behaves like committed limits rather than total market value across countries, and it is not designed as a global market total. |
Across the three figures, the main lesson is that product inclusion and the chosen metric can change the total as much as growth assumptions do. By keeping the scope tied to HELOCs and closed-end home equity loans and by separating stock measures from annual flow measures, the sizing steps stay easy to trace back to clear variables and repeatable checks.


Key Questions Answered in the Report
What is the current home equity lending market size?
The home equity lending market size stood at USD 359.44 billion in 2026 and is projected to rise to USD 458.31 billion by 2031.
How fast is the home equity lending market growing?
The market is expanding at a 4.98% CAGR between 2026 and 2031, propelled by record homeowner equity and digital underwriting efficiencies.
Which product segment dominates the home equity lending market?
HELOCs dominate with 67.10% share in 2025 and an expected 6.08% CAGR through 2031.
Which region shows the fastest growth in home equity lending?
Asia-Pacific leads with a 6.68% CAGR outlook, underpinned by regulatory liberalization and a growing middle class.
Page last updated on:


 Your data is secure and never sold or shared.


