
Hedge Fund Market Size and Share
Market Overview
| Study Period | 2020 - 2031 |
|---|---|
| Market Size (2026) | USD 5.71 Trillion |
| Market Size (2031) | USD 8.83 Trillion |
| Growth Rate (2026 - 2031) | 9.12 % |
| Fastest Growing Market | Asia Pacific |
| Largest Market | North America |
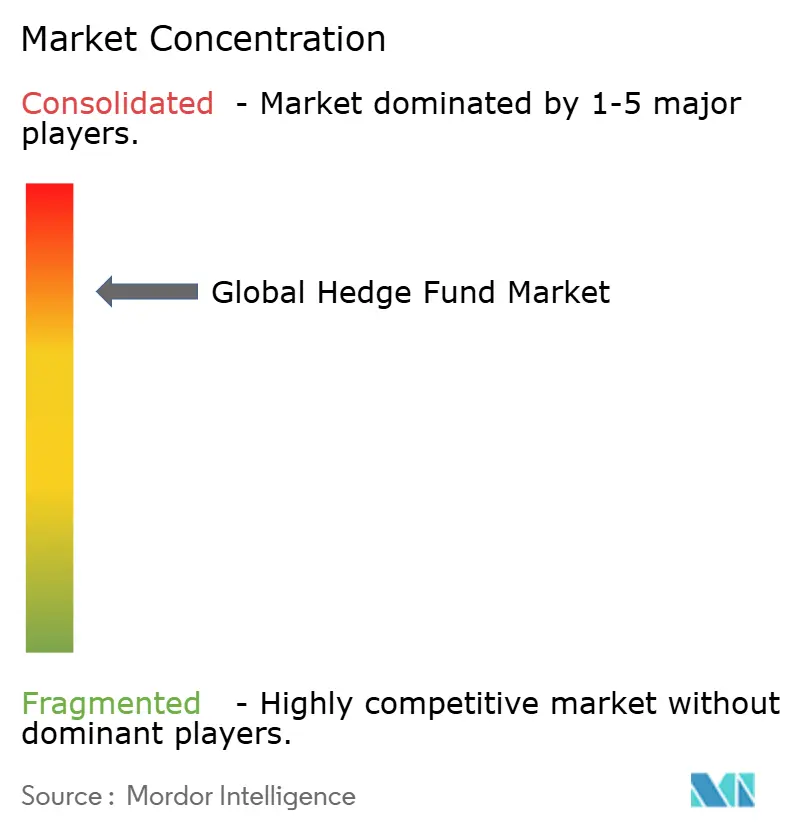
| Market Concentration | High |
Major Players *Disclaimer: Major Players sorted in no particular order Image © Mordor Intelligence. Reuse requires attribution under CC BY 4.0. | |
Hedge Fund Market Analysis by Mordor Intelligence
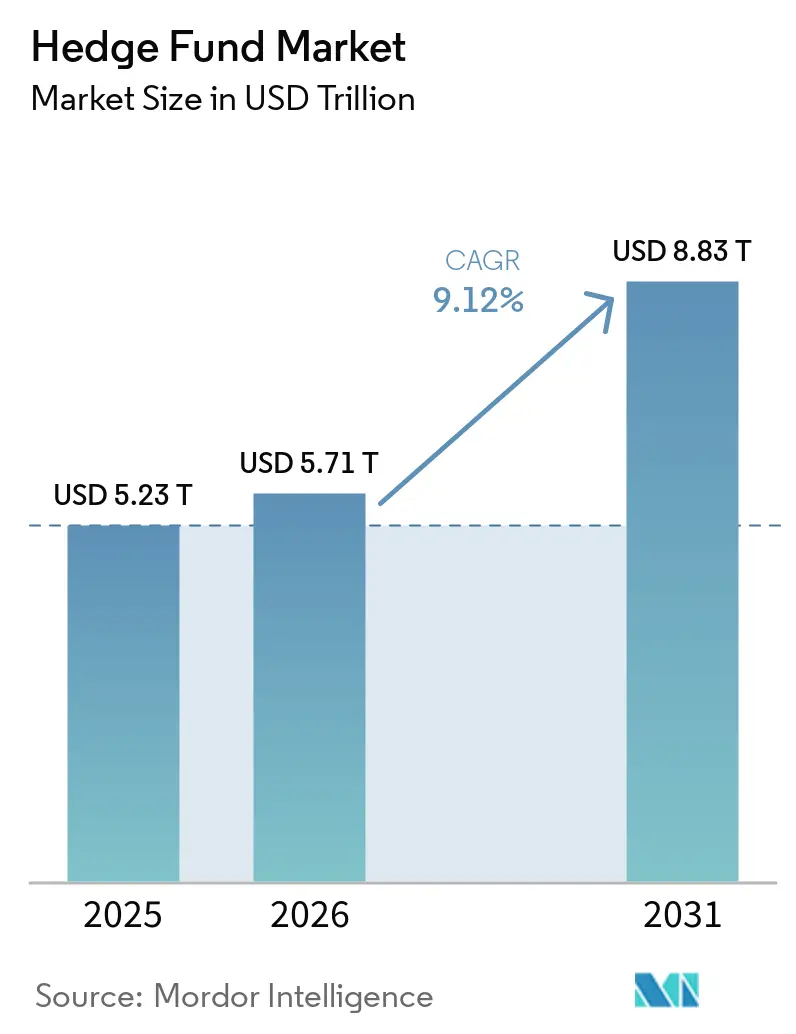
The hedge fund market size stands at USD 5.71 trillion in assets under management in 2026 and is projected to reach USD 8.83 trillion by 2031 at a 9.12% CAGR. Multi-strategy platforms hold the largest position with a 27.26% share in 2025, while quantitative and systematic strategies are set to grow the fastest at an 11.63% CAGR through 2031, which signals a split between scale-driven platforms and data-led alpha engines that reshape competitive positioning in the hedge fund market. The growth in this market is driven by institutional shifts away from stressed 60/40 portfolios, a high-interest-rate environment enhancing cash-collateral yields, and the increasing adoption of artificial intelligence in research and trading operations. Multi-strategy platforms are gaining market share due to their focus on streamlining talent acquisition, implementing robust risk controls, and enhancing data infrastructure. Meanwhile, demands for fee transparency and tighter prime-broker margins are creating challenges for smaller managers. Additionally, tokenization and digital distribution channels are expanding access to alternative investments, with blockchain-based fund wrappers expected to significantly contribute to new asset inflows by the end of the decade.
Key Report Takeaways
- By strategy, multi-strategy led with 27.26% of the hedge fund market share in 2025, while quantitative and systematic strategies are projected to expand at an 11.63% CAGR through 2031.
- By investor type, institutional investors controlled 65.92% of the hedge fund market share in 2025, while retail channels are projected to grow at a 13.07% CAGR through 2031.
- By fund structure, offshore vehicles held 53.26% of the hedge fund market share in 2025, while hybrid structures are projected to grow at an 11.26% CAGR through 2031.
- By distribution channel, direct institutional mandates represented 42.12% of the hedge fund market share in 2025, while digital marketplaces and tokenized funds are projected to grow at a 16.89% CAGR through 2031.
- By geography, North America accounted for 73.06% of the hedge fund market share in 2025, while Asia-Pacific is projected to grow at a 12.56% CAGR through 2031.
Note: Market size and forecast figures in this report are generated using Mordor Intelligence’s proprietary estimation framework, updated with the latest available data and insights as of January 2026.
Market Trends and Insights
Drivers Impact Analysis of Hedge Fund Market*
| Driver | (~) % Impact on CAGR Forecast | Geographic Relevance | Impact Timeline |
|---|---|---|---|
| Institutional Reallocation Amid 60/40 Portfolio Strain | +2.3% | Global, concentrated in North America and Europe | Medium term (2-4 years) |
| Rise of Alternative Data and Quant Strategies | +1.8% | Global, strongest in North America, Asia-Pacific tech hubs | Long term (≥ 4 years) |
| Interest Rate Carry on Cash Collateral | +1.2% | Global, particularly strategies with short exposure | Short term (≤ 2 years) |
| Regulatory Developments in China’s QDLP/QFLP Schemes | +0.7% | APAC core, spillover to global allocators seeking China exposure | Medium term (2-4 years) |
| Tokenization and Digital Asset Hedge Fund Growth | +1.5% | North America and the Middle East have early adoption, while Europe is regulation-driven. | Long term (≥ 4 years) |
| Expansion of Multi-Strategy Platforms | +1.6% | Global, dominated by North American mega‑platforms | Medium term (2-4 years) |
| Source: Mordor Intelligence | |||
Institutional Reallocation Amid 60/40 Portfolio Strain
Institutional allocations are moving from traditional 60/40 models toward mixes that grant hedge funds a core role because stock-bond correlations have not provided consistent diversification in recent years, and allocators seek more reliable downside protection within the hedge fund market. Survey work and allocator commentary published during 2025 indicate rising acceptance of allocation frameworks that embed absolute return and relative value sleeves as structural components rather than tactical overlays, which changes the baseline for the hedge fund market. The change is reinforced by policy rate normalization, which raises the opportunity cost of beta exposure and improves the relative case for multi-asset and hedge fund solutions that manage volatility. A Morgan Stanley survey fielded in September and October 2025 found 71% of institutional investors believe 60:20:20 frameworks will outperform legacy allocations [1]Natixis Investment Managers, “Morgan Stanley Survey on 60:20:20 Portfolio Allocation,” Natixis Investment Managers, www.im.natixis.com . J.P. Morgan Private Bank analysis demonstrates that portfolios allocating 10% to hedge funds outperformed 60/40 in roughly 70% of years over the past decade and in every year since 2021 [2] J.P. Morgan Private Bank Editorial Team, “Portfolio Construction and Alternatives Allocation,” J.P. Morgan Private Bank, privatebank.jpmorgan.com .
Rise of Alternative Data and Quant Strategies
Quant managers are scaling budgets for data sets and model engineering because differentiated data pipelines and tooling create durable moats that smaller firms struggle to match, which strengthens competitive dynamics in the hedge fund market. Asset owner discussions in 2025 cited measurable improvements in signal quality from transaction, sentiment, and geospatial sources once embedded in systematic workflows, supporting sustained momentum for quantitative sleeves in the hedge fund market. The expansion is not only about performance but also about process because the operational capability to curate datasets and maintain model stacks demands specialized hiring that reinforces the shift of assets to data-capable platforms in the hedge fund market. The strongest adoption appears in developed markets with robust vendor ecosystems and university pipelines for quantitative talent, which accelerates the rise of systematic allocations across larger portfolios in the hedge fund market. Over the long term, the measurable growth outlook for quantitative and systematic strategies aligns with the 11.63% CAGR forecast for these approaches, which sets a baseline for continued share gains within the hedge fund market.
Interest Rate Carry on Cash Collateral
Higher policy rates reintroduce structural carry on cash balances and short sale proceeds, which lifts returns for market-neutral, long/short, and relative value managers with material cash or short rebate profiles in the hedge fund market. Allocators now evaluate managers on both alpha and cash management discipline because differences in how managers handle collateral, treasury ladders, and rebates create dispersion that compounds over time in the hedge fund market. This rate environment benefits spread-based and arbitrage strategies that can harvest carry while managing basis and convexity risks within conservative leverage limits in the hedge fund market. The carry layer is additive to active signals, which helps explain why several strategies remained resilient through episodic volatility in 2025 and into 2026, preserving downside buffers in the hedge fund market. Short-term tailwinds persist as long as cash yields remain elevated, although managers still need robust risk frameworks to handle liquidity and funding shocks in the hedge fund market.
Regulatory Developments in China’s QDLP/QFLP Schemes
China’s local refinements to cross-border structures reduce friction for qualified sponsors, with Shanghai’s 2025 updates widening permitted instruments, allowing tranche remittances, and facilitating foreign currency fundraising that supports onshore product launches relevant to the hedge fund market. Industry tracking reports expect national authorities to consolidate pilot programs into unified frameworks for QDLP and QFLP, which would simplify operations for global managers that pursue onshore access in the hedge fund market. Onshore access remains cyclical due to quota and currency policies, yet managers who build local infrastructure and compliance practices early can create durable distribution advantages in the hedge fund market [3]Norton Rose Fulbright Authors, “Shanghai Enhances QDLP Regime,” Norton Rose Fulbright, nortonrosefulbright.com . Capital market reforms across hubs like Shanghai and Shenzhen continue to influence the timing and scale of approvals, which requires sponsor patience and planning to meet allocator interest in local exposures within the hedge fund market. Over the medium term, regulatory cadence will shape the mix of onshore versus offshore vehicles that global allocators use to build China sleeves in the hedge fund market.
Restraints Impact Analysis of Hedge Fund Market*
| Restraint | (~) % Impact on CAGR Forecast | Geographic Relevance | Impact Timeline |
|---|---|---|---|
| Fee Compression and Expense Transparency Demands | -1.4% | Global, most acute in North America and Europe | Short term (≤ 2 years) |
| Prime Broker Margin Tightening | -0.6% | Global, concentrated impact on levered equity strategies | Short term (≤ 2 years) |
| ESG Compliance Under EU SFDR | -0.8% | Europe Direct, global for cross-border marketing | Medium term (2-4 years) |
| Quant Talent Cost Inflation | -0.9% | Global, most severe in North America and APAC tech hubs | Long term (≥ 4 years) |
| Source: Mordor Intelligence | |||
Fee Compression and Expense Transparency Demands
Allocators have tightened fee expectations, favoring structures with performance hurdles, clawbacks, and stronger expense reporting, which compresses economics for mid-sized managers in the hedge fund market. Competitive dynamics enable large multi-strategy platforms to push pass-through constructs that cover compensation and data infrastructure, while smaller managers without such leverage struggle to pass on costs in the hedge fund market. Asset owners continue to pressure total portfolio costs, which intensifies diligence on every line item and encourages simplified manager counts that amplify scale advantages in the hedge fund market [4]IG Prime Research Team, “Global Hedge Fund Survey 2024/2025,” IG Prime, ig.com. The result is a shift of flows toward managers with clear operating scale and long records, accelerating consolidation in the hedge fund market. Over the near term, this restraint acts as a gating factor for emerging and mid-sized shops without clear differentiation in the hedge fund market.
Prime Broker Margin Tightening
Regulatory and dealer surveys through late 2025 indicate stable headline financing rates but tighter non-price terms for concentrated or sector-focused equity strategies, which impacts leverage availability and turnover in the hedge fund market. The Office of Financial Research highlighted elevated hedge fund leverage in early 2025 in rates, derivatives, and equities, which leaves some strategies more exposed to dealer risk tolerance shifts in the hedge fund market. Hong Kong Monetary Authority analysis shows a heavy reliance on prime brokers and repo for secured borrowing across managers, creating cross-border complexity when margin terms change during stress in the hedge fund market. Managers reacted by reviewing cross-default language and operational processes after volatility spikes during 2025, aiming to reduce the risk of forced deleveraging in the hedge fund market. Short-term financing discipline and diversified funding sources remain essential to navigate dealer behavior in the hedge fund market.
*Our forecasts treat driver/restraint impacts as directional, not additive. The impact forecasts reflect baseline growth, mix effects, and variable interactions.
Hedge Fund Market Segment Analysis
By Strategy:
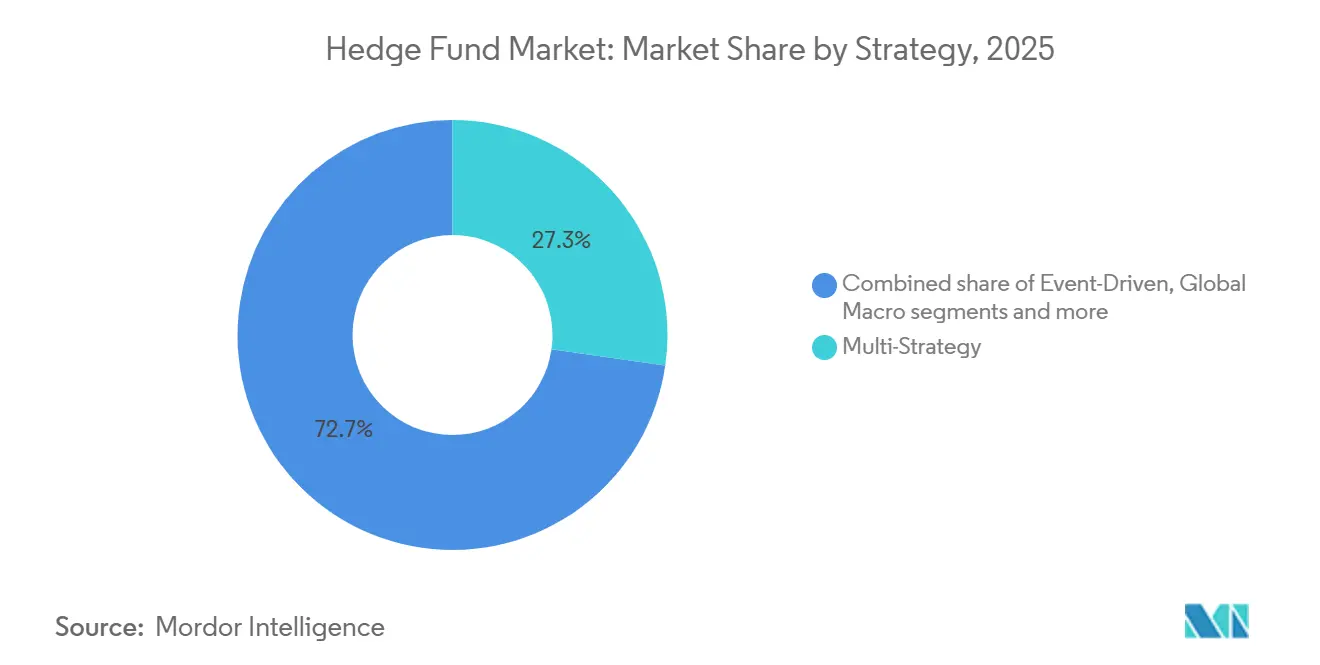
Quantitative Alpha Competes with Multi-Strategy ScaleMulti‑strategy platforms hold the largest 2025 position at 27.26% in scale, and fast capital reallocation across pods supported consistent performance in recent periods within the hedge fund market. Quantitative and systematic strategies carry the strongest growth outlook with an 11.63% CAGR through 2031, a trajectory that reflects deeper alternative‑data pipelines and stronger engineering capability at leading firms in the hedge fund market. Event‑driven came into 2026 with a stronger forward calendar after a soft deal environment in prior periods, while relative value strategies posted positive returns during several volatile quarters in 2025, which highlighted their defensive utility in the hedge fund market.
The forecast mix indicates a durable split between scale‑driven multi‑managers and data‑led systematic specialists, since one segment compounds AUM via flexible mandate rotation and the other harvests marginal alpha through differentiated data and models in the hedge fund market. Crypto‑native and digital‑asset strategies now appear in a majority of traditional platforms in some form, reflecting a broader shift toward tokenized rails and high‑frequency settlement integrations that touch the hedge fund market. The hedge fund market size attached to strategy cohorts expands unevenly across cycles because allocators reweight toward managers that prove resilience in higher‑rate environments and during equity volatility. Emerging‑markets macro managers also produced double‑digit results through late 2025, which has pulled more attention to country‑specific opportunities at the edge of benchmark allocations in the hedge fund market. Across strategies, the winners have maintained strong risk management and operational depth, factors that increasingly influence mandate decisions in the hedge fund market.


By Investor Type:
Retail Velocity Challenges Institutional DominanceInstitutional allocators controlled 65.92% of assets in 2025, and the hedge fund market share advantage remains with pension funds, sovereign wealth funds, and insurers that structurally require diversified sleeves to manage liabilities and volatility. Retail channels, however, are projected to grow at 13.07% through 2031 as policy actions and product design improvements increase access via defined‑contribution platforms and semi‑liquid wrappers that fit the liquidity needs of everyday savers in the hedge fund market. Policy developments in August 2025, including an executive order directing regulators to facilitate access to alternatives for 401(k) participants, positioned providers to expand menus of professionally managed options that include private strategies adjacent to the hedge fund market. Large recordkeepers and asset managers introduced collective investment trusts and target‑date series that incorporate private strategies during 2025, which sets the stage for more consistent contributions into the hedge fund market ecosystem. High‑net‑worth and family offices continue to prefer separately managed accounts for customization and governance, which strengthens direct‑to‑manager channels in the hedge fund market.
As retail channels scale, operational diligence remains in focus since semi‑liquid funds and interval designs must balance subscription convenience with liquidity risk and cost discipline in the hedge fund market. European liquid‑alternative formats also broaden access and enable cross‑border marketing to households and insurers that prefer UCITS structures for governance and liquidity, which adds to the global addressable base for the hedge fund market. The hedge fund market size attached to retail‑friendly wrappers grows as target‑date and CIT vehicles embed alternatives, which can diversify retirement portfolios while keeping fees under oversight thresholds for plan sponsors. Institutional reallocations proceed in parallel as plans integrate hedge funds into core portfolios based on risk budgets, indicating balanced growth across both institutional and retail channels in the hedge fund market. Over the forecast horizon, the blended demand from these channels supports steady inflows, even as performance cycles remain variable in the hedge fund market.
By Fund Structure:
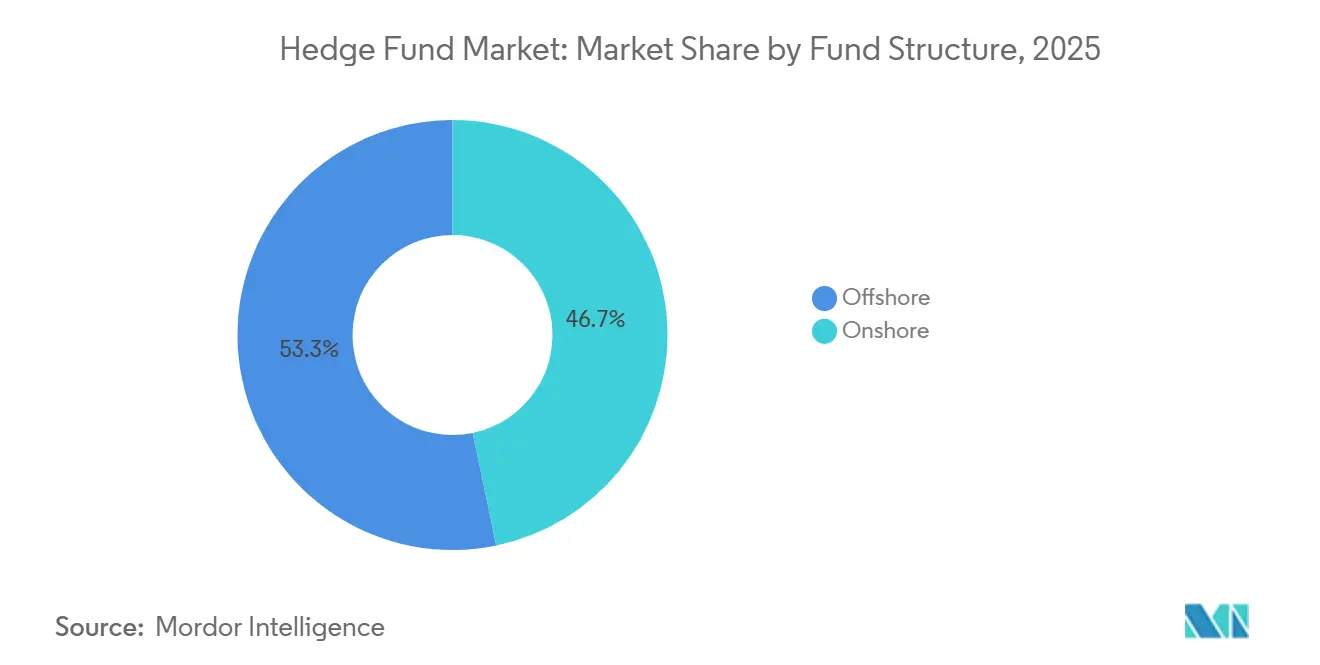
Hybrids Optimize Cross-Border Tax and AccessOffshore vehicles remain the most used structure with a 53.26% share in 2025 because tax neutrality and flexible documentation continue to fit cross‑border allocator needs in the hedge fund market. Onshore structures serve domestic taxable and tax‑exempt investors who prefer local reporting and regulatory frameworks, and they often operate as feeders or parallels in master‑feeder designs that simplify scaling in the hedge fund market. Hybrid architectures carry the highest growth projection at 11.26% as managers unify access for U.S. taxable, U.S. tax‑exempt, and non‑U.S. investors while optimizing withholding and treaty outcomes within a single design in the hedge fund market. European rule changes under AIFMD II that take effect in April 2026 add loan‑origination restrictions, leverage limits, and liquidity tools that influence structure choices for managers marketing across the EU in the hedge fund market. Jurisdictions such as the UAE have accelerated licensing timelines and expanded service ecosystems, which increase the menu of offshore hubs that institutional managers can evaluate in the hedge fund market.
Cayman remains a dominant domicile due to depth in legal precedents and service‑provider networks that global allocators trust, although new hubs gain share as firms look to diversify their operating footprint in the hedge fund market. High‑profile platform expansion to the Middle East, including reported plans for regional offices by top managers, reflects confidence in local regulator capabilities and business ecosystems that support scale in the hedge fund market. Several managers have signaled new Cayman launches in 2026, reinforcing the continued role of established offshore frameworks for institutional capital in the hedge fund market. Over the forecast period, the hedge fund market size across structure types will reflect regulatory shifts and allocator preferences for governance, cost, and operational resilience. Managers that maintain multi‑jurisdiction platforms with consistent investor experiences are positioned to capture mandates across varied policy regimes in the hedge fund market.
By Distribution Channel:
Tokenization Disrupts Legacy Subscription RailsDirect institutional mandates accounted for 42.12% of distribution in 2025, since large allocators prefer negotiated terms, transparency, and control over guidelines in the hedge fund market. Fund‑of‑funds use narrows where allocators seek to avoid layered fees, although manager‑selection platforms that deliver co‑investment and operational diligence maintain relevance in the hedge fund market. Digital marketplaces and tokenized fund rails are projected to grow at 16.89% as instant settlement, fractional ownership, and embedded compliance make onboarding and reporting faster for investors in the hedge fund market. Infrastructure progress includes DTCC’s project to tokenize DTC‑custodied U.S. Treasuries on Canton Network and J.P. Morgan AM’s launch of MONY, a tokenized money‑market fund with 24/7 redemption, which demonstrates operating models that remove legacy frictions in the hedge fund market. Tokenized vehicles from large managers have also scaled, and survey data show a majority of traditional funds expect to increase digital‑asset exposure, which supports long‑term channel expansion in the hedge fund market.
Separately managed accounts continue to gain traction among institutions because SMAs offer direct asset ownership, custom guidelines, and tailored fee arrangements under the control of the client in the hedge fund market. Regional adoption patterns suggest North America leads, with Europe and APAC expanding from smaller bases as infrastructure and governance standards converge in the hedge fund market. The hedge fund market size earmarked for SMAs is expanding alongside tokenized channels, and both reflect investor preferences for control, transparency, and speed during onboarding and redemption windows. Wealth and private‑bank platforms continue to curate manager lists and handle operational diligence for smaller allocators, which sustains an important bridge to the hedge fund market for private capital. Over the forecast period, the distribution mix will balance negotiated institutional mandates with rapid‑settlement tokenized rails and flexible SMA structures that together modernize the hedge fund market.
Geography Analysis
North America Hedge Fund Market
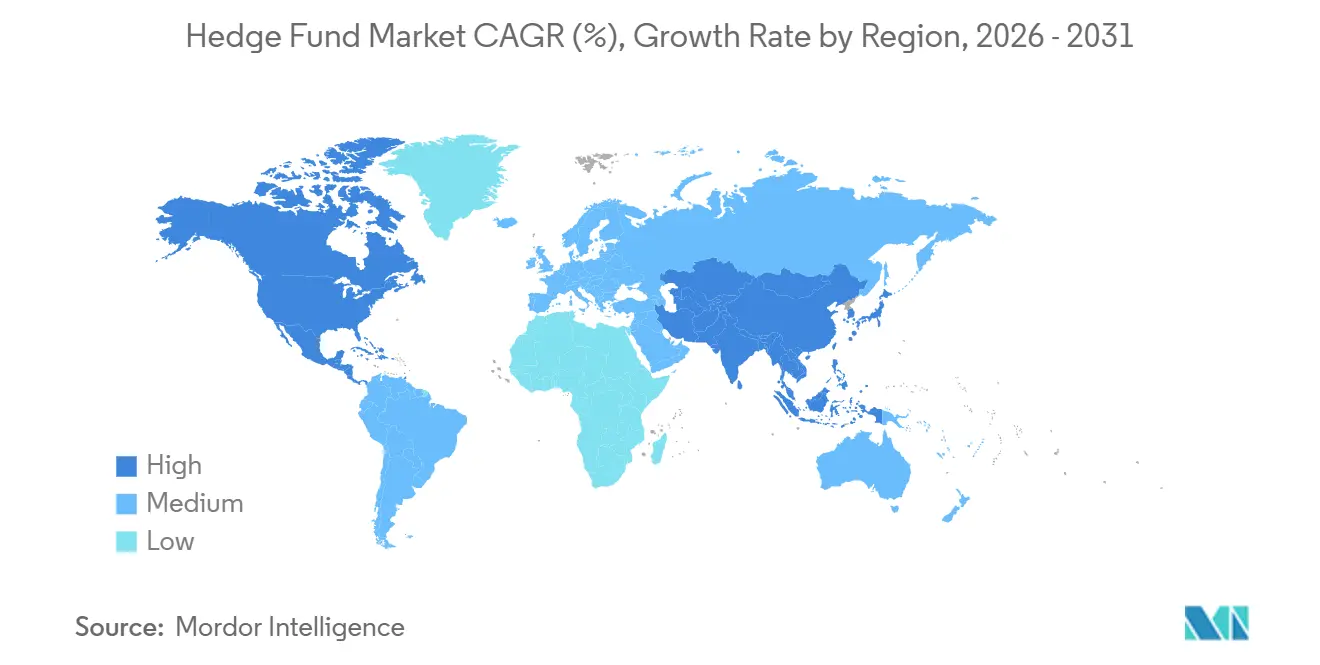
North America is expected to maintain its dominant position in the hedge fund market, accounting for a 73.06% share in 2025. Extensive allocator pools, prime brokerage services, and a well-established network of service providers underpin this dominance. The United States remains the core of the hedge fund market, supported by large-scale asset owners and a deep manager ecosystem, while Canada contributes a stable share through cross-border integration. Policy developments in 2025 enabled defined-contribution plans to access alternative strategies, driving innovation in retirement-focused products. The introduction of collective trust and target-date products incorporating private strategies is anticipated to streamline retail flows into diversified portfolios. Additionally, regulatory guidance under securities laws has simplified accredited onboarding processes, reducing administrative barriers for advisors allocating to hedge fund managers.
APAC Hedge Fund Market
The Asia-Pacific region is projected to achieve the highest growth rate in the hedge fund market, with a forecasted 12.56% increase through 2031. Institutional investments in Japan, Australia, Singapore, and Hong Kong provide a strong foundation, while increasing allocations in India add momentum. Reforms in China, including updates to QDLP and QFLP programs, have improved access for global managers to local investors, with the 2025 Shanghai updates easing operational constraints for onshore strategies. India’s hedge fund market is poised for significant growth in 2026, driven by rising exposure to alternatives among local family offices and institutions. Hong Kong’s updated OTC derivatives reporting and Market Sounding Guidelines enhance market integrity, while Singapore’s expanding licensing activity and service-provider capacity reinforce its role as a regional hub for structuring and operations.
Europe, The Middle East and LATAM Hedge Fund Market
Europe and the Middle East are also key regions in the hedge fund market. Europe, led by London, manages a substantial asset base and is adapting to regulatory changes such as SFDR 2.0 and AIFMD II, which will influence product design and cross-border marketing. ELTIF 2.0 reforms have broadened retail access to long-term investment funds, expanding distribution channels. In the Middle East, the UAE’s financial free zones attract global managers with favorable ownership, tax, and licensing conditions. Sovereign wealth funds in the region have increased allocations to hedge fund strategies, while Dubai’s growing ecosystem supports trading and risk infrastructure. Capital flows from the Middle East into Latin America may further open opportunities for specialist strategies as regulatory and currency conditions stabilize.

Regulatory Landscape
Regulation continues to tighten around systemic-risk monitoring, leverage, and liquidity management for alternative funds, with reporting calibration emerging as a 2026 theme. In the United States, the SEC and CFTC jointly proposed amendments to Form PF in April 2026, including higher reporting thresholds, notably a $1 billion threshold for smaller advisers and $10 billion for large hedge fund advisers. The proposal indicates a move toward more proportional requirements while keeping FSOC-focused risk visibility.
In Europe, AIFMD II (Directive (EU) 2024/927) is shifting the market toward more standardized liquidity tools and disclosures for open-ended AIFs. ESMA issued guidelines on liquidity management tools in March 2026 that align with the directive. In the United Kingdom, the FCA advanced post-Brexit restructuring through consultations in July 2026, including CP26/28 on a redesigned UK AIFM regime and CP26/26 on the Fund Reporting for Asset Management Entities (FRAME), both of which increase the operational weight of ongoing reporting, governance, and liquidity controls for managers distributing across the UK and Europe.
Value Chain Analysis
The hedge fund value chain starts with capital formation and product structuring, spanning fund legal setups across onshore, offshore, and hybrid vehicles. Alpha production then draws on research inputs such as fundamental analysis, alternative datasets, and model engineering. Portfolio construction and risk management translate signals into exposures, while trading and execution depend on OMS/EMS stacks, algorithmic execution, and access to venues across cash and derivatives markets. Financing, leverage, and shorting capacity are supplied primarily through prime brokers and repo counterparties, with custody and collateral management at the center of day-to-day operations.
Distribution and servicing increasingly require institutional-grade operations. Allocators demand operational due diligence, transparency, and robust controls, which pushes managers to rely on an extended service-provider ecosystem (administration, audit, legal, valuation, compliance, and technology vendors) alongside internal middle-office functions. Bargaining power varies with scale and concentration: mega multi-strategy platforms can negotiate better prime-broker terms and enterprise data licensing, while smaller managers often face higher unit costs in data, reporting, and operational staffing. Regulatory reporting change programs, including the SEC/CFTC Form PF timetable adjustments and expanded data requirements, also elevate the role of administrators, compliance tooling, and standardized data pipelines for fundraising and ongoing investor servicing.
Competitive Landscape
Mega platforms tighten their grip on the hedge fund market as the top five players employ the majority of platform personnel, indicating high market concentration. Their operating models resemble internal marketplaces that auction capital to pods scoring high on risk-adjusted return forecasts. Citadel’s centralized technology stack executes more than 60 million trades daily across asset classes, while Millennium deploys AI monitors that pulse liquidity metrics to every team in real-time. Point72 commits dedicated R&D spending to natural-language-processing pipelines that parse regulatory commentary minutes after release.
Scale advantages cascade into lower financing spreads negotiated with prime brokers. Goldman Sachs and Morgan Stanley extend balance-sheet capacity preferentially to high-volume clients, widening the cost gap versus mid-size funds. Data-vendor contracts increasingly feature enterprise-wide licensing unavailable to smaller peers. Consequently, sub-USD 1 billion managers face an uphill path unless they target capacity-constrained, specialist strategies such as catastrophe reinsurance or frontier-market credit.
Technology investment underpins strategic differentiation. BlackRock integrates its Aladdin analytics into hedge-fund pods, merging public and private-market datasets. Meanwhile, Man Group collaborates with cloud providers to reduce model-training runtimes by 70%. Tokenization partnerships emerge: Partners Group links with BlackRock to embed private-market sleeves into model portfolios distributed through wealth channels. These moves demonstrate that the competitive frontier now spans both portfolio construction and digital product design within the hedge fund market.
Hedge Fund Industry Leaders
Man Group plc
Renaissance Technologies LLC
Millennium Management LLC
AQR Capital Management
D.E. Shaw & Co.
- *Disclaimer: Major Players sorted in no particular order
Hedge Fund Market Companies Covered in this Report
- Man Group plc
- Renaissance Technologies LLC
- Millennium Management LLC
- AQR Capital Management
- D.E. Shaw & Co.
- Two Sigma Investments LP
- Point72 Asset Management
- Brevan Howard Asset Management
- Elliott Management Corporation
- Third Point LLC
- Tiger Global Management
- Pershing Square Capital Management
- Appaloosa Management LP
- Baupost Group
- Farallon Capital Management
- Capula Investment Management
- GSA Capital Partners
- Sculptor Capital Management (Och-Ziff)
- Citadel LLC
- Bridgewater Associates LP

Market Opportunities and Future Outlook
Operational modernization and AI-enabled workflows are a key whitespace area as the market concentrates around platforms that can fund data, compute, and controls at scale. The 2026 proof points cited in the report include Balyasny Asset Management deploying an internal AI-driven research platform across most investment teams, and Man Group partnering with Anthropic to integrate Claude into investment and operational processes. Together, these examples point to demand for governed adoption of LLMs across research, reconciliation, and investor reporting tasks, not just model deployment.
For service providers and managers, this supports modular, cloud-native operating models and managed-service configurations that reduce time-to-launch for new strategies and improve resilience around incidents, data lineage, and model risk governance. Distribution innovation is another opportunity pocket through digital marketplaces and tokenized rails that compress onboarding and settlement cycles for liquid-alternative exposures. In the cited report context, DTCC working with Digital Asset to tokenize DTC-custodied US Treasuries on Canton Network and J.P. Morgan Asset Management launching the tokenized money-market fund MONY on public blockchain rails highlight operational patterns, including 24/7 issuance and redemption, embedded compliance, and faster settlement, that can be adapted to hedge-fund-adjacent wrappers. At the same time, regulatory change in Europe and the UK around liquidity management tools and reporting is increasing demand for products and governance frameworks that package hedge-fund exposures to meet stricter disclosure and liquidity-tooling expectations.
Recent Industry Developments in Hedge Fund Market
- June 2026: Millennium Management agreed to back Hong Kong-based quant startup Third Epsilon Ltd., led by Paul Dou, to manage money exclusively for Millennium. The move expands Millennium's systematic capacity by anchoring a new team within its platform while keeping the capital base internal and stable. It also reinforces the competitive advantage of multi-strategy firms that can seed talent and scale strategies without relying on external fundraising cycles.
- April 2026: Millennium Management reached an agreement for Jain Global to return external investor capital and run exclusively for Millennium. Folding the operation into a single-platform capital base simplifies governance and risk budgeting while reducing business-model dependence on third-party subscriptions. The deal underscores consolidation dynamics as large platforms secure differentiated talent and capacity through exclusive arrangements.
- February 2026: Man Group announced a partnership with Anthropic to integrate Claude into investment and operational processes. This collaboration expands enterprise AI tooling across research productivity, risk controls, and operational automation.


Hedge Fund Market Report Scope and Research Methodology
Market Definition and Coverage
For this report, the hedge fund market is measured as global hedge fund assets under management (AUM), covering actively managed pooled investment vehicles that use tools like long and short positions, leverage, and derivatives to pursue absolute returns.
Scope exclusions: We exclude proprietary trading desks, private equity and venture capital funds, and closed-ended listed funds where investor capital is not managed as open-ended hedge fund AUM.
Segments Covered in This Report
- By Strategy
- Long/Short Equity
- Event-Driven
- Global Macro
- Relative Value
- Multi-Strategy
- Quantitative / Systematic
- Fund of Funds
- Other (e.g., Managed Futures, Credit, Emerging Markets, Volatility Arbitrage, Crypto/Digital Assets, etc.)
- By Investor Type
- Institutional Investors (Pension Funds, SWFs, Insurers, etc.)
- High-Net-Worth & Family Offices
- Retail
- By Fund Structure
- Onshore
- Offshore
- Hybrid
- By Distribution Channel
- Direct Institutional Mandates
- Fund of Funds
- Wealth / Private-Bank Platforms
- Digital Marketplaces & Tokenized Funds
- Others (e.g., Intermediaries, Exchange-Traded Products, etc.)
- By Geography
- North America
- Canada
- United States
- Mexico
- South America
- Brazil
- Argentina
- Peru
- Chile
- Rest of South America
- Asia-Pacific
- India
- China
- Japan
- Australia
- South Korea
- South East Asia (Singapore, Malaysia, Thailand, Indonesia, Vietnam, and Philippines)
- Rest of Asia Pacific
- Europe
- United Kingdom
- Germany
- France
- Spain
- Italy
- BENELUX (Belgium, Netherlands, and Luxembourg)
- NORDICS (Denmark, Finland, Iceland, Norway, and Sweden)
- Rest of Europe
- Middle East And Africa
- United Arab of Emirates
- Saudi Arabia
- South Africa
- Nigeria
- Rest of Middle East And Africa
- North America
Data Sources, Market Sizing, and Validation
Desk Research
Desk work starts by pinning down an AUM-based market definition, then collecting time series that can explain how AUM moves over time. We use public and official sources such as securities regulator releases (for example SEC and IOSCO), central bank and financial stability publications (for example BIS), IMF datasets on cross-border positions, and OECD and World Bank macro indicators.
We also review fund and manager disclosures that are publicly available, annual reports of listed management companies, and reputable financial press coverage to track launches, closures, and investor flow themes. In a few places, we use paid subscriptions for company financial intelligence, news and financials, and patent databases to support background checks on firms and product evolution, but the market totals remain anchored on repeatable AUM signals. These desk sources are not exhaustive, and many other public documents were reviewed for data collection, validation, and clarification.
Primary Interviews and Surveys
Primary inputs are used to pressure-test the AUM build and to understand how reporting practices differ by region and fund wrapper. We speak with allocators, fund operations and finance leaders, risk and portfolio teams, and service ecosystem participants, then we re-check assumptions on inflows, redemptions, and valuation practices across APAC, EMEA, and the Americas.
Distribution of primary research fieldwork respondents
| Company type | Respondent position | Region |
|---|---|---|
| Top tier: 31% | CXOs: 21% | APAC: 47% |
| Mid tier: 48% | Functional/Unit leaders: 23% | EMEA: 31% |
| Smaller Players: 21% | Managers: 56% | Americas: 22% |
Market-Sizing & Forecasting
Sizing is built with a top-down approach where AUM is reconstructed from industry AUM snapshots, then explained using the main drivers that move the asset base. To keep the totals realistic, we corroborate the outcome with selective bottom-up approximations, including a roll-up of a sampled set of manager AUM disclosures, and then a check on implied average AUM per fund against typical fund count ranges discussed by experts.
In the model, net subscriptions and redemptions, performance-driven asset appreciation, the pace of fund launches and liquidations, shifts across major strategy buckets (like equity long or short, macro, event-driven, and multi-strategy), and regional allocation trends between North America, Europe, and Asia are the primary inputs. Forecasting is run using scenario analysis because flows and performance can change quickly, and then scenarios are moderated using what interviewees expect for risk appetite, rate conditions, and liquidity. Where manager-level data is missing for smaller funds, gaps are handled through conservative scaling based on observed distribution patterns, followed by another round of checks on total growth versus macro and capital market signals.
Data Validation & Update Cycle
We validate the model by cross-checking AUM levels and growth rates against independent industry signals, then flagging any jumps that do not align with flows, performance patterns, or known market events. Outliers are reviewed in steps, first by the analyst building the model and then through an internal review where assumptions and conversions are re-tested.
Reports are refreshed annually, and interim updates are triggered when there are material market events that can move AUM, such as sharp drawdowns, unusually large inflow or outflow cycles, or major regulatory changes affecting fund structures. Before delivery, a final pass is done to confirm the latest public datapoints have been reflected and that the narrative matches the numbers.
Mordor Intelligence's Global Hedge Fund Market Size Versus Other Published Estimates
Published figures for the hedge fund industry often diverge because each publisher chooses a different measurement point and also a different definition of what should count as hedge fund AUM. Currency timing, the cut-off date (year-end versus mid-year), and how they treat fund wrappers can all change the final number.
Some sources emphasize end-of-year industry headlines that reflect what was reported at that time, and they may not align with a forward base year used for forecasting. Others remove smaller funds or apply a narrower fund eligibility rule, then apply one conversion rate across regions, which can move totals when the US dollar shifts. The spread is easier to interpret once the year, scope, and conversion method are laid out consistently, which is how Mordor Intelligence keeps the estimate tied to a defined AUM pool that excludes proprietary desks, private equity, and closed-ended listed structures.
Benchmark comparison
| Source | Market Size | Gaps in Research Methodology |
|---|---|---|
| Mordor Intelligence | USD 5.71 T (2026) | |
| Industry Data Provider A | USD 4.50 T (2024) | Uses a year-end 2024 industry AUM snapshot, and it can differ from a forward base year because performance and net flows in the intervening period are not carried into the starting point. |
| Global Newswire B | USD 4.51 T (2024) | Reports an industry AUM figure referenced to 2024 and typically inherits the underlying snapshot definition, which may not adjust for scope exclusions and conversion timing the same way across regions. |
The table shows that timing and scope choices are the main drivers behind the gap, more than simple math differences. Once the sizing year is aligned and the inclusion rules are stated clearly, the remaining variance usually comes from how inflows, redemptions, and valuation moves are carried into the starting AUM.


Key Questions Answered in the Report
What is the current size and growth outlook for the hedge fund market?
The hedge fund market size is USD 5.71 trillion in 2026 and is projected to reach USD 8.83 trillion by 2031 at a 9.12% CAGR, reflecting steady institutional and retail channel expansion.
Which strategies are leading and which are growing the fastest in the hedge fund market?
Multi-strategy platforms lead with a 27.26% share in 2025, while quantitative and systematic strategies are the fastest growing with an 11.63% CAGR projected through 2031.
How is distribution evolving in the hedge fund market?
Direct institutional mandates hold 42.12% share, and tokenized or digital marketplaces are projected to grow at 16.89% as on-chain rails enable instant settlement, fractional ownership, and improved transparency.
Which regions dominate, and where is growth strongest in the hedge fund market?
North America accounts for 73.06% of assets, while Asia‑Pacific holds the strongest growth outlook at 12.56% CAGR through 2031 on rising allocations and evolving cross-border access.
What regulations are shaping the hedge fund market in 2026?
SFDR 2.0 proposals in Europe require portfolio-level thresholds and exclusions by 2028, and AIFMD II takes effect in April 2026 with leverage, loan‑origination, and liquidity‑management requirements, which together influence product design and marketing.
How are tokenization and digital assets affecting the hedge fund market?
Surveys and launches show rising allocations to digital assets and growing interest in tokenized fund structures, with industry initiatives like DTCC’s Canton Network project and J.P. Morgan AM’s MONY fund demonstrating operational advantages.
Page last updated on:


 Your data is secure and never sold or shared.


