
Market Overview
| Study Period | 2020 - 2031 |
|---|---|
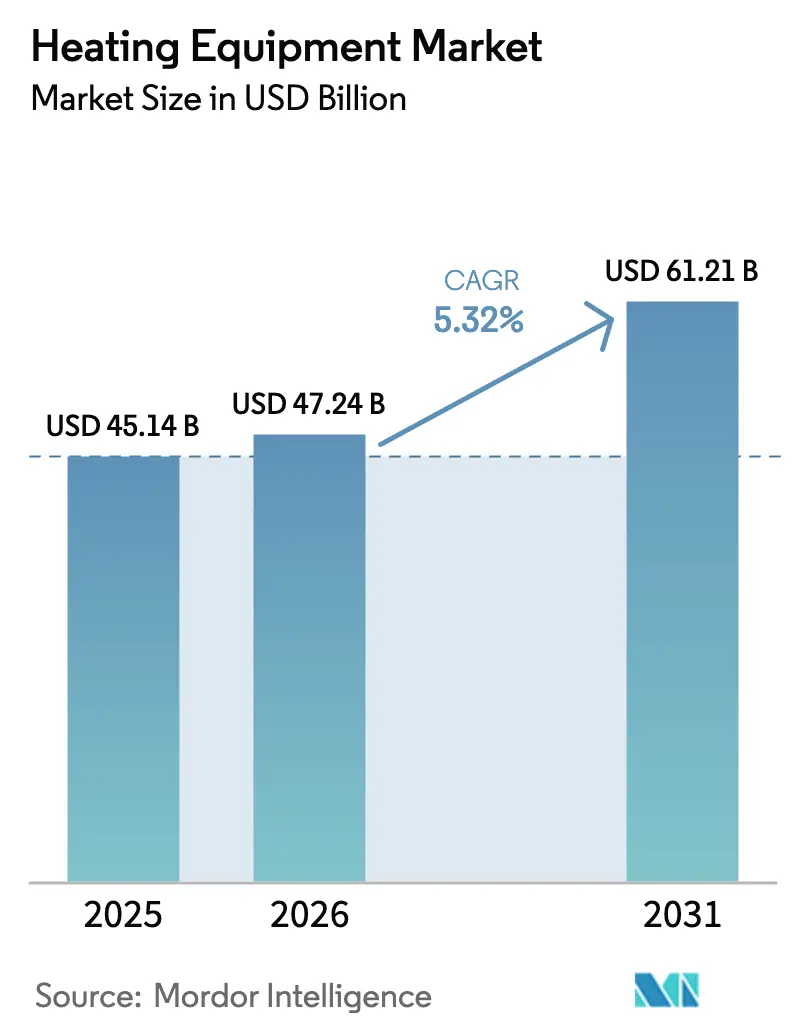
| Market Size (2026) | USD 47.24 Billion |
| Market Size (2031) | USD 61.21 Billion |
| Growth Rate (2026 - 2031) | 5.32% CAGR |
| Fastest Growing Market | Middle East and Africa |
| Largest Market | Asia Pacific |
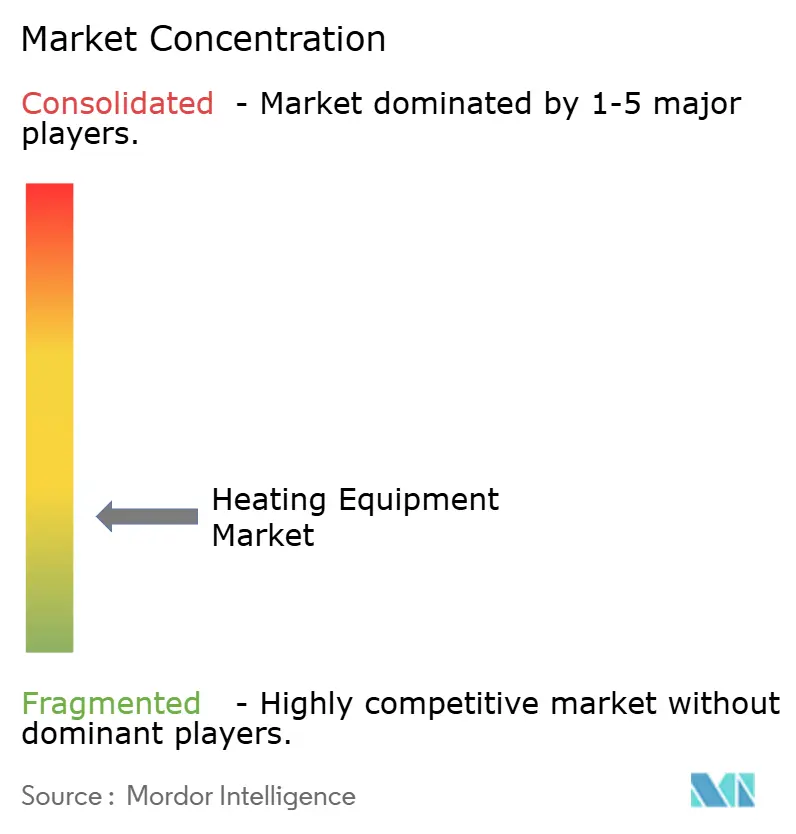
| Market Concentration | Low |
Major Players *Disclaimer: Major Players sorted in no particular order Image © Mordor Intelligence. Reuse requires attribution under CC BY 4.0. | |
Heating Equipment Market Analysis by Mordor Intelligence
The heating equipment market size is expected to increase from USD 45.14 billion in 2025 to USD 47.24 billion in 2026 and reach USD 61.21 billion by 2031, growing at a CAGR of 5.32% over 2026-2031. Growth reflects performance-based building codes, corporate decarbonization pledges, and electrification programs that favor heat pumps over combustion appliances. Heat pumps now offer year-round comfort as single assets, while hydrogen-ready boilers give building owners a phased decarbonization path. District-energy operators are pairing waste-heat loops with centralized heat pumps to offset natural-gas demand, and manufacturers are investing in modular compressors that shorten installation time. Policy-linked rebates continue easing first-cost barriers, yet grid planners must manage coincident winter peaks as more dwellings electrify.
Key Report Takeaways
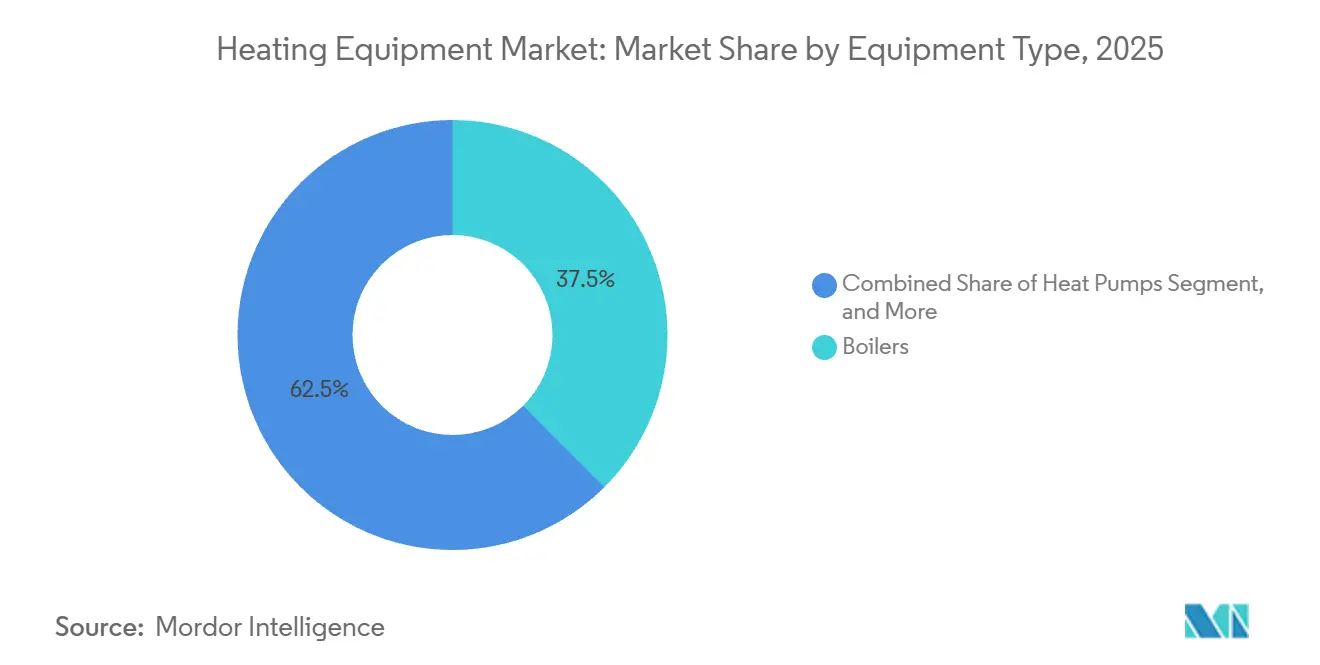
- By equipment type, boilers retained 37.54% of heating equipment market share in 2025 while heat pumps are advancing at a 6.38% CAGR through 2031.
- By end-user industry, the residential segment commanded 57.83% of the heating equipment market size in 2025 and is projected to post a 6.42% CAGR to 2031.
- By fuel type, electricity-based systems captured 54.72% share in 2025, whereas hydrogen-ready configurations represent the fastest growing slice at a 6.63% CAGR.
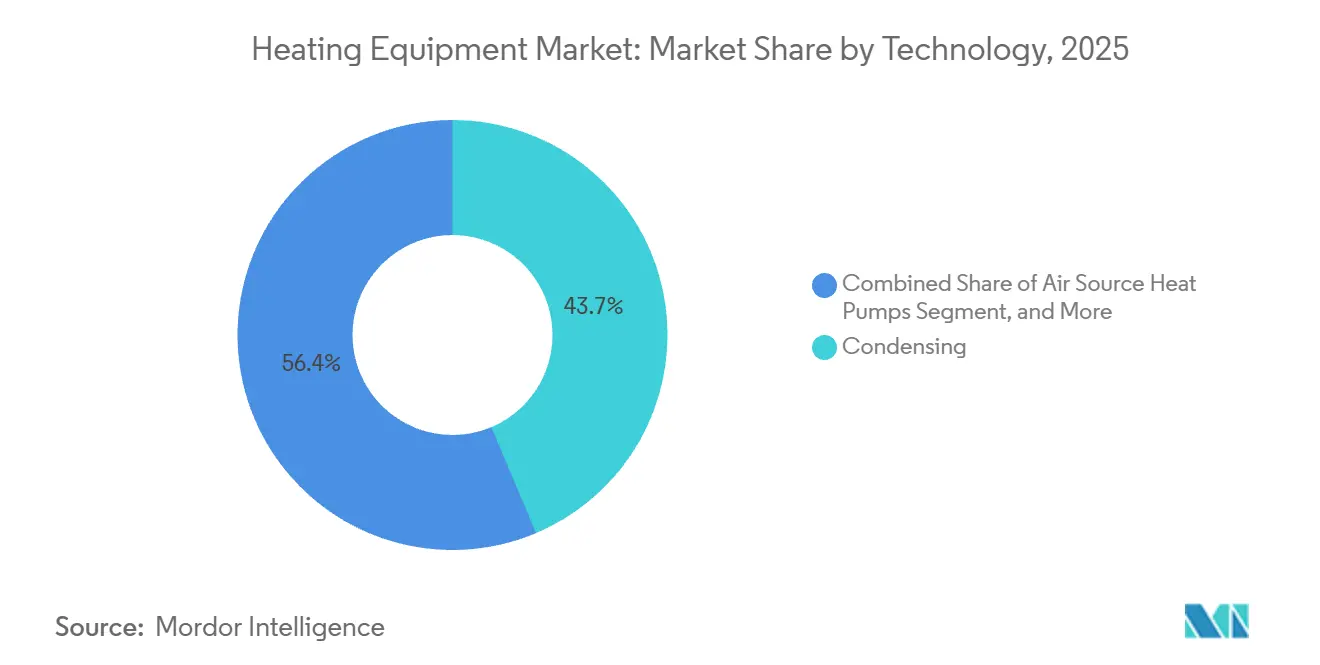
- By technology, condensing boilers accounted for 43.65% of the heating equipment market size in 2025, yet air-source heat pumps are on track for a 7.67% CAGR.
- By installation type, replacement and retrofit activity represented 70.32% of market share in 2025, while new installations are forecast to rise at a 6.89% CAGR through 2031.
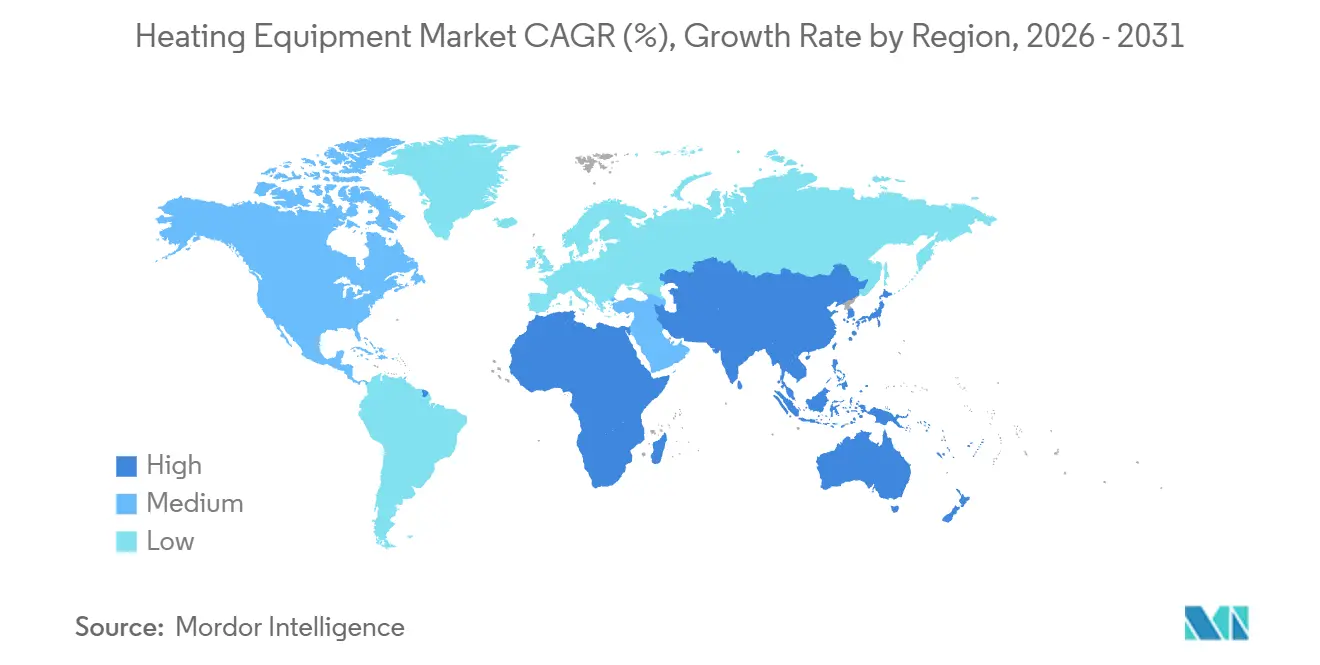
- By geography, Asia-Pacific led with a 40.19% revenue share in 2025, whereas the Middle East and Africa region is positioned for the fastest 7.78% CAGR to 2031.
Note: Market size and forecast figures in this report are generated using Mordor Intelligence’s proprietary estimation framework, updated with the latest available data and insights as of January 2026.
Global Heating Equipment Market Trends and Insights
Drivers Impact Analysis*
| Driver | (~) % Impact on CAGR Forecast | Geographic Relevance | Impact Timeline |
|---|---|---|---|
| Electrification Push in Cold-Climate Retrofit Programs | +1.2% | North America and Europe, spillover to Northeast Asia | Medium term (2-4 years) |
| Carbon-Neutral Corporate Campuses Demand On-Site Heat Pumps | +0.8% | Global, concentrated in North America and Western Europe | Short term (≤ 2 years) |
| Gas-Phase Heat Pump Innovations for High-Temperature Industrial Drying | +0.6% | Europe and Asia-Pacific manufacturing hubs | Long term (≥ 4 years) |
| Performance-Based Building Codes Accelerating Boiler Replacement | +1.0% | Europe and select North American cities | Medium term (2-4 years) |
| Waste-Heat-to-Heat-Pump Integration in District Energy | +0.5% | Northern Europe, China, South Korea | Long term (≥ 4 years) |
| Green Hydrogen Blending Pilots in Commercial Boilers | +0.4% | Germany, Netherlands, United Kingdom | Long term (≥ 4 years) |
| Source: Mordor Intelligence | |||
Electrification Push in Cold-Climate Retrofit Programs
Sub-zero regions now direct public money toward heat-pump retrofits that displace fuel-oil and propane systems. New York’s Clean Heat program allocated USD 250 million in 2025 for 100,000 residential conversions, while Quebec earmarked CAD 300 million (USD 222 million) to leverage surplus hydro power.[1]New York State Energy Research and Development Authority, “Clean Heat Program,” nyserda.ny.gov Hardware is ready; Mitsubishi’s Zuba-Central ducted unit maintains full output at minus-30 °C, and Carrier pairs water-source heat pumps with glycol loops to prevent frosting. The choke point has shifted from technology readiness to installer capacity and utility rate design that still lags hardware innovation by roughly two years.
Carbon-Neutral Corporate Campuses Demand On-Site Heat Pumps
Corporations pursuing Science Based Targets swap boilers for large water-source or ground-source systems to erase Scope 1 emissions. Microsoft retrofitted 12 data-center campuses, cutting natural-gas use 85% and retiring offset purchases.[2]Microsoft, “2025 Sustainability Report,” microsoft.com Amazon specified ground-source units for German and Polish warehouses, and Unilever is electrifying 40 factories by 2030. Each job often exceeds 500 kW, carries multi-year service revenue, and favors heat-pump-as-a-service contracts in which OEMs bill per delivered kilowatt-hour rather than equipment sales.
Gas-Phase Heat Pump Innovations for High-Temperature Industrial Drying
Industrial lines needing 120 °C-plus supply now test gas-phase units driven by natural gas or biogas. A German textile mill pilot cut primary energy 40% and delivered under-four-year payback, spurring European and Japanese funding rounds.[3]German Federal Ministry for Economic Affairs and Climate Action, “Industrial Heat-Pump Funding,” bmwk.de Bosch and Johnson Controls are engineering modular systems up to 2 MW, positioning for upcoming revisions to the European Industrial Emissions Directive that could mandate such solutions.
Performance-Based Building Codes Accelerating Boiler Replacement
Regulators now cap building energy intensity rather than prescribing equipment ratings. The United Kingdom’s Future Homes Standard bans fossil heating in new homes from 2026, Germany’s GEG forces 65% renewable heat in replacements, and France’s RE2020 imposes carbon caps that de facto eliminate gas-only boilers. These rules shorten upgrade cycles to five-to-seven-year windows, pushing both heat-pump makers and boiler brands to rush hydrogen-ready models that satisfy interim thresholds while hedging future fuel mixes.
Restraints Impact Analysis*
| Restraint | (~) % Impact on CAGR Forecast | Geographic Relevance | Impact Timeline |
|---|---|---|---|
| Grid-Capacity Bottlenecks in Electrified Neighborhoods | -0.9% | North America and Europe, urban clusters | Short term (≤ 2 years) |
| Skilled-Labor Shortages for Multi-Technology Retrofits | -0.7% | Global, acute in Germany, United Kingdom, United States | Medium term (2-4 years) |
| Volatile Nickel Prices Inflating Advanced Heat-Pump BOM | -0.4% | Global, supply-chain exposure in Asia-Pacific | Short term (≤ 2 years) |
| Fragmented Residential Rebate Administration | -0.3% | United States and European Union member states | Medium term (2-4 years) |
| Source: Mordor Intelligence | |||
Grid-Capacity Bottlenecks in Electrified Neighborhoods
Rapid electrification can double winter peaks, overloading transformers and feeders sized for gas-heated homes. National Grid flagged 22% of low-voltage circuits in Greater London for reinforcement, with upgrade costs near GBP 4,000 (USD 5,200) per household and lead times stretching 18 months. Eversource delayed 1,200 applications in Massachusetts because substations lacked spare capacity. German utilities estimate EUR 50 billion (USD 54 billion) of network investment by 2035, expenses that ultimately raise delivered electricity prices. Demand-response curtailments help, but add installation complexity when contractors must enroll customers and commission smart thermostats.
Skilled-Labor Shortages for Multi-Technology Retrofits
Heat-pump rollouts demand HVAC, electrical, and plumbing competence, yet training pipelines lag. The United Kingdom needs 30,000 certified installers by 2030, but had roughly 3,000 in 2025. Germany faces a 60,000-technician shortfall, and only 15% of U.S. contractors are proficient in cold-climate commissioning. OEMs respond with VR simulators and community-college curricula, yet these moves take two-plus years to yield field-ready talent, lengthening project queues and dampening consumer confidence.
*Our forecasts treat driver/restraint impacts as directional, not additive. The impact forecasts reflect baseline growth, mix effects, and variable interactions.
Segment Analysis
By Equipment Type: Heat Pumps Erode Boiler Dominance
Boilers still hold 37.54% market share in 2025, anchored by industrial steam and district-energy loads requiring 90 °C-plus output. Heat pumps, however, are advancing at a 6.38% CAGR and increasingly cannibalize forced-air furnace replacements in North America and hydronic radiators in Europe. Furnaces linger in ducted U.S. housing but now face direct substitution via ducted inverter heat pumps. Niche devices such as radiant panels capture specialty applications yet carry premium margins. The competitive divide shows residential and light-commercial customers pivoting hard toward electrification, while high-temperature industrial lines retain boilers until gas-phase technology or hydrogen blending scales. Hybrid heat-pump-plus-boiler packages ease adoption by allowing 80% electrified annual load with fossil backup for extreme peaks, smoothing grid impact and homeowner cost.
Strategic differentiation revolves around software. Trane’s Tracer platform forecasts occupancy and weather, pre-heats during off-peak tariffs, and unlocks utility incentives for demand shedding. These features move the heating equipment market from hardware margin to lifetime service value, raising barriers for price-only entrants and encouraging incumbents to bundle analytics with warranty and maintenance.


By End-User Industry: Residential Volume Versus Industrial Value
In 2025, residential buyers made up 57.83% of the market share and are projected to grow at a CAGR of 6.42% through 2031. This growth is bolstered by U.S. tax credits, European retrofit mandates, and China's transition from coal to electricity. Meanwhile, commercial property managers, focusing on total cost of ownership, command a share of about 25%, showing a preference for units primed for building-automation integration.
Industrial customers, at 12%, value 120 °C-plus capability and custom engineering, often paying more than USD 100,000 per 500-kW unit; Thermax leveraged this specialization to win pharmaceutical and dairy waste-heat projects. Public facilities adopt early due to policy mandates despite longer paybacks. Purchase behavior thus varies, residential sales hinge on rebate simplicity and financing, commercial deals on demand-response and warranty, and industrial contracts on process integration depth.
By Fuel Type: Electricity Leads as Hydrogen Hedges
Electricity-based systems held 54.72% market share in 2025, reflecting cheap hydro in Scandinavia and Quebec and falling rooftop solar costs. Natural gas lingers where pipeline access keeps delivered cost lower than retail power. Oil use shrinks as subsidies vanish, while biomass boilers serve off-grid sites with forestry residues.
Hydrogen-ready models grow at a 6.63% CAGR, hedging grid decarbonization. Bosch launched a boiler certified for 100% hydrogen yet deployable today on gas networks, offering owners forward compatibility. Viessmann’s burner can convert in two hours, minimizing downtime once 20% blending becomes standard. Economics depend on green-hydrogen price trajectories that IRENA expects below USD 2/kg by 2030, a threshold that could reset comparative fuel costs.
By Technology: Air-Source Units Accelerate, Condensing Boilers Hold Installed Base
Condensing boilers captured 43.65% share in 2025 because they retrofit easily into existing hydronic loops while meeting efficiency rules. Air-source heat pumps, though, post a 7.67% CAGR as R-32 and R-454B refrigerants cut global-warming potential without sacrificing low-temp capacity. Ground-source systems boost seasonal performance but face high drilling cost barriers.
Hybrid solutions blend the two, popular in the United Kingdom and Netherlands where gas infrastructure persists. Variable-speed inverter compressors represent the core technology leap, with Panasonic’s dual-rotary design retaining full capacity at -20 °C and Daikin’s high-temperature model delivering 70 °C water for legacy radiators. Smart sensors and cloud diagnostics turn equipment into grid-interactive assets eligible for balancing-market revenue.
By Installation Type: Retrofit Dominance with New-Build Upswing
Retrofits accounted for 70.32% of 2025 activity as Europe and North America tackled boiler fleets aged 15 years or more. New installations, however, are climbing at a 6.89% CAGR during the forecast period. This is because developers must now meet performance certificates that ban non-condensing units from day one.
Retrofits are complex, often needing electrical-panel upgrades and envelope improvements; new builds integrate heat pumps with heat-recovery ventilation to minimize system size. Programs such as Germany’s EUR 13 billion Federal Funding for Efficient Buildings and France’s MaPrimeRénov grants compress replacement cycles but create policy-driven demand spikes when budgets lapse.
Geography Analysis
Asia-Pacific held 40.19% of 2025 revenue as China converted coal boilers, India’s middle class upgraded to ducted heat pumps, and Japan subsidized inverter units. Europe followed at roughly 30% as German, French, and United Kingdom mandates converged, though grid limits and labor shortages temper growth. North America represented about 20%; Inflation Reduction Act credits up to USD 2,000 per home accelerated adoption in cold states, while Canadian provinces leaned on hydro surplus. The Middle East and Africa lead in growth at a 7.78% CAGR amid giga-projects like NEOM that specify solar-thermal-heat-pump hybrids. South America remains small but gains momentum in Brazil’s hydro-rich southern states where social housing now opts for split heat-pump systems.
China’s market splits between centralized district heating in the north and individual split units in the south, forcing OEMs to tailor product lines. India logged Daikin sales growth of 18% in 2025 as apartment construction boomed. Japan’s trade ministry targets 5 million residential units by 2030 to curb liquefied natural-gas imports. In the Middle East, Dubai’s district-cooling network pilots heat-recovery chillers to supply hotel hot water, underlining that heating demand exists even in hot climates.
Europe accounted for roughly 30% of the heating equipment market share in 2025 as retrofit grants and rising carbon prices converged to accelerate boiler replacement, yet sustained expansion hinges on clearing installer backlogs and reinforcing urban distribution grids, particularly in cities such as London and Munich that face 18-month transformer lead times. North America held about 20% of 2025 demand, with Inflation Reduction Act tax credits of up to USD 2,000 per household and provincial cold-climate rebates in Canada boosting residential uptake. Data-center waste-heat recovery offers fresh upside across the United States hyperscale corridor, where operators are evaluating absorption-heat-pump pairings to curb diesel-boiler runtime. Latin America remains a niche today, yet Brazil’s hydro-rich southern states are piloting tariff structures that reward heat-pump load shifting to off-peak periods, laying groundwork for future scaling.

Regulatory Landscape
Heating equipment regulations increasingly combine building-performance mandates with refrigerant-transition rules, shaping both product roadmaps and compliance costs. In Europe, the United Kingdoms Future Homes Standard bans fossil heating in new homes from 2026, Germanys GEG requires 65% renewable heat in replacements, and Frances RE2020 embeds carbon caps that disadvantage gas-only boilers, reinforcing the shift toward heat pumps and hybrid or hydrogen-ready configurations.
On the refrigerant side, the US EPA is implementing AIM Act technology-transition requirements that tighten allowable refrigerants across HVAC categories, including restrictions tied to VRF equipment using R-410A from January 1, 2026, and additional clarifications and targeted relief finalized with an effective date of July 27, 2026. At the state level, the California Energy Commission 2025 Building Energy Efficiency Standards add a further compliance layer that emphasizes electrification and indoor air quality, accelerating adoption of electric space and water heating solutions in new construction and retrofits.
Value Chain Analysis
The heating equipment value chain covers raw materials and components (steel, copper, aluminum, power electronics, controls, compressors, and refrigerants), OEM manufacturing and final assembly, channel partners (wholesalers, distributors, and contractors), and downstream installation, commissioning, and service. Refrigerant-transition compliance increases redesign and testing work upstream, while electronics and compressor availability plus logistics constraints can affect lead times for custom configurations. In retrofit-heavy markets, installer and commissioning capacity continues to act as a practical bottleneck.
OEM strategies increasingly focus on controlling critical components and monetizing lifecycle services. Vertical integration, exemplified by Daikins in-house approach to key subsystems, supports supply assurance and margin control, while platform tie-ups that link equipment to building-management software pull more value into monitoring, predictive maintenance, and demand-response enablement. Order visibility also reinforces the role of backlog management and service networks in stabilizing deliveries and shifting equipment sales toward recurring revenue.
Competitive Landscape
The heating equipment market displays fragmentation with players like Daikin, Carrier, Bosch, Trane, NIBE and Others. Demand-response readiness shapes differentiation; Daikin filed 2025 patents for occupancy-led pre-heating algorithms. NIBE bought 14 European contractors to lock in service revenue and ensure installation quality, while Chinese rivals Gree and Midea push into Europe with 20-30% price discounts but thinner support networks. Waste-heat recovery in data centers and factories is an emerging battleground as OEMs bundle absorption chillers with high-lift heat pumps. Hybrid systems pit Bosch and Viessmann’s integrated packages against Carrier and Trane’s modular add-ons, letting customers migrate in stages.
Residential competition intensifies as rebate schemes lower effective purchase price, compelling incumbents to highlight extended warranties and smart-home integration. Industrial high-temperature projects remain fragmented, allowing Thermax and Mayekawa to secure projects that demand process-specific engineering. Software-only disruptors such as Sense retrofit legacy boilers with IoT controllers, threatening replacement-driven sales models by extracting demand-response value from existing assets.
Alliances between equipment makers, energy utilities, and cloud-platform vendors are deepening as each side seeks recurring software and balancing-market revenue. Boiler incumbents are co-developing hydrogen-combustion trials with pipeline operators to secure early mover status once 20% blending becomes mainstream. At the same time, venture capital is funding start-ups that layer predictive maintenance analytics onto any brand of heat pump, eroding brand-lock advantages that traditional manufacturers long enjoyed. These dynamics signal a shift toward ecosystem competition where hardware, fuel supply, and data services converge, favoring players that can orchestrate the full stack rather than excel at a single component.
Heating Equipment Industry Leaders
Robert Bosch GmbH
Daikin industries ltd
Carrier Global Corporation
Trane Technologies plc
Mitsubishi Electric Corporation
- *Disclaimer: Major Players sorted in no particular order

Market Opportunities and Future Outlook
Cold-climate electrification programs and code-driven replacements create room for high-performance heat pumps that can fit into legacy radiator and hydronic systems without deep envelope upgrades. Daikins April 2026 launch of a high-temperature air-to-water heat pump with operation down to -28 C supports expansion into colder regions and into higher-supply-temperature retrofit use cases where boilers historically dominated.
A second opportunity is installation enablement and digital services that reduce project friction and improve realized performance. Carriers Ventures March 2026 investment in Heat Geek highlights the value pool around installer networks, training, and quality assurance, directly addressing the skilled-labor constraint in major retrofit markets. In parallel, refrigerant transitions under the US EPA AIM Act and state-level electrification rules, including Californias 2025 building standards, favor OEMs and distributors that can handle compliant product changeovers, inventory planning, and contractor education while expanding connected monitoring and demand-response capabilities.
Recent Industry Developments
- April 2026: Daikin launched the Daikin ALTHERMA 3 H HT high-temperature air-to-water heat pump system, capable of operating down to -18 degrees Fahrenheit (-28 degrees Celsius). The cold-climate capability expands Daikin's reach in energy efficient heating for residential markets and supports the broader shift toward electrification. The development strengthens Daikin's position in high-temperature and low-temperature efficiency for residential heating.
- March 2026: Carrier Ventures made a strategic investment in Heat Geek, a UK-based platform, to support the expansion of electrified heating and residential heat pump adoption across Europe. The investment creates an installer-network platform intended to accelerate heat-pump adoption. It targets installation bottlenecks that can limit scaling European residential heat-pump deployment.
- January 2026: Daikin earmarked EUR 200 million to expand its Ostend, Belgium factory, lifting heat-pump capacity to 800,000 units per year by 2027. The capacity expansion improves supply readiness and scaling for European demand. It strengthens manufacturing capabilities to support growing market demand.


Research Methodology Framework and Report Scope
Market Definition and Coverage
For this study, the heating equipment market covers revenues generated from equipment that produces space heating and hot water for residential, commercial, and industrial buildings, tracked across major regions and major fuel and technology choices.
Scope exclusions: We exclude building envelope materials, standalone electrical components, and ongoing utility energy charges that are not part of equipment revenue.
Segmentation Overview
- By Equipment Type
- Boilers
- Furnaces
- Heat Pumps
- Radiators
- Other Heater Types
- By End-User Industry
- Residential
- Commercial
- Industrial
- Public/Institutiona
- By Fuel Type
- Natural Gas
- Electricity
- Oil
- Biomass
- Hydrogen-Ready
- By Technology
- Condensing
- Non-Condensing
- Air Source Heat Pumps
- Ground Source Heat Pumps
- Hybrid Systems
- Smart Connected Systems
- By Installation Type
- New Installation
- Replacement/Retrofit
- By Geography
- North America
- United States
- Canada
- Mexico
- South America
- Brazil
- Argentina
- Rest of South America
- Europe
- United Kingdom
- Germany
- France
- Spain
- Italy
- Rest of Europe
- Asia-Pacific
- China
- India
- Japan
- Australia
- South Korea
- Rest of Asia-Pacific
- Middle East and Africa
- Middle East
- Saudi Arabia
- United Arab Emirates
- Turkey
- Rest of Middle East
- Africa
- South Africa
- Kenya
- Rest of Africa
- Middle East
- North America
Data Sources, Market Sizing, and Validation
Desk Research
Desk research sets the base structure for the model, especially for where heat demand exists and how it is supplied. We typically used public sources such as the International Energy Agency for space heating demand signals, the International Renewable Energy Agency for electrification context, the US Energy Information Administration for fuel mix and consumption series, and Eurostat for building and energy indicators in Europe.
It was then supported using sources such as UN Comtrade trade flows for heating appliances, national statistics offices for construction and housing stock indicators, and standards and policy sources that shape replacement cycles, for example, efficiency rules and electrification targets. We also reviewed company annual reports, investor presentations, and reputable industry press to understand product mix shifts and pricing direction, then used approved paid subscriptions for company financials, patent checks, and shipment-level import-export views where the public series were not granular enough. These examples are not exhaustive, and many other sources were also referred to for data collection, validation, and clarification.
Primary Interviews and Surveys
Primary interviews and surveys were used to pressure-test assumptions on replacement timing, channel pricing, technology substitution (for example, heat pumps replacing boilers in select climates), and the share of demand coming from new builds versus retrofits. We spoke with a mix of manufacturers, distributors, installers, engineering firms, and large end users across major geographies, so gaps from desk inputs could be filled and then checked again through multiple viewpoints.
Distribution of primary research fieldwork respondents
| Company type | Respondent position | Region |
|---|---|---|
| Top tier: 37% | CXOs: 15% | APAC: 45% |
| Mid tier: 47% | Functional/Unit leaders: 39% | EMEA: 34% |
| Smaller Players: 16% | Managers: 46% | Americas: 21% |
Market-Sizing & Forecasting
Sizing starts from a top-down build that reconstructs demand using the building stock and heating intensity, and then applies technology and fuel mix splits by region. For each geography, we mapped the relevant installed-base signals, the pace of new floor space additions, and replacement behavior, which are then translated into annual equipment units and revenue using average selling price ranges.
To keep the numbers grounded, selective bottom-up checks were added, such as supplier revenue rollups for major equipment lines, channel checks on contractor pricing, and sampled ASP-to-volume math for high-volume categories. Inputs that mattered most included residential and non-residential construction activity, heating degree day patterns that affect equipment sizing, efficiency regulation timing that pulls replacement forward, electricity and gas price direction that shifts buyer preference, and adoption rates for heat pumps and condensing systems. Forecasts were mainly built using scenario analysis, where growth paths were tied to policy support, retrofit funding, and capacity expansion plans shared by interviewees, and then adjusted when the implied penetration looked inconsistent with observed installation capacity. When a country had limited unit data, we used proxy indicators, like floor space growth and heating fuel mix, and only scaled up after primary checks confirmed that the proxy relationship held locally.
Data Validation & Update Cycle
Validation is done by triangulating the modeled totals against independent signals like trade movements, construction cycles, and regional energy use trends, and then checking whether the implied unit volumes and pricing look sensible. Any outliers, sharp year jumps, or unusual regional splits are reviewed by another analyst, and follow-up outreach is triggered when the variance cannot be explained by a clear policy or macro change.
The report is refreshed annually, and interim updates are made if there is a material event that shifts demand, pricing, or availability. Before delivery, we run a final pass to confirm the latest macro inputs and to ensure the assumptions still match what industry participants are currently seeing.
Mordor Intelligence's Global Heating Equipment Market Size Compared Against Other Published Estimates
Published market sizes for heating equipment can look far apart even when they appear to describe the same scope, because the underlying scope and counting rules are not always aligned. Differences usually come from which product families are included, the choice of base year and currency timing, and how quickly technology substitution is assumed to occur.
Some external estimates bundle broader HVAC value, installation labor, and long-term service contracts into one total, which pushes the number up quickly when retrofit activity is strong. In Mordor Intelligence, the figure is limited to equipment revenue only, and it is built from region-level demand signals like building stock and replacement cycles, then checked with price and unit reality from interviews so inflation does not get double counted.
Benchmark comparison
| Source | Market Size | Gaps in Research Methodology |
|---|---|---|
| Mordor Intelligence | USD 45.14 B (2025) | |
| Global Consultancy A | USD 56.80 B (2025) | Uses a wider basket that mixes heating with adjacent HVAC categories and adds installation and service revenues, and then applies an aggressive retrofit uplift without clearly separating equipment ASP from labor inflation. |
| Industry Association B | USD 41.90 B (2025) | Leans on manufacturer shipment reporting from selected member countries and then extrapolates globally, which can undercount informal channels and imported units sold outside member reporting coverage. |
The table shows that most variance is explained by scope expansion on the high side and partial reporting coverage on the low side. By keeping the count tied to equipment only, and by forcing unit volume and ASP checks to match real installation and replacement behavior, the estimate stays traceable to clear drivers that can be repeated and updated each year.


Key Questions Answered in the Report
How large is the heating equipment market in 2026?
The heating equipment market size is USD 47.24 billion in 2026, with a forecast 5.32% CAGR through 2031.
Which equipment type is growing fastest?
Heat pumps are expanding at a 6.38% CAGR, benefitting from mandates and cold-climate technology advances.
Why are hydrogen-ready boilers gaining attention?
They let owners operate on natural gas today yet switch to up to 100% hydrogen when grids decarbonize, protecting long-term asset value.
What region shows the highest growth rate?
The Middle East and Africa region is projected for a 7.78% CAGR to 2031 as giga-projects specify solar-thermal-heat-pump hybrids.
What limits heat-pump adoption in urban areas?
Grid-capacity bottlenecks force utilities to upgrade transformers and feeders, delaying interconnection approvals and raising costs.
Page last updated on:






