
Healthcare Operational Analytics Market Size and Share
Market Overview
| Study Period | 2020 - 2031 |
|---|---|
| Market Size (2026) | USD 15.57 Billion |
| Market Size (2031) | USD 28.98 Billion |
| Growth Rate (2026 - 2031) | 13.22 % |
| Fastest Growing Market | Asia-Pacific |
| Largest Market | North America |
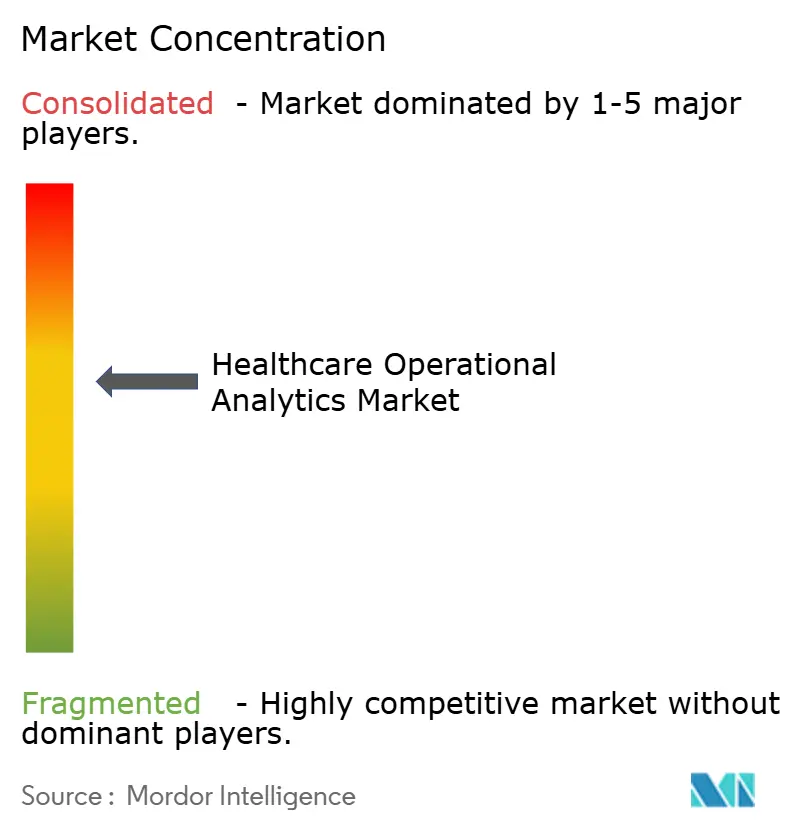
| Market Concentration | Medium |
Major Players *Disclaimer: Major Players sorted in no particular order Image © Mordor Intelligence. Reuse requires attribution under CC BY 4.0. | |
Healthcare Operational Analytics Market Analysis by Mordor Intelligence
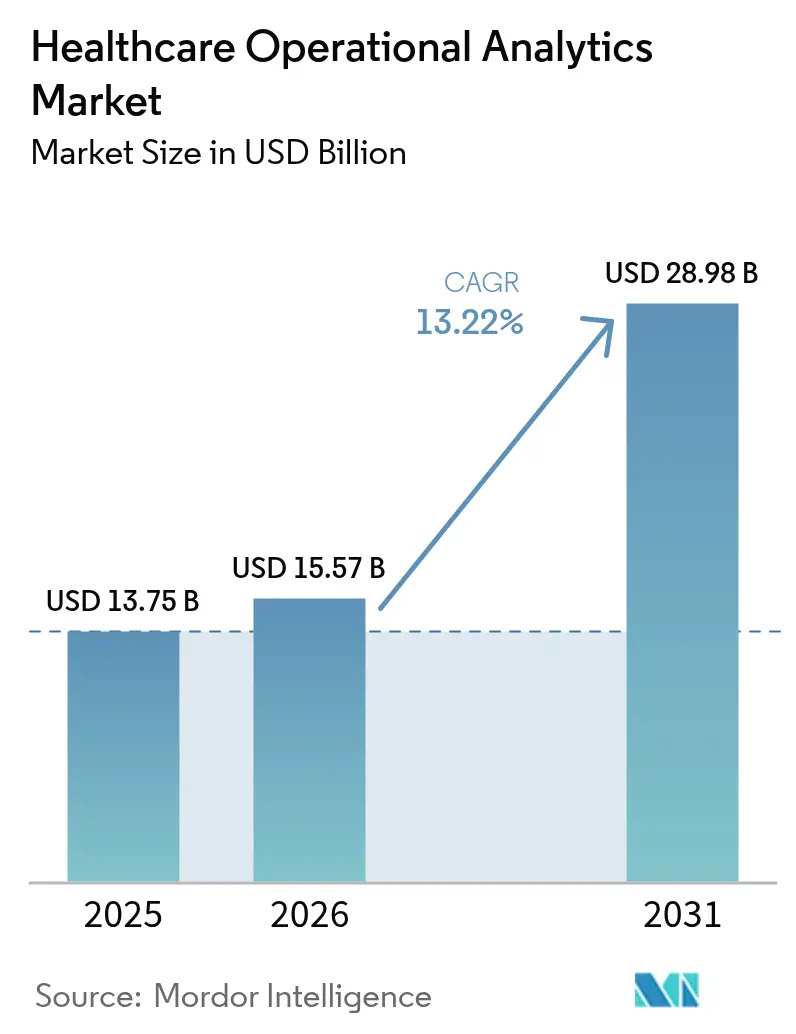
The healthcare operational analytics market size in 2026 is estimated at USD 15.57 billion, growing from 2025 value of USD 13.75 billion with 2031 projections showing USD 28.98 billion, growing at 13.22% CAGR over 2026-2031. Accelerated transition to value-based payment, surging volumes of electronic health-record data, and persistent cost-containment mandates keep adoption momentum high across payers and providers. Cloud-native platforms shorten deployment cycles, enabling real-time insights without large capital outlays, while workforce shortages heighten demand for predictive staffing tools that safeguard care quality despite lean clinical rosters. Vendors are broadening portfolios through M&A and strategic partnerships that embed artificial intelligence into everyday workflows, and venture capital is flowing toward Asia-Pacific start-ups that address foundational digital-health gaps. Taken together, these forces support sustained double-digit expansion of the healthcare operational analytics market through the end of the decade.
Key Report Takeaways
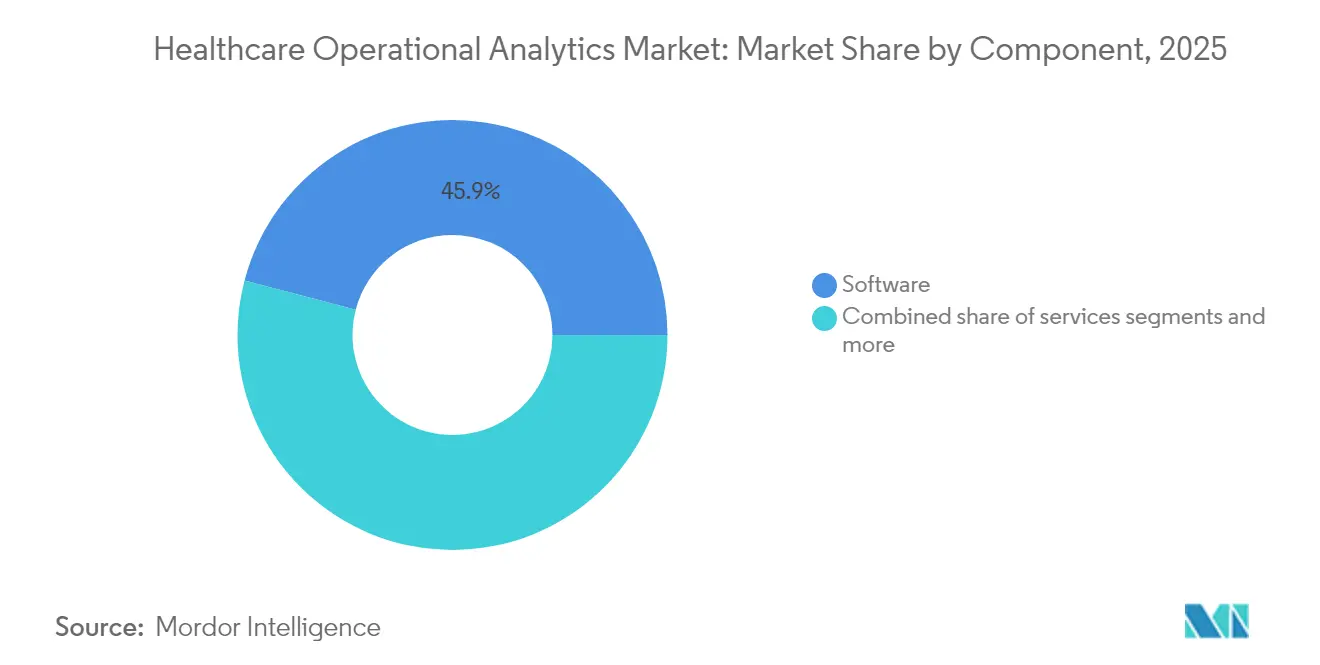
- By component, Software commanded 45.92% of the healthcare operational analytics market share in 2025; Services is projected to expand at a 14.05% CAGR through 2031.
- By deployment mode, Cloud-based platforms captured 56.78% of the healthcare operational analytics market size in 2025 and are advancing at a 13.41% CAGR to 2031.
- By application, Financial & Revenue-Cycle Management held 63.10% share of the healthcare operational analytics market size in 2025, whereas Workforce Management is tracking the fastest 13.78% CAGR through 2031.
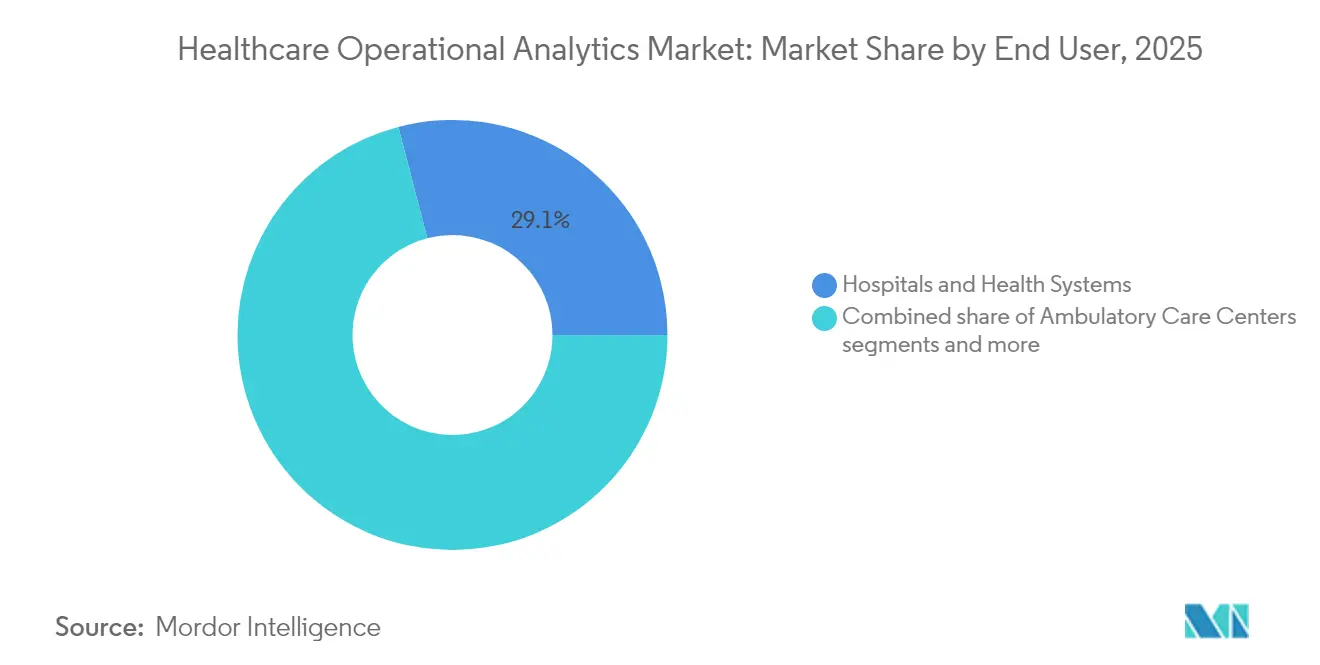
- By end user, Hospitals & Health Systems accounted for 29.05% of the healthcare operational analytics market share in 2025; Ambulatory Care Centers are growing at a 14.37% CAGR between 2026-2031.
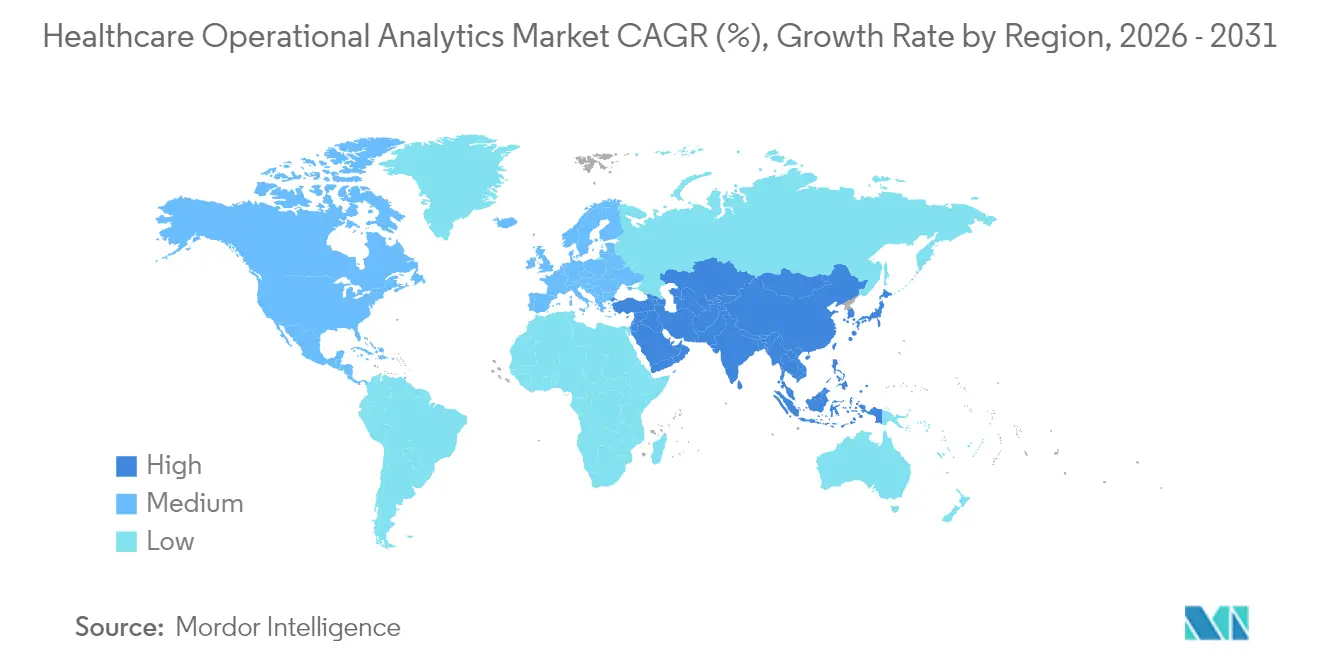
- By geography, North America led with 37.75% of the healthcare operational analytics market size in 2025, while Asia-Pacific is accelerating at a 13.92% CAGR to 2031.
Note: Market size and forecast figures in this report are generated using Mordor Intelligence’s proprietary estimation framework, updated with the latest available data and insights as of 2026.
Market Trends and Insights
Drivers Impact Analysis of Healthcare Operational Analytics Market*
| Driver | (~) % Impact on CAGR Forecast | Geographic Relevance | Impact Timeline |
|---|---|---|---|
| Value-based-care cost-containment push | +3.2% | North America & EU, expanding to APAC | Medium term (2-4 years) |
| Data deluge from EHR digitization | +2.8% | Global, with highest impact in North America | Short term (≤ 2 years) |
| Hospital efficiency needs amid staffing gaps | +2.5% | Global, acute in North America & EU | Short term (≤ 2 years) |
| Shift to cloud-native analytics platforms | +2.1% | Global, led by North America & EU | Medium term (2-4 years) |
| RTLS-enabled real-time throughput insights | +1.4% | North America & EU, emerging in APAC | Long term (≥ 4 years) |
| Predictive maintenance for equipment uptime | +1.0% | Global, concentrated in developed markets | Long term (≥ 4 years) |
| Source: Mordor Intelligence | |||
Value-based-care cost-containment push
Centers for Medicare & Medicaid Services finalized 97 quality measures for program year 2025, compelling providers to embed analytics into reimbursement workflows and strengthening the growth outlook for the healthcare operational analytics market [1]. Early adopters have reported savings of USD 45 million across five years after linking outcome dashboards to bundled-payment contracts. Financial incentives in the Medicare Shared Savings Program secure long-term demand irrespective of macroeconomic cycles [2]. As Medicare aims for universal value-based coverage by 2030, analytics platforms become infrastructure rather than optional upgrades. Competitive differentiation now hinges on the precision and timeliness of cost-quality insights delivered to clinical teams.
Data deluge from EHR digitization
Nearly half of the data stored in hospital systems remains unused for decision-making even though 95% of executives believe better use would raise clinician productivity. EHR adoption has created mixed data types-structured codes, unstructured notes, imaging metadata that exceed the capability of legacy business-intelligence tools. The healthcare operational analytics market responds with scalable machine-learning engines compliant with HIPAA and GDPR, unlocking value from long-tail clinical variables. Data-quality, provenance, and governance modules are bundled into modern solutions to reduce compliance workloads. As interoperability frameworks mature, cross-provider longitudinal datasets fuel population-health risk models that enhance preventive-care outreach.
Hospital efficiency needs amid staffing gaps
A projected shortage of 1.1 million nurses by 2030 is forcing hospitals to shift from reactive scheduling to predictive labor-management strategies. Mercy Health cut contingent labor spending by USD 30.7 million in 2023 after deploying AI scheduling that increased shift-fill rates to 86%. [3] Predictive census models using recent admission patterns achieve 3.7% forecast error, enabling just-in-time staffing and reducing overtime. Workflow engines integrated with the healthcare operational analytics market also guide float-pool redeployments, boosting nurse satisfaction and retention. Continuous monitoring of capacity, acuity, and skill mix aligns clinical resources with real-time demand, protecting margins in a flat reimbursement environment.
Shift to cloud-native analytics platforms
Healthcare organizations spend an average USD 38 million per year on cloud services yet consume only 44% of reserved capacity, leaving headroom to migrate analytics workloads without additional contracts. Public-cloud environments simplify high-performance compute access for deep-learning models, slashing hardware refresh cycles. Early Epic workloads on Amazon Web Services deliver higher satisfaction scores regarding scalability compared with on-premise installations. Federated delivery models distribute data-science sandboxes to clinical teams while central governance maintains security posture. Consistent patching and automated backups mitigate ransomware risk, a rising board-level concern.
Restraints Impact Analysis of Healthcare Operational Analytics Market*
| Restraint | (~) % Impact on CAGR Forecast | Geographic Relevance | Impact Timeline |
|---|---|---|---|
| High legacy integration costs | -2.1% | Global, most acute in North America & EU | Medium term (2-4 years) |
| Data-privacy & security compliance burden | -1.8% | Global, with varying regional requirements | Short term (≤ 2 years) |
| Operations-analytics talent shortage | -1.5% | Global, concentrated in developed markets | Long term (≥ 4 years) |
| Clinical-workflow disruption resistance | -1.2% | Global, cultural variations by region | Medium term (2-4 years) |
| Source: Mordor Intelligence | |||
High legacy integration costs
Case studies show multimillion-dollar variances when migrating historical data into new analytic environments, with scarce benchmarks for CIO planning. Parallel run periods inflate operating budgets and extend payback periods, causing some mid-tier hospitals to defer analytics upgrades that rely on modern EHR architectures. Vendors in the healthcare operational analytics market now package conversion accelerators using FHIR and bulk-export tooling to ease pain points, yet budgetary hesitation persists.
Data-privacy & security compliance burden
HIPAA fines range from USD 141 to over USD 2 million per incident, and the forthcoming EU AI Act classifies most clinical algorithms as high-risk applications. Hospitals must fund encryption, audit logging, and bias-monitoring processes before go-live, raising total cost of ownership. Smaller providers struggle with documentation overhead, slowing healthcare operational analytics market penetration until external managed-service options mature.
*Our forecasts treat driver/restraint impacts as directional, not additive. The impact forecasts reflect baseline growth, mix effects, and variable interactions.
Healthcare Operational Analytics Market Segment Analysis
By Component:
Services Drive Implementation SuccessServices revenue, though smaller than software, is poised to grow at a 14.05% CAGR because implementation expertise determines return on analytics investments. Hospital groups purchasing enterprise licenses often realize value only after consulting teams align dashboards with clinical workflows and build FHIR pipelines from ancillary systems. McKinsey found that holistic revenue-cycle automation programs combining leadership coaching, process redesign, and data-science support accelerate margin gains.
Software still represents 45.92% of the healthcare operational analytics market share due to embedded EHR modules and subscription contracts. However, consumption models now bundle managed services, blurring lines between license and support revenue. Hardware remains niche, limited to high-security edge appliances protecting imaging archives or military treatment facilities. Overall, the healthcare operational analytics market sees services as the catalyst for sustainable software usage and continuous-improvement cycles.

By Deployment Mode:
Cloud Dominance AcceleratesCloud deployments held 56.78% share of the healthcare operational analytics market in 2025 and post the fastest 13.41% CAGR through 2031. Organizations migrating Epic workloads reported smoother monthly update cycles and more predictable cost structures versus on-premise environments. Hybrid models persist where imaging archives or genomic datasets must remain on local servers, but containerization eases workload portability.
Cost optimization is the next frontier, with many health systems over-provisioned on reserved instances. Rightsizing initiatives unlock funds for advanced AI projects, reinforcing cloud momentum inside the healthcare operational analytics market. On-premise deployments survive primarily in single-facility hospitals or defense installations with strict data-sovereignty mandates.
By End User:
Ambulatory Care Centers Lead GrowthHospitals & Health Systems held 29.05% healthcare operational analytics market share in 2025 given their scale and mandated reporting. Ambulatory Care Centers expand fastest at 14.37% CAGR as outpatient procedure volume is forecast to rise 21% to 44 million cases by 2034.
ASC operators prioritize lightweight scheduling, implant cost-tracking, and payer-contract analytics delivered via cloud SaaS. Private-equity ownership promotes standardized dashboards across geographically dispersed sites, driving incremental demand within the healthcare operational analytics market. Payers also deploy self-service portals that allow physicians to monitor quality and cost metrics tied to bundled-payment incentives.
By Application:
Workforce Management Emerges as Growth LeaderFinancial & Revenue-Cycle Management continues to dominate with 63.10% healthcare operational analytics market size in 2025 as hospitals chase denial reduction and cash acceleration. Yet Workforce Management grows fastest at 13.78% CAGR, reflecting acute staffing shortages. AI scheduling engines raised nurse satisfaction scores by 12 points at one large academic center after empowering clinicians with self-service rosters.
Supply-Chain modules gain traction amid inflationary pressure on medical supplies, and Patient Care & Performance dashboards link sepsis alerts to operational capacity metrics. Risk & Compliance solutions monitor algorithm bias and safety events, becoming integral features rather than bolt-ons. These diverse applications broaden the healthcare operational analytics market addressable revenue.
Geography Analysis
North America Healthcare Operational Analytics Market
North America remains the largest region with 37.75% of healthcare operational analytics market size, benefiting from mature interoperability mandates. CMS rules linking payment to digital-quality reporting sustain purchasing even amid tight margins. However, integration costs and cyber-security spending absorb budgets, leading to selective feature rollouts instead of enterprise-wide deployments.
APAC Healthcare Operational Analytics Market
Asia-Pacific posts the highest 13.92% CAGR, catalyzed by demographic aging, rising consumer expectations, and government cloud-first strategies. The region’s digital-health market could unlock USD 100 billion in value by 2025, prompting hospitals to leapfrog legacy systems and install cloud analytics from day one. IDC forecasts 28.9% AI spending growth through 2027, with healthcare a top vertical.
EMEA and South America Healthcare Operational Analytics Market
Europe shows steady uptake as GDPR and soon-to-be-effective AI regulations elevate data-privacy governance. Providers invest in consent-management dashboards and zero-trust architectures. South America and Middle East & Africa represent emerging pockets where mobile penetration and public-sector funding begin to seed analytics pilot programs, expanding the global healthcare operational analytics market footprint.
Regulatory Landscape
Healthcare operational analytics vendors and adopters work under interoperability, privacy, and algorithm-governance requirements that shape data ingestion, reporting, and auditability. In the United States, ONC/ASTP certification-linked standards updates continue to drive technical refresh cycles, with the Standards Version Advancement Process (SVAP) enabling voluntary incorporation of newly approved standards beginning August 29, 2025, and ONC issuing Standards Bulletin 2026-1 in January 2026 to outline updates to USCDI and data element maturity. Separately, 45 CFR 170.215 codifies API standards and triggered an effective compliance shift on January 1, 2026 when certain older versions of US Core implementation guides and the SMART App Launch framework expired, requiring certified products (and their analytics integrations) to move to newer API baselines.
In Europe, cross-sector data rules increasingly determine how device and platform data can be accessed and reused for operational insight. The EU Data Act became applicable on September 12, 2025, establishing rules around access to and use of data generated by connected products, including medical and health devices, which increases the need for governed extraction, entitlement management, and standardized APIs in analytics deployments. Together, these standards and policy cycles keep global suppliers focused on ongoing compliance engineering, while also reducing friction for multi-source analytics when organizations align on interoperability and data-access mechanisms.
Value Chain Analysis
The healthcare operational analytics value chain starts with data generation across clinical care delivery (EHRs, ancillary systems, medical devices), administrative operations (workforce and scheduling platforms), and financial domains (billing, claims, revenue-cycle tools). It then moves through aggregation and normalization before reaching analytics and workflow layers. Interoperability standards and common data models, including HL7 FHIR and models such as OMOP and PCORnet, act as the translation backbone that enables dashboards, predictive tools, and AI to operate across historically siloed systems. Data integration and governance capabilities, including identity matching, terminology mapping, provenance, and audit logging, remain core upstream activities because they determine whether operational metrics such as throughput, utilization, denial drivers, and staffing needs are trusted enough to operationalize.
Midstream participants include cloud and data-platform providers, along with healthcare data exchange and supply-chain technology specialists that help unify procurement, logistics, and inventory signals with clinical demand. Platforms such as GHX and its ResilienciAI positioning, Veradigm supply-chain and data assets, and logistics visibility offerings such as UPS Healthcare Symphony support near-real-time status and standardized transactions that feed operational analytics use cases. Downstream, solutions are delivered via enterprise software and embedded EHR analytics modules, supported by implementation, managed services, and optimization partners that configure workflows, integrate FHIR-based pipelines, and maintain performance and security over time; this services layer is where many deployments convert analytics outputs into sustained operational process change.
Competitive Landscape
The healthcare operational analytics market exhibits moderate concentration. Epic increased its U.S. acute-care market share to 42.3% in 2024, far ahead of Oracle Health at 22.9% after client attrition. Epic’s integrated Cogito suite leverages a unified data model, while Oracle emphasizes voice-enabled workflows and embedded AI.
Philips deepens analytics reach via collaborations with Mass General Brigham to build real-time data ecosystems that fuse device telemetry with EHR feeds. Niche vendors focus on RTLS, predictive maintenance, and revenue-cycle automation. Black Book surveys show 96% of CFOs tracking automation tools for charge-capture accuracy.
Strategic M&A persists, illustrated by Oracle’s USD 28.4 billion Cerner deal that aims to create end-to-end cloud platforms yet risks integration setbacks. Private-equity roll-ups in ASC analytics target scheduling, supply chain, and clinician performance niches. Interoperability, user experience, and measurable ROI remain decisive purchase criteria for healthcare operational analytics market buyers.
Healthcare Operational Analytics Industry Leaders
-
Oracle Corporation (Cerner Corporation)
-
MERATIVE (IBM Watson)
-
Veradigm LLC (Allscripts Healthcare Solutions, Inc.)
-
McKesson Corporation
-
UnitedHealth Group Incorporated (OptumInsight)
- *Disclaimer: Major Players sorted in no particular order
Healthcare Operational Analytics Market Companies Covered in this Report
- Altera Digital Health
- Athenahealth
- GE HealthCare Technologies Inc.
- Health Catalyst
- Inovalon Holdings Inc.
- IBM
- Koninklijke Philips
- Mckesson
- MedeAnalytics
- Oracle
- Premier
- Qlik Tech International AB
- SAS Institute
- Siemens Healthineers
- TIBCO Software Inc.
- TransUnion LLC (Healthcare)
- UnitedHealth Group Incorporated (OptumInsight)
- Vizient
- Wolters Kluwer N.V. (Health)
Market Opportunities and Future Outlook
Interoperability-led modernization is creating whitespace for operational analytics built around standardized APIs and cross-organization exchange, rather than one-off, interface-heavy integrations. ONC/ASTP standards updates, including the SVAP cycle beginning August 29, 2025, and the January 2026 Standards Bulletin 2026-1, plus the January 1, 2026 expiration of certain older API standard versions under 45 CFR 170.215, push providers and vendors to refresh FHIR and SMART-based connectivity. This provides a practical trigger for replacing brittle data pipelines and for adding governance, auditability, and reusable data products. Evidence from the broader standards ecosystem also points to institutionalization of FHIR adoption, with Firely’s 2026 State of FHIR reporting government agencies as leading adopters, which supports opportunities for operational analytics vendors to package compliance-ready connectors, reusable data models, and metrics reporting templates across payer, provider, and public-sector use cases.
Workflow-embedded operational command capabilities represent another active opportunity area as vendors move beyond retrospective dashboards into tools that sit inside daily staffing, scheduling, capacity, and perioperative operations. Epic has been rolling out EpicOps as an enterprise resource planning suite to unify financial, operational, and clinical data within the EHR architecture, and Oracle expanded OR-focused analytics via an AI partnership with Theator, signaling competitive investment in operational signal capture at the point of work. In parallel, expansion programs by large care providers, such as Max Healthcare announcing INR 6,000 crore capex to add 3,500 beds by FY30, underscore the need for scalable capacity planning, productivity analytics, and supply-chain coordination across multi-site growth, particularly in fast-digitizing Asia-Pacific systems where cloud-first deployments can standardize operations across new facilities from day one.
Recent Industry Developments in Healthcare Operational Analytics Market
- June 2026: Oracle partnered with Theator to integrate AI-enabled operating room analytics and surgical documentation capabilities into Oracle Health. The collaboration extends operational analytics deeper into perioperative workflows, a high-cost, throughput-sensitive area where real-time insights can affect utilization and care-team coordination.
- August 2025: Oracle introduced an AI-driven ambulatory EHR for US providers with voice-enabled capabilities and embedded intelligence for workflow automation. By tightening the link between documentation, scheduling, and operational data capture, the release reinforces the foundation for downstream operational analytics without relying on separate point solutions.
- February 2024: Veradigm agreed to acquire ScienceIO to incorporate an AI platform across its provider, payer, and life sciences offerings. The combination aims to improve the structuring of unstructured clinical data, which supports operational and performance analytics built on real-world data.
Healthcare Operational Analytics Market Report Scope and Research Methodology
Market Definition and Coverage
This market covers revenue earned from operational analytics used by healthcare organizations to improve day-to-day operations, such as patient flow, staffing, supply chain, and performance monitoring, across software, related services, and supporting hardware.
Scope exclusions: Pure clinical diagnostics analytics and life sciences R&D analytics are excluded when they are sold for research and drug development use cases rather than provider operations.
Segments Covered in This Report
- By Component
- Software
- Hardware
- Services
- By Deployment Mode
- Cloud-based
- On-premise
- Hybrid
- By Application
- Supply Chain & Inventory Management
- Workforce Management
- Financial & Revenue-Cycle Management
- Patient Care & Performance Management
- Risk & Compliance Management
- Others
- By End User
- Hospitals & Health Systems
- Payers
- Ambulatory Care Centers
- Others
- By Geography
- North America
- United States
- Canada
- Mexico
- Europe
- Germany
- United Kingdom
- France
- Italy
- Spain
- Rest of Europe
- Asia-Pacific
- China
- India
- Japan
- South Korea
- Australia
- Rest of Asia-Pacific
- South America
- Brazil
- Argentina
- Rest of South America
- Middle East and Africa
- GCC
- South Africa
- Rest of Middle East and Africa
- North America
Data Sources, Market Sizing, and Validation
Desk Research
We first mapped the operational analytics ecosystem using public healthcare digitization and utilization signals, and then aligned those signals to what is monetized as operational analytics. Key sources included the World Health Organization (Global Health Expenditure Database), OECD Health Statistics, the World Bank, national health agencies that publish hospital capacity and workforce statistics, and regulator portals that track health IT and data governance updates.
To translate demand signals into spend, we reviewed company annual reports, earnings decks, product literature, and implementation announcements, which helped confirm what is typically sold as software, services, and supporting infrastructure. We also used a paid subscription for company financials and intelligence, plus a paid patent database, to sanity check product direction and pricing bands when public disclosure was limited. These desk sources are illustrative, and additional public and internal references were used for data collection, validation, and clarification.
Primary Interviews and Surveys
Our primary work was used to pressure test the model assumptions with supply-side and demand-side experts, including product and delivery leaders, hospital operations teams, and system integrators, across the Americas, EMEA, and APAC. Interviews helped confirm typical deal structures, adoption barriers, cloud migration pace, and what portion of analytics budgets is tied to operational use cases, and then the resulting figures were reconciled back to the desk research signals.
Distribution of primary research fieldwork respondents
| Company type | Respondent position | Region |
|---|---|---|
| Top tier: 31% | CXOs: 14% | APAC: 51% |
| Mid tier: 51% | Functional/Unit leaders: 29% | EMEA: 30% |
| Smaller Players: 18% | Managers: 57% | Americas: 19% |
Market-Sizing & Forecasting
Sizing starts from a top-down demand pool build that reconstructs likely operational analytics spend from healthcare delivery activity, digital maturity, and budget allocation patterns by region. We use country-level healthcare expenditure, hospital and bed counts, workforce intensity, and digitization indicators as anchor series, then apply operational analytics adoption and spend intensity assumptions that were refined through expert feedback.
Those totals are corroborated with selective bottom-up checks, where sampled pricing and contract values are multiplied by estimated customer counts for key buyer groups, then adjusted for service attachment and hardware needs where relevant. When direct revenue visibility is limited, gaps are handled using proxy indicators such as EHR penetration, cloud adoption in provider IT, and the pace of value-based care programs, since these tend to move operational analytics demand in a measurable way.
For forecasting, we use scenario analysis supported by inputs like provider cost pressure, staffing shortages, patient volume recovery patterns, and the speed of cloud-based deployments. Assumptions are reviewed with interviewees so the forward view remains practical, not just a straight-line extension of history.
Data Validation & Update Cycle
We triangulate every major output against independent signals, and variance checks are run at the region level and at global totals to catch outliers early. If a metric shifts too far from expected ranges, the underlying inputs are rechecked, and follow-up conversations are triggered to confirm whether the change reflects market movement or an assumption error.
Before sign-off, the model and narrative go through multi-step analyst reviews, and key calculations are re-performed to ensure they can be repeated. The report is refreshed annually, and interim updates are made when material events shift demand, pricing, or regulation, followed by a final pre-delivery review so clients receive the most current view.
Mordor Intelligence's Global Healthcare Operational Analytics Market Market Size Versus Other Published Estimates
Published market sizes for healthcare operational analytics often do not match, even when the topic name sounds similar, because the included end users, the component mix, and the handling of year and currency differ across studies. Variation also comes from how each model treats services, hardware, and cross-over analytics use cases that sit close to day-to-day operations.
Hardware like servers, storage, and networking is counted only when it is tied to operational analytics deployments, and that item sits inside Mordor Intelligence's scope. This is why some software-only estimates land lower even in the same year.
Benchmark comparison
| Source | Market Size | Gaps in Research Methodology |
|---|---|---|
| Mordor Intelligence | USD 15.57 B (2026) | |
| Global Market Publisher A | USD 14.80 B (2024) | Uses a factory-gate style value concept and a different base year, and it can pull totals upward by counting a broader set of related goods sold alongside services. |
| Industry Portal B | USD 16.20 B (2024) | Uses a longer forecast window with a 2024 base and may apply higher broad adoption assumptions across end users beyond hospitals, which can raise the starting point versus a tighter operational-use validation step. |
Across the three figures, most of the spread is explained by base-year selection and what is bundled into the revenue pool, especially around hardware and services attachment. By keeping inputs tied to observable provider activity and then rechecking adoption and spend intensity through interviews, the resulting number stays traceable to clear drivers and can be replicated as assumptions change.
Key Questions Answered in the Report
What is the projected value of the healthcare operational analytics market by 2031?
The market is forecast to reach USD 28.98 billion by 2031.
How fast is the healthcare operational analytics market expected to grow?
It is projected to expand at a 13.22% CAGR between 2026 and 2031.
Which deployment model leads adoption in healthcare analytics?
Cloud-based platforms held 56.78% share in 2025 and show the fastest growth to 2031.
Why are ambulatory care centers investing heavily in analytics?
Procedure migration to outpatient settings and the need for cost-efficient scheduling drive a 14.37% CAGR in analytics adoption among ASCs.
What is the biggest restraint on analytics adoption for hospitals?
High integration costs when linking modern analytics tools with legacy EHR systems remain the primary hurdle.