Market Overview
| Study Period | 2020 - 2031 |
|---|---|
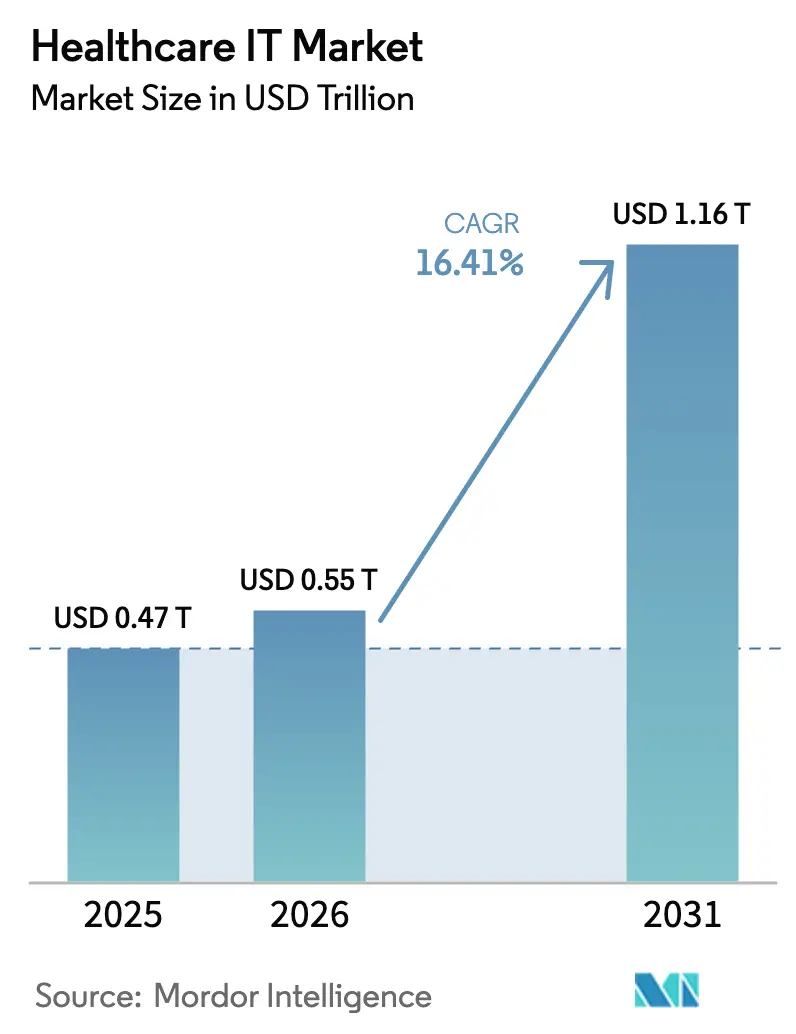
| Market Size (2026) | USD 0.55 Trillion |
| Market Size (2031) | USD 1.16 Trillion |
| Growth Rate (2026 - 2031) | 16.41% CAGR |
| Fastest Growing Market | Asia Pacific |
| Largest Market | North America |
| Market Concentration | High |
Major Players *Disclaimer: Major Players sorted in no particular order Image © Mordor Intelligence. Reuse requires attribution under CC BY 4.0. | |
Healthcare IT Market Analysis by Mordor Intelligence
The Healthcare IT Market size is expected to increase from USD 0.47 trillion in 2025 to USD 0.55 trillion in 2026 and reach USD 1.16 trillion by 2031, growing at a CAGR of 16.41% over 2026-2031.
Current momentum stems from mandatory interoperability rules, replacement of on-premises stacks with cloud-native architectures, and rapid infusion of artificial intelligence into both clinical and revenue-cycle workflows.[1]U.S. Department of Health and Human Services Office of the National Coordinator for Health IT, “HHS Proposes HTI-5 Rule to Streamline Certification Program, Further Protect Patients from Information Blocking, and Foster an Artificial Intelligence-Enabled Future,” HealthIT.gov, healthit.govClinical platforms account for nearly half of sector revenue as hospitals emphasize population-health analytics and AI-assisted diagnosis. Managed integration services gain traction because payers, providers, and life-science firms must re-architect data pipelines on compressed timelines. Cloud hyperscalers undercut traditional vendors by bundling elastic compute, analytics, and AI toolkits, while ransomware events expose security gaps that accelerate spending on decentralized architectures and zero-trust frameworks. Regional growth disparities persist, with Asia-Pacific outpacing mature markets as national digital-health missions in China and India mandate province-level exchanges and universal health IDs.[2]Press Information Bureau, Government of India, “Towards Universal Healthcare: Ayushman Bharat Pradhan Mantri Jan Arogya Yojana,” Press Information Bureau, static.pib.gov.in
Key Report Takeaways
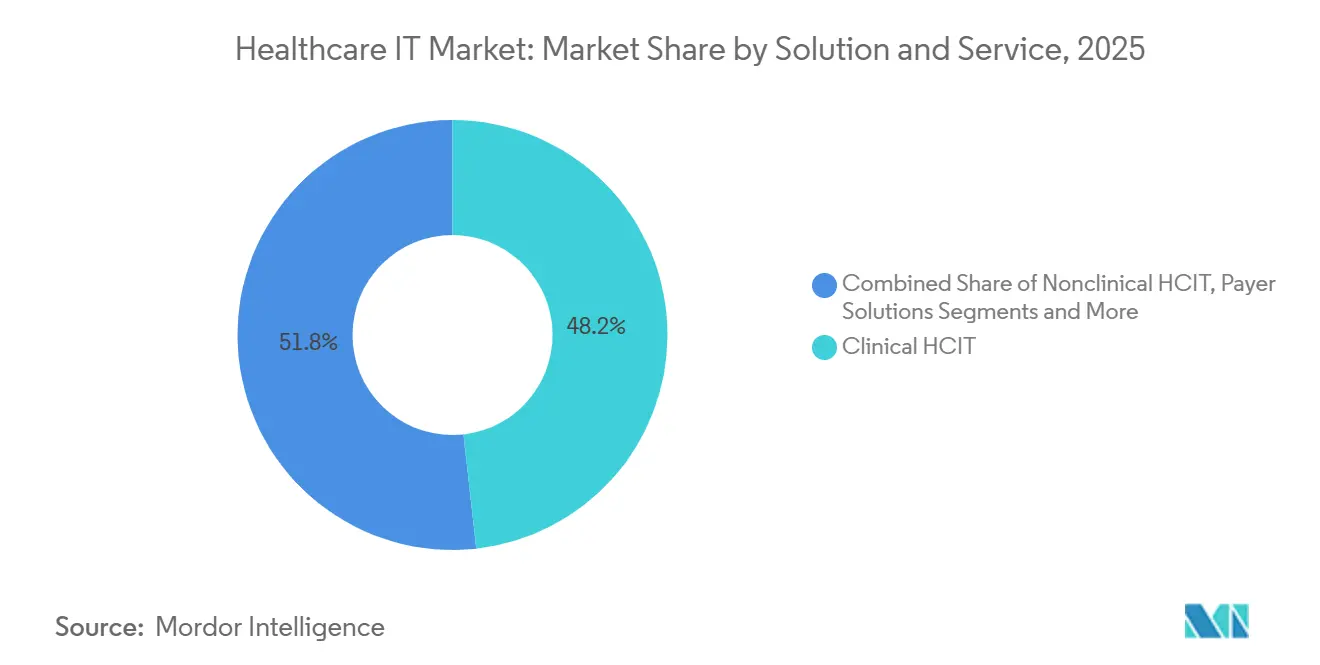
- By solution, clinical HCIT held 48.23% of healthcare IT market share in 2025 and is forecast to expand at an 18.34% CAGR through 2031.
- By component, services captured 41.81% share of the healthcare IT market size in 2025; software is projected to grow at 19.43% through 2031.
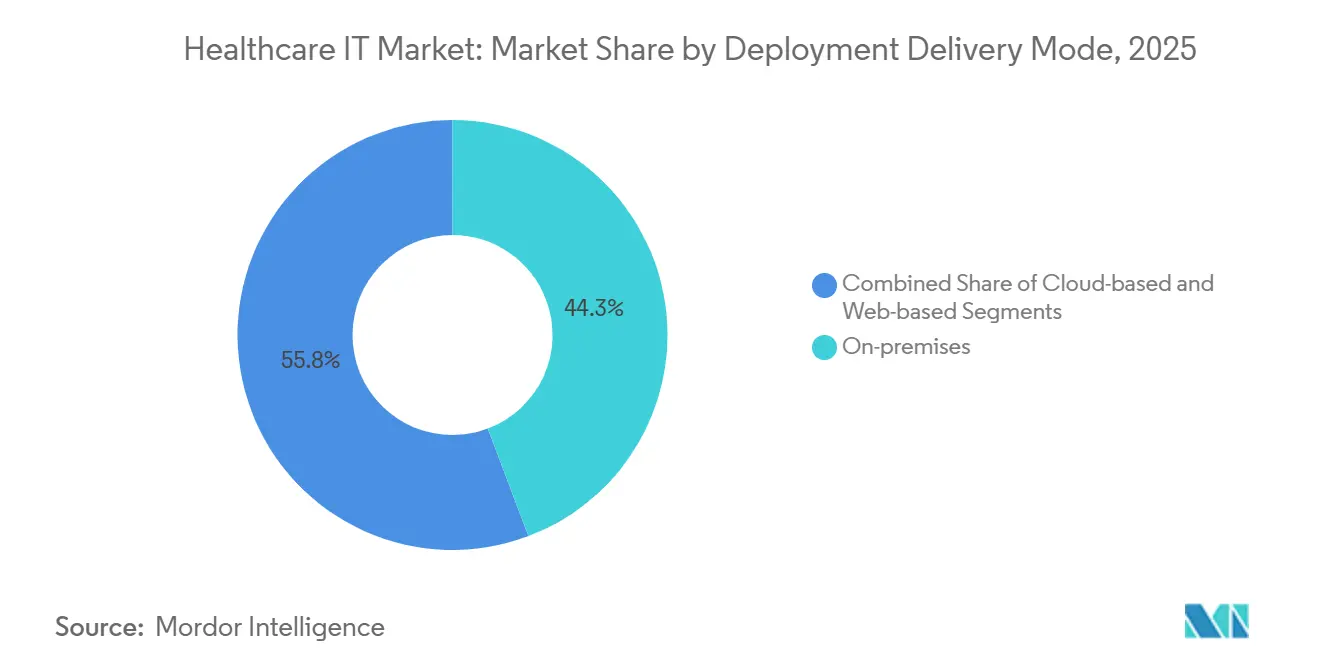
- By deployment, cloud delivery advanced at a 17.32% CAGR between 2026 and 2031, whereas on-premises still represented 44.25% of the revenue share in 2025.
- By end user, providers commanded 63.40% of healthcare IT market share in 2025 and are expected to rise at 16.66% through 2031.
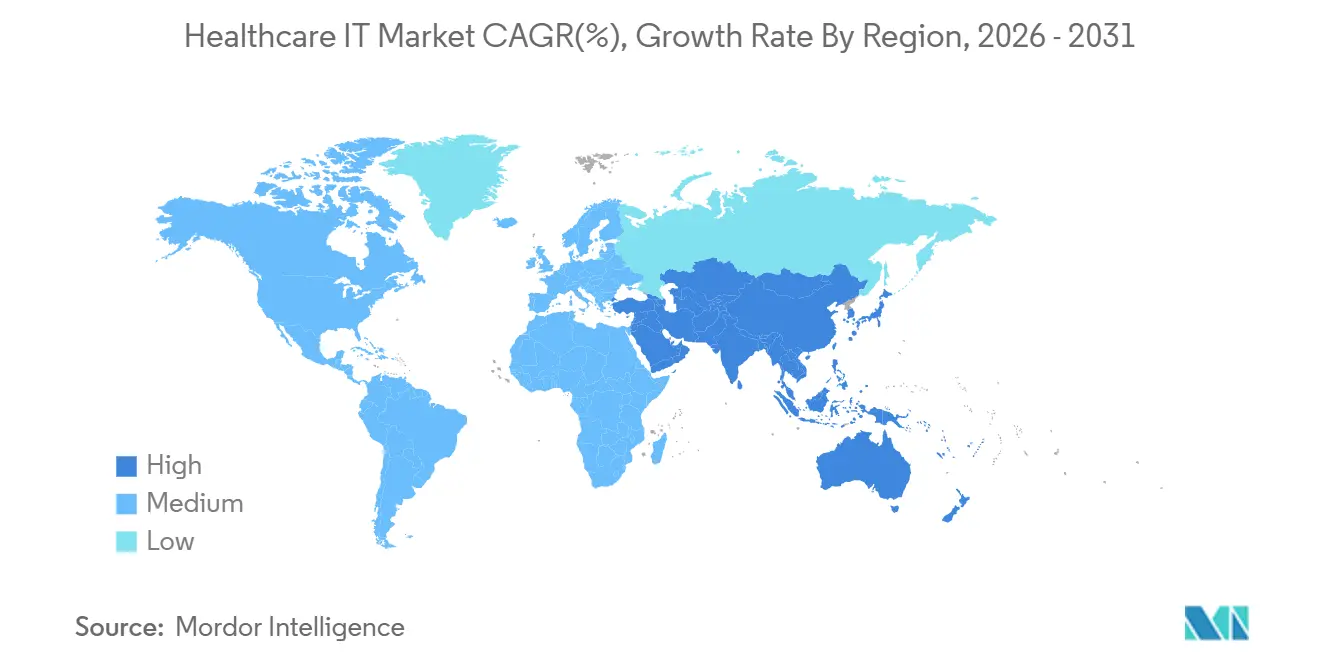
- By geography, Asia-Pacific is set to record the fastest 17.81% CAGR to 2031, while North America retained 46.77% revenue share in 2025.
Note: Market size and forecast figures in this report are generated using Mordor Intelligence’s proprietary estimation framework, updated with the latest available data and insights as of January 2026.
Global Healthcare IT Market Trends and Insights
Driver Impact Analysis
| Driver | (~) % Impact on CAGR Forecast | Geographic Relevance | Impact Timeline |
|---|---|---|---|
| Regulatory interoperability mandates | +2.8% | North America, Europe | Short term (≤ 2 years) |
| Cloud migration and SaaS adoption | +3.2% | Global | Medium term (2-4 years) |
| Shift to value-based care and analytics-driven RCM | +2.5% | North America, APAC, Europe | Medium term (2-4 years) |
| Telehealth, RPM, and digital-front-door scale-up | +2.1% | Global | Short term (≤ 2 years) |
| AI/ML deployment across workflows | +3.4% | North America, Europe, APAC | Long term (≥ 4 years) |
| Data monetization and real-world evidence use | +1.9% | North America, Europe, APAC | Long term (≥ 4 years) |
| Source: Mordor Intelligence | |||
Regulatory Interoperability Mandates
The Trusted Exchange Framework and Common Agreement, finalized in December 2024, obliges qualified health-information networks to support HL7 FHIR APIs by July 2025. The rule removes proprietary data blocking that once cost providers USD 8.3 billion each year in manual reconciliation. Twenty-three U.S. states codified similar laws for Medicaid managed-care plans during 2024, raising the compliance floor for vendors. CMS will require payers to answer urgent prior-authorization requests within 72 hours beginning January 2026, which benefits platform vendors that embed real-time eligibility checks. Suppliers dependent on batch EDI transactions now face margin pressure as penalties grow for delays.[3]Centers for Medicare & Medicaid Services, “Prior Authorization API FAQ,” Centers for Medicare & Medicaid Services, cms.gov
Cloud Migration and SaaS Adoption Across Provider and Payer IT
Public-cloud infrastructure processed more than 40% of electronic-health-record workloads in 2024, up from 28% in 2022, as hospitals sought elastic compute for AI training and disaster recovery at lower cost. AWS HealthLake handled over 2 billion clinical records in 2024, while Microsoft combined Nuance’s ambient-documentation engine with Teams-based telehealth to reduce physician paperwork by two hours per day in a 2024 multi-site study. Cloud lock-in risk persists because some vendors bundle proprietary middleware with EHR upgrades, raising exit costs for customers.
AI/ML Deployment Across Clinical and Administrative Workflows
The FDA cleared 171 AI-enabled devices in 2024, 34% more than 2023, spanning sepsis alerts, diabetic-retinopathy screening, and atrial-fibrillation detection. Epic embedded a sepsis risk module that flagged deterioration six hours earlier than legacy scores and lowered mortality by 18% in Kaiser Permanente validation. Administrative AI scales faster: revenue-cycle bots lower claim-denial rates by 22% and shorten cash-collection cycles by 11 days, as reported by hospitals using automation suites. The FDA’s January 2025 AI Action Plan introduced a predetermined-change pathway, allowing algorithm updates without a new 510(k) if performance bounds are pre-defined, which accelerates deployment but forces providers to establish governance committees for ongoing validation.
Telehealth, RPM, and Digital Front-Door Integration at Scale
CMS extended telehealth payment parity through December 2025, sustaining reimbursement for audio-only visits and RPM for chronic-care management. Teladoc recorded 18.3 million virtual visits in Q3 2024, buoyed by mental-health demand. Global RPM device shipments reached 42 million units in 2024, led by continuous-glucose monitors and blood-pressure cuffs, according to the Consumer Technology Association. Adoption remains uneven because just 38% of commercial payers reimburse RPM at Medicare-equivalent rates. Epic’s MyChart processed 1.4 billion patient interactions in 2024, cutting call-center volume by 30% through integrated scheduling, telehealth, and refill workflows.
Restraints Impact Analysis
| Restraint | (~) % Impact on CAGR Forecast | Geographic Relevance | Impact Timeline |
|---|---|---|---|
| Escalating data-privacy and cyber-risk costs | -1.8% | Global | Short term (≤ 2 years) |
| Integration complexity and vendor lock-in | -1.4% | Global | Medium term (2-4 years) |
| Shortage of skilled health-IT talent | -1.2% | Global | Long term (≥ 4 years) |
| Uncertain generative-AI oversight and validation burden | -0.9% | North America, Europe | Medium term (2-4 years) |
| Source: Mordor Intelligence | |||
Escalating Data Privacy, Cyber Risk, and Compliance Costs
A February 2024 ransomware strike on Change Healthcare encrypted claims systems for 900,000 providers and exposed records for over 100 million individuals, triggering the largest HIPAA breach notification to date. UnitedHealth booked USD 2.3 billion in remediation and revenue loss during 2024. Cyber-insurance premiums for hospitals rose 47% in 2024, and carriers now require multi-factor authentication, endpoint detection, and annual penetration testing, raising average security budgets by USD 1.8 million per facility. Multinational vendors must also comply with GDPR fines of up to 4% of their global revenue and China’s local data residency rules, which can lead to infrastructure duplication and delay product rollouts.
Integration Complexity and Vendor Lock-In
Hospitals juggle an average of 16 clinical and administrative systems, and 62% still rely on manual re-entry when data fail to flow across those tools. Dominant EHRs such as Epic occupy more than 300 large U.S. hospitals, creating network effects that discourage migrations because physicians are deeply trained on Epic shortcuts, and third-party apps optimize for its proprietary marketplace rather than open FHIR workflows. When organizations attempt a switch, consulting fees and retraining can push total project costs past USD 40 million for a single academic medical center, extending payback periods beyond five years. Cloud refactoring offers only partial relief: Oracle’s Cerner Millennium, for instance, requires customers to adopt Oracle database and middleware licenses, raising long-term operating expenses even as it eliminates local servers. Persistent semantic gaps—such as mismatches in hypertension codes between SNOMED CT and ICD-10—mean that revenue-cycle teams must still maintain manual crosswalks, which delays claims by several days and blunts the speed advantages promised by modern APIs.
Healthcare IT Market - Segment Analysis
By Solution & Service: Clinical HCIT Dominates Amid AI Integration
Clinical HCIT solutions commanded 48.23% healthcare IT market share in 2025 and are expected to grow at an 18.34% CAGR to 2031. EHR platforms from Epic, Oracle Health, and Meditech covered 78% of U.S. hospital beds in 2024, illustrating entrenched demand for integrated clinical systems. Telehealth surged after CMS preserved reimbursement parity, enabling vendors to sustain visit volumes across behavioral health, chronic-disease management, and urgent care. Imaging vendors re-platformed picture-archiving and communication systems onto cloud stacks to leverage AI auto-segmentation and lower storage costs. Population-health tools gained traction as accountable-care contracts reached 43 million covered lives in 2024.
Nonclinical HCIT expands more slowly because hospitals defer back-office upgrades when margins tighten. Yet revenue-cycle automation trims denial rates by up to 22%, keeping the sub-segment attractive to private-equity investors. Payer platforms benefit from new prior-authorization turnaround requirements beginning in 2026, while life-science IT grows fastest as FDA guidance mandates real-world-evidence submissions in 30% of new drug applications by 2027. Outsourcing and managed-services capture 19% of total spending as providers offload legacy infrastructure to global systems integrators.

By Component: Software Overtakes Services on SaaS Momentum
Services retained 41.81% share in 2025, reflecting labor-intensive migration projects, yet software is posting a 19.43% growth rate as subscription models replace perpetual licenses. Epic shifted 40% of clients to hosted EHRs by mid-2024, bundling upgrades and support into annual fees that lower five-year total cost of ownership by 12%. SaaS revenue-cycle suites such as athenaClinicals gained market traction with usage-based pricing that removes upfront capital needs. Hardware sales decline as providers shutter data centers and move imaging archives, backups, and analytic sandboxes into AWS, Azure, and Google Cloud environments.
The HL7 FHIR mandate within TEFCA compels vendors to publish open APIs, splintering once-monolithic EHRs into best-of-breed ecosystems and accelerating third-party app growth. Services remain essential for complex migrations; large academic centers can spend USD 40 million on consulting during an EHR replacement, reinforcing the need for hybrid expertise across clinical workflows and cloud DevOps.
By Deployment/Delivery Mode: Cloud Gains Despite On-Premises Inertia
On-premises deployments still accounted for 44.25% of the installed base in 2025 due to latency-sensitive surgical and critical-care applications. Cloud delivery is the fastest-growing mode, advancing at 17.32% as hospitals seek elasticity for AI training and stronger disaster-recovery postures. AWS HealthLake processed more than 2 billion FHIR-formatted records in 2024, while Microsoft’s Teams-Nuance bundle rolled out to 120 health-systems by late 2024. Web-based thin-client platforms dominate smaller ambulatory and post-acute facilities because they fit low-budget, minimal-IT environments; athenaClinicals grew to 160,000 providers in 2024 using encounter-based pricing.
Hybrid strategies proliferate. Epic’s Community Connect hosts core EHR services in its data centers while retaining local interfaces for emergency department and operating room workflows, offering a bridge for cautious CIOs. Imaging archives head to the cloud first—52% of PACS workloads were on hyperscalers in 2024—whereas core transactional databases linger on-premises amid concerns about uptime.
By End User: Providers Lead, Life Sciences Accelerates
Providers made up 63.40% of healthcare IT market spending in 2025 and are set to grow at 16.66% through 2031. Hospitals remain the primary buyers, driven by CMS rules linking reimbursement to interoperability and prior-authorization response times. Ambulatory surgery centers adopted cloud EHRs at a 31% clip in 2024 as subscription prices align with fluctuating procedure volumes. Diagnostic imaging centers migrated more than half of their PACS workloads to the public cloud, leveraging AI tools to reduce radiologist read time by 23%.
Payers scale claim-processing platforms to meet the 72-hour turnaround mandate effective in 2026, despite a major ransomware disruption to clearinghouse workflows. Life-science organizations are the fastest-growing end-user cohort. IQVIA supported 8,200 clinical trials in 2024 through its eClinical suite, illustrating rising demand for real-world evidence ingestion and analytics.
Geography Analysis
North America held 46.77% of 2025 revenue, buoyed by Medicare Advantage enrollment exceeding half of beneficiaries and CMS policies tying physician payments to interoperability metrics. The TEFCA mandate requires HL7 FHIR Release 4 APIs by mid-2025, spurring integration spending across health-information networks. Canada earmarked CAD 2.1 billion (USD 1.55 billion) in 2024 for provincial EHR upgrades, while Mexico launched a nationwide EHR pilot covering 12 million beneficiaries, aiming for full deployment by 2027.
Asia-Pacific is the fastest-growing region with a 17.81% CAGR, led by China’s Healthy China 2030 drive and India’s Ayushman Bharat Digital Mission, which enrolled more than 500 million citizens in unique health IDs by late 2024. China’s national policy required all tertiary hospitals to run electronic medical records by December 2024, sparking new contracts for international and domestic vendors. Japan invested JPY 450 billion (USD 3.1 billion) in 2024 to merge My Number Cards with insurance claims, and South Korea’s health-insurance agency deployed AI claims-adjudication to spot fraudulent billing worth KRW 1.2 trillion (USD 900 million) yearly.
Europe benefits from the European Health Data Space regulation that mandates cross-border EHR access by 2025 under GDPR-aligned consent rules. Germany is rolling out biometric health cards, France enrolled 38 million citizens in its Mon Espace Santé portal, and the United Kingdom is centralizing data from 42 integrated-care systems into a federated analytics platform. The Middle East, Africa, and South America trail in absolute spending yet display niche surges: the UAE mandated EHR interoperability for all hospitals by December 2024, and Brazil’s Conecte SUS enrolled 160 million citizens in a national health ID by late 2024.
Competitive Landscape
The healthcare IT market is moderately concentrated. The top ten vendors earned about half of the 2024 revenue, leaving room for niche specialists. Epic and Oracle Health defend hospital EHR franchises by integrating telehealth, revenue cycle, and decision support into single-vendor suites, deepening customer lock-in. Hyperscalers—AWS, Microsoft Azure, and Google Cloud—bundle low-cost compute with AI services, allowing hospitals to layer analytics on top of legacy EHRs without requiring full replacement. Redox connects 4,200 provider organizations to 180 applications via open FHIR APIs, highlighting the shift from monoliths to micro-services.
Technology edge now hinges on validated AI pipelines and zero-trust security. Vendors that document model boundaries, perform bias checks, and conduct ongoing performance monitoring qualify for the FDA’s predetermined change control pathway, thereby building provider confidence. The 2024 ransomware crisis at Change Healthcare, which cost UnitedHealth $2.3 billion in direct and indirect losses, prompted payers to explore blockchain-anchored claim workflows that eliminate single points of failure.
Healthcare IT Industry Leaders
Epic Systems Corporation
Oracle Health
MEDITECH
Optum
Koninklijke Philips N.V.
- *Disclaimer: Major Players sorted in no particular order


Recent Industry Developments
- November 2025: Veradigm enhanced its AI-powered Ambient Scribe solution for Veradigm EHR, aiming to streamline clinical documentation and bolster decision support.
- October 2025: Nabla launched Nabla Connect, a plug-and-play ambient-AI module that allows EHR vendors to embed advanced voice technology without heavy engineering lift.
- August 2025: Oracle released a modern Oracle Health EHR for ambulatory providers, adding conversational AI to improve care quality.
- April 2025: DocNow introduced DocNow Telehealth, a Zoom-powered platform tailored to skilled nursing, long-term care, and home health settings.


Research Methodology Framework and Report Scope
Market Definitions and Key Coverage
Our study treats the global healthcare IT market as the total annual spend on software, connected hardware, and associated professional services that enable healthcare providers and payers to capture, store, exchange, analyze, and safeguard clinical as well as administrative data across care delivery, financial, and patient engagement workflows. Systems covered span electronic health records, imaging informatics, revenue cycle and supply chain suites, telehealth platforms, population health tools, cybersecurity layers, and payer claims engines.
Scope Exclusions: Stand-alone consumer wellness apps that do not interface with regulated medical systems lie outside this scope.
Segmentation Overview
- By Application
- Electronic Health Records (EHR)
- Picture Archiving & Communication Systems (PACS)
- Medical Imaging Information Systems (RIS)
- Laboratory Information Systems (LIS)
- Computerized Physician Order Entry (CPOE)
- Clinical Decision Support Systems (CDSS)
- Telehealth Solutions
- Remote Patient Monitoring
- Revenue Cycle Management (RCM)
- Pharmacy Information Systems (PIS)
- Clinical Information systems
- Digital Healthcare Supply chain management systems
- Customer Relationship Management (CRM)
- Healthcare Payer Solutions
- Fraud Detection & Payment Integrity
- Others
- By Component
- Software
- Hardware
- Services
- By Delivery Mode
- On-Premise
- Cloud-Based
- By End-User
- Hospitals & Health Systems
- Diagnostic & Imaging Centers
- Others
- Geography
- North America
- United States
- Canada
- Mexico
- Europe
- Germany
- United Kingdom
- France
- Italy
- Spain
- Rest of Europe
- Asia-Pacific
- China
- Japan
- India
- Australia
- South Korea
- Rest of Asia-Pacific
- Middle East and Africa
- GCC
- South Africa
- Rest of Middle East and Africa
- South America
- Brazil
- Argentina
- Rest of South America
- North America
Detailed Research Methodology and Data Validation
Primary Research
Mordor analysts held structured interviews and surveys with hospital CIOs, payer IT leads, regional system integrators, and health tech academics across North America, Europe, Asia Pacific, and the Gulf. These conversations confirmed adoption curves, average selling prices, and localization hurdles; they also anchored scenario probabilities that pure desk work could not surface.
Desk Research
We extracted baseline volumes, price bands, and utilization ratios from open sources such as the OECD Health Statistics, Centers for Medicare & Medicaid Services (National Health Expenditure files), Eurostat e-Health survey tabs, WHO Global Observatory reports, and trade association briefs from HIMSS and the Digital Health Alliance. Company 10-Ks, vendor price lists, tender portals, and peer-reviewed journals complemented those datasets. Select paid portals, D&B Hoovers for vendor financials and Dow Jones Factiva for transaction scans, helped cross-check revenue splits. The sources cited above are illustrative; many additional repositories informed data gathering, validation, and clarification.
Market Sizing & Forecasting
A top down and bottom up blend was applied. We first reconstructed global IT outlays from national health spending pools, applying historical IT intensity ratios and vendor reported bookings; results were then stress tested against sampled supplier roll ups and channel checks. Key variables like provider bed count growth, payer membership shifts, cloud migration rates, government incentive pools, and median software maintenance multiples drove the model. Multivariate regression with ARIMA overlays projected those levers to 2030, with expert validated guardrails for cybersecurity shocks or reimbursement shifts. Data gaps in emerging regions were bridged using proxy indicators such as broadband penetration and hospital digital maturity index scores.
Data Validation & Update Cycle
Outputs undergo variance checks versus independent capital spend trackers, followed by senior analyst review rounds before sign off. Reports refresh yearly, and material events, large stimulus bills and mega breaches, trigger interim model patches so clients always receive an up to date view.
Why Mordor's Healthcare IT Baseline Inspires Confidence
Estimates across publishers often diverge because each chooses distinct inclusion rules, price assumptions, and refresh rhythms.
Key gap drivers include: some studies bundle wellness wearables or generic IT services, others fix a single currency year without exchange rate re-basing, and a few project linear growth without validating ASP erosion or incentive phase outs that our team captured.
Benchmark comparison
| Market Size | Anonymized source | Primary gap driver |
|---|---|---|
| USD 413.14 B (2025) | Mordor Intelligence | - |
| USD 760.20 B (2024) | Global Consultancy A | Bundles consumer fitness apps and telecom bandwidth charges |
| USD 354.04 B (2025) | Trade Journal B | Excludes payer side platforms and uses constant 2022 ASPs |
| USD 420.23 B (2024) | Industry Association C | Uses partial regional coverage and five year old adoption ratios |
The comparison shows that when scope, pricing cadence, and geographic completeness are normalized, Mordor's disciplined approach offers a balanced, transparent baseline that decision makers can replicate and stress test with minimal additional effort.


Key Questions Answered in the Report
What is the current value of the healthcare IT market?
The sector is valued at USD 0.55 trillion in 2026.
How fast is the healthcare IT market expected to grow?
It is projected to expand at a 16.41% CAGR through 2031.
Which solution and service segment leads within healthcare IT?
Clinical HCIT holds 48.23% share and remains the fastest-growing segment.
Why are providers the largest buyers of digital-health technology?
CMS rules linking reimbursement to interoperability and prior-authorization timelines drive hospitals and clinics to modernize IT infrastructure.
Which region is showing the quickest expansion?
Asia-Pacific is forecast to post the fastest 17.81% CAGR due to large-scale national digital-health programs.
How are hyperscalers affecting traditional health-IT vendors?
AWS, Azure, and Google Cloud bundle compute and AI services at lower cost, pressuring incumbent pricing models while offering faster innovation cycles.
Page last updated on:


