
Healthcare Asset Management Market Size and Share
Market Overview
| Study Period | 2020 - 2031 |
|---|---|
| Market Size (2026) | USD 46.56 Billion |
| Market Size (2031) | USD 130.18 Billion |
| Growth Rate (2026 - 2031) | 22.85 % |
| Fastest Growing Market | Asia Pacific |
| Largest Market | North America |
| Market Concentration | Medium |
Major Players *Disclaimer: Major Players sorted in no particular order Image © Mordor Intelligence. Reuse requires attribution under CC BY 4.0. | |
Healthcare Asset Management Market Analysis by Mordor Intelligence
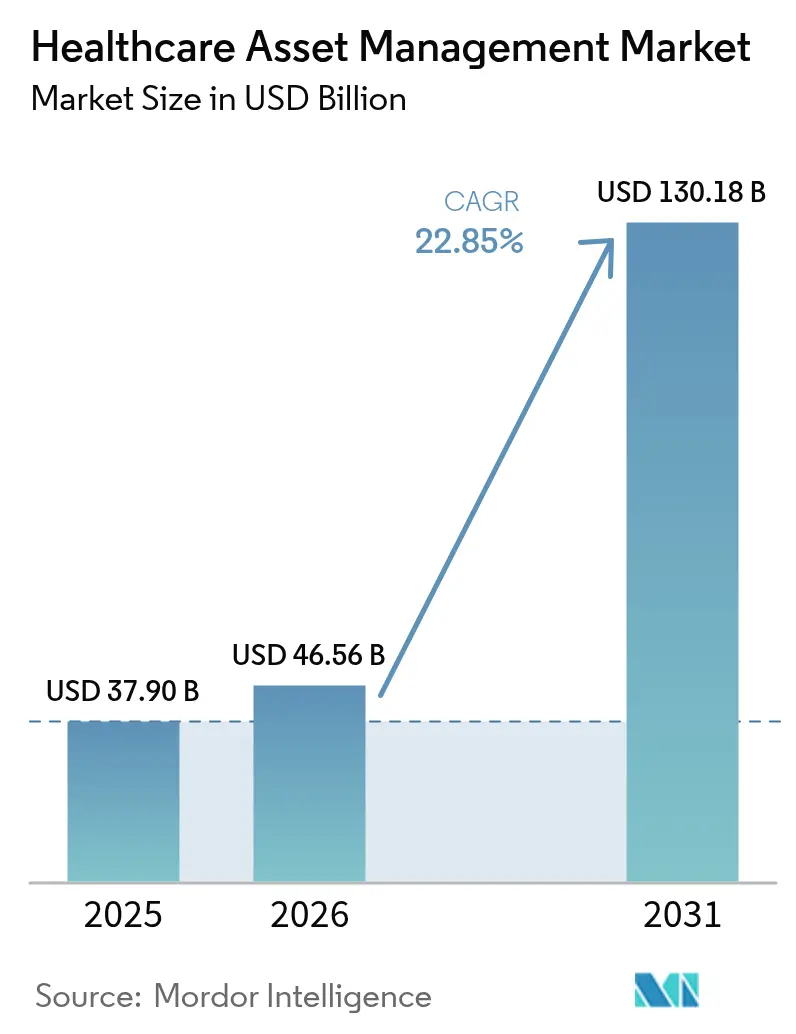
The Healthcare Asset Management market size is expected to grow from USD 37.90 billion in 2025 to USD 46.56 billion in 2026 and is forecast to reach USD 130.18 billion by 2031 at 22.85% CAGR over 2026-2031.
The growth trajectory reflects how regulatory mandates, workforce shortages, and cybersecurity expectations converge to reposition asset tracking from a cost-containment tool to a strategic pillar of digital health operations. Hospitals are looking beyond bar-code inventory toward connected platforms that streamline compliance with the FDA’s 2024 device-security guidance, an obligation that can consume 5% or more of a manufacturer’s annual revenue. [1] Demand also ties directly to nursing-staff constraints; shrinking clinical capacity magnifies the value of systems that free caregivers from locating equipment and instead let them focus on patient outcomes. In parallel, predictive analytics embedded in tags move maintenance from reactive to anticipatory, trimming downtime and extending asset life. Taken together, these forces enable a healthcare asset management market environment in which hospitals, pharma plants, and laboratories regard integrated visibility, cybersecurity, and analytics as non-negotiable features rather than optional add-ons.
Key Report Takeaways
- By technology, RFID led with 55.60% revenue share in 2025, while Real-Time Location Systems are projected to expand at a 27.20% CAGR through 2031.
- By component, hardware accounted for 61.60% of the market in 2025; services hold the fastest outlook with a 24.90% CAGR to 2031.
- By application, equipment and device tracking commanded 47.70% of the healthcare asset management market share in 2025, whereas patient and staff tracking is advancing at a 27.60% CAGR through 2031.
- By end user, hospitals and clinics held 64.40% of 2025 revenue, while pharmaceutical and biotech manufacturing is set to grow at 26.10% CAGR to 2031.
- By geography, North America retained 37.20% of 2025 revenue, yet Asia-Pacific registers the highest regional CAGR at 21.90% to 2031.
Note: Market size and forecast figures in this report are generated using Mordor Intelligence’s proprietary estimation framework, updated with the latest available data and insights as of 2026.
Market Trends and Insights
Drivers Impact Analysis of Healthcare Asset Management Market*
| Driver | (~) % Impact on CAGR Forecast | Geographic Relevance | Impact Timeline |
|---|---|---|---|
| Rising demand for RFID to curb drug counterfeiting | +3.8% | Global, concentrated in North America and EU | Medium term (2-4 years) |
| Efficiency pressures from nursing-staff shortages | +5.2% | North America and EU core; spill-over to APAC | Short term (≤ 2 years) |
| Patient-safety regulations (e.g., UDI, EU-MDR) | +3.1% | North America and EU, expanding in APAC | Long term (≥ 4 years) |
| AI-based predictive maintenance embedded in tags | +2.4% | Global, led by North America | Medium term (2-4 years) |
| Pay-for-performance reimbursement tied to asset traceability | +2.1% | North America core, selective EU adoption | Long term (≥ 4 years) |
| Source: Mordor Intelligence | |||
Rising demand for RFID to curb drug counterfeiting
Pharmaceutical counterfeiting drains an estimated USD 200 billion from the global economy each year, prompting regulators to impose serialisation and pedigree requirements that make end-to-end visibility indispensable. Under the U.S. Drug Supply Chain Security Act, drug makers, wholesalers, and dispensers must prove product provenance at every hand-off. RFID with cryptographic authentication now underpins most of these deployments because it combines item-level identification with real-time environmental monitoring, a necessity for temperature-sensitive biologics. [2] Semiconductor shortages since 2024 lifted tag prices by up to 20%, yet organisations still invest because non-compliance fines and recall costs far exceed hardware spending. Vendors such as SATO have introduced sterilisation-resistant tags that deliver both authentication and workflow efficiency in one process step. [3] These factors underpin the 26.8% CAGR projected for pharmaceutical and biotech manufacturing customers between 2025 and 2030.
Efficiency pressures from nursing-staff shortages
Nursing vacancy rates above 15% in major urban hospitals leave care teams stretched and force administrators to squeeze every efficiency gain possible from support technology. Studies reveal that nurses spend over one-fifth of each shift searching for missing equipment; RTLS implementations that cut search time by more than 90% therefore provide a direct labour dividend that keeps beds staffed without adding headcount. [4] British facilities have demonstrated time reductions from 60 minutes to 10 minutes per device, translating into heightened patient-safety scores and improved staff retention. Advanced deployments now combine BLE badges, panic buttons, and predictive analytics that stage equipment on units before clinicians request it, easing workflow strain and boosting satisfaction.
Patient-safety regulations (UDI, EU-MDR)
Unique Device Identification schemes in the United States and the broader EU-MDR framework require hospitals to capture device identity, maintenance logs, and cybersecurity status throughout a product’s life. Compliance costs can reach 5% of annual sales for manufacturers, spurring demand for platforms that automate data capture and report generation. The recent rise in device vulnerabilities—59% year over year—adds a cybersecurity layer to tracking, turning asset management software into a control point for patch status and threat monitoring. Hospitals that already run integrated tracking platforms are better positioned to meet the EU’s EUDAMED database submissions, reinforcing a virtuous cycle of adoption and compliance.
AI-based predictive maintenance embedded in tags
Embedding sensors and AI models inside capital equipment allows organisations to detect anomalies weeks before failure, cutting downtime by 30% and lowering service costs by close to 20%. Digital twins paired with RTLS events build a continuous data loop that schedules service only when wear indicators cross risk thresholds, rather than on rigid calendar intervals. MRI scanners, ventilators, and infusion pumps equipped with such intelligence can automatically trigger work orders, allocate loaner devices, and update regulatory audit trails, streamlining biomedical engineering workloads and safeguarding revenue streams.
Restraints Impact Analysis of Healthcare Asset Management Market*
| Restraint | (~) % Impact on CAGR Forecast | Geographic Relevance | Impact Timeline |
|---|---|---|---|
| Data-privacy and cybersecurity concerns | –2.8% | Global, heightened in EU and North America | Short term (≤ 2 years) |
| High upfront RTLS / RFID infrastructure cost | –3.2% | Emerging markets core; selective developed-market impact | Medium term (2-4 years) |
| Radio-interference with critical wireless medical devices | –1.4% | Global, acute in high-density medical facilities | Short term (≤ 2 years) |
| Fragmented legacy CMMS slowing integration | –1.8% | North America and EU, legacy-system concentration | Medium term (2-4 years) |
| Source: Mordor Intelligence | |||
Data-privacy and cybersecurity concerns
Average breach costs in healthcare reached USD 9.77 million per incident in 2024, making security risk a material deterrent to rapid roll-outs. The FDA’s 2024 draft guidance urges stronger pre-market security testing, compelling buyers to fund encryption, network segmentation, and continuous monitoring before go-live. Many hospitals, therefore, begin with on-premises deployments or air-gapped networks that limit data flow to the cloud, trading some analytics capability for risk reduction. Legacy devices without secure firmware further complicate integrations, extending project timelines and inflating budgets.
High upfront RTLS/RFID infrastructure cost
Comprehensive implementations often require USD 150,000-250,000 in software licensing plus hardware investments that can exceed USD 500,000 for a 350-bed facility. Semiconductor availability issues and shipping surcharges inflate tag and reader prices, while specialist install teams command premium rates due to scarce cross-disciplinary expertise. Hospitals in emerging economies commonly deploy phased roll-outs focused on high-value assets first, but staggered projects weaken network effects and defer break-even, lengthening payback to three years or more.
*Our forecasts treat driver/restraint impacts as directional, not additive. The impact forecasts reflect baseline growth, mix effects, and variable interactions.
Healthcare Asset Management Market Segment Analysis
By Technology:
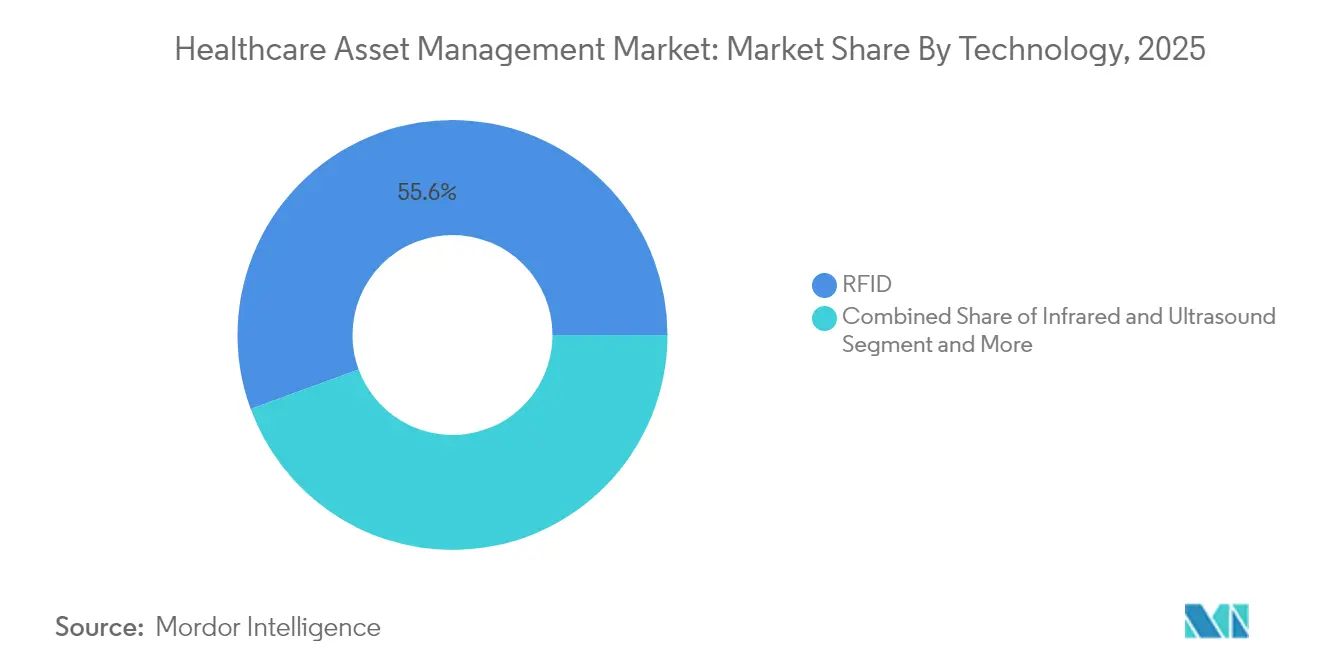
RFID Dominance Faces RTLS DisruptionRFID accounted for 55.60% of 2025 revenue, underlining decades of protocol maturity and robust supply chains that made the technology the default for drug inventory and surgical kit tracking. The healthcare asset management market size for RFID was USD 21.07 billion in 2025, showing how deeply the modality is entrenched at point-of-care cabinets and central sterile processing. Yet software-defined workflows increasingly require location, not just identity. Real-Time Location Systems leveraging BLE, Wi-Fi, and ultra-wideband are therefore forecast to compound at 27.20% CAGR to 2031, eating into static RFID growth.
A second growth phase emerges as vendors collapse RFID and RTLS into multi-mode tags that pivot between passive ID and real-time telemetry, a design that preserves prior capital investment while enabling richer analytics. Deployments at paediatric-care centres demonstrate this twin-mode value: passive RFID limits shrinkage of high-value drugs, while RTLS ensures infusion pumps circulate where patient acuity is highest. Hardware still dominates spending because tags, gateways, and exciters blanket entire campuses; however, the profit pool is shifting toward platform licences that unite device identity, location, and utilisation into one dashboard. As this convergence proceeds, the healthcare asset management market will likely regard single-mode offerings as a niche.

By Component:
Services Surge as Hardware CommoditizesHardware captured 61.60% of 2025 sales thanks to ongoing purchases of millions of tags, readers, and ceiling-mounted beacons. Even so, services are pacing ahead with a 24.90% CAGR as hospitals pivot from capital expense toward managed outcomes. Under subscription agreements, vendors guarantee uptime, firmware currency, and regulatory-ready audit logs, freeing IT teams to focus on patient-facing initiatives. The healthcare asset management market size tied to services is forecast to reach USD 55.32 billion by 2031, pointing to a maturation cycle where infrastructure becomes ubiquitous and differentiation shifts to consultative optimisation.
Professional and managed services also address the hardest obstacles—change management, systems integration, and cybersecurity accreditation—that no amount of shelf hardware alone can solve. Service contracts typically bundle remote device health checks, algorithm updates, and compliance documentation generation, costs that spread evenly across multi-year terms and match reimbursement cycles. Hospitals increasingly justify deals by showing that avoided nursing overtime, faster bed turnover, and reduced device rentals offset monthly subscription fees.
By Application:
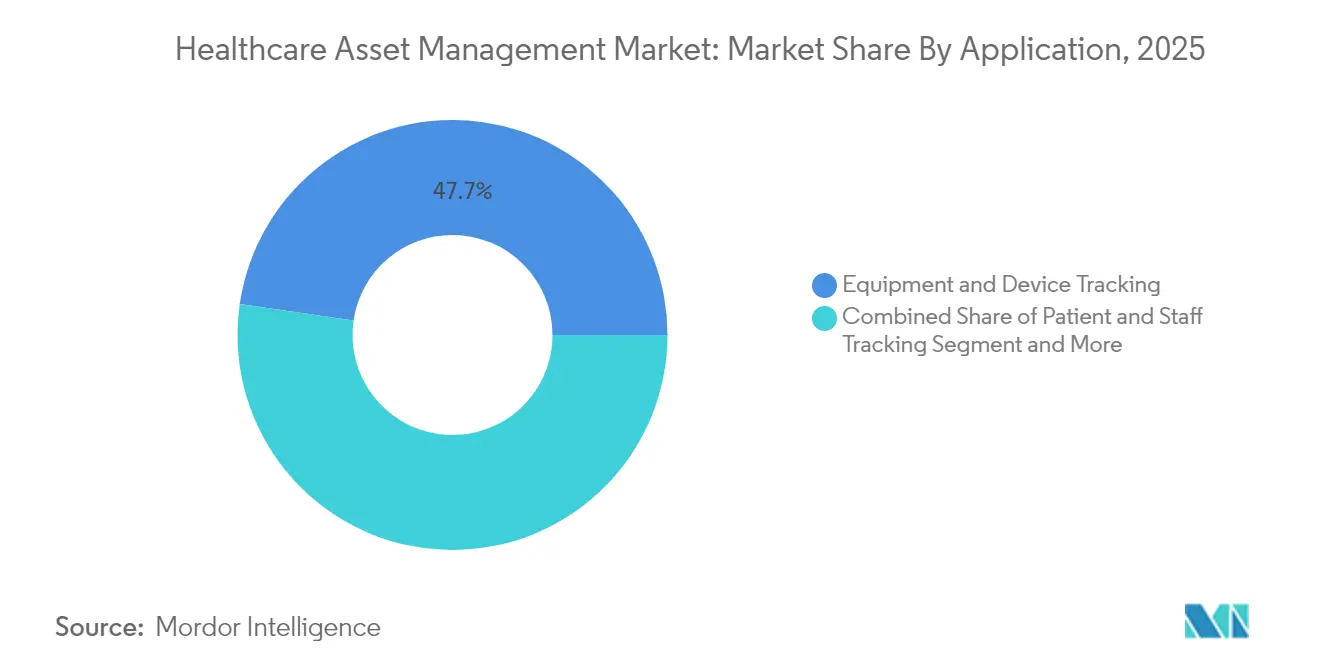
Patient Tracking Emerges as Growth DriverEquipment and device tracking accounted for 47.70% of 2025 revenue because locating wheelchairs, IV pumps, and ventilators delivers a quick, measurable return. Yet the next frontier is human-centric tracking. Patient and staff tracking is slated for 27.60% CAGR to 2031, reflecting an operational philosophy where assets, providers, and patients form a single digital ecosystem. When wristbands and badges join tagged devices, care-team orchestration becomes algorithmic, enabling just-in-time delivery of equipment, medication, and specialist intervention.
Hospitals that merge these data layers report significant throughput gains. For example, by binding patient acuity scores, room environmental sensors, and asset availability, a predictive model can pre-stage dialysis machines in units expecting renal patients, slashing admission delays. The healthcare asset management market share for patient-centric applications is on track to eclipse equipment-only systems before 2029. Environmental monitoring remains a complementary use case, safeguarding cold cabinets and isolation suites with continuous temperature and humidity feeds. As software suites standardise API frameworks, cross-application synergies multiply, reinforcing the appeal of end-to-end platforms.
By End User:
Pharmaceutical Manufacturing AcceleratesHospitals and clinics represented 64.40% of turnover in 2025, a testament to early adoption and visible operating gains. Nonetheless, pharmaceutical and biotech plants now display the fastest momentum at 26.10% CAGR, lifted by strict serialisation timelines and cold-chain complexity. The healthcare asset management market size for pharma could top USD 12.85 billion by 2031 as factories retrofit production lines with in-line scanners, embedded sensors, and edge analytics that verify pedigree, temperature, and chain-of-custody in real time. Laboratories and diagnostic centres show steady uptake because grant-funded research protocols increasingly demand traceable reagents and calibrated instrumentation. Meanwhile, long-term-care facilities enter the radar as population ageing intersects with chronic-illness management, amplifying the need for round-the-clock visibility of mobility aids, oxygen concentrators, and smart beds.
Geography Analysis
North America Healthcare Asset Management Market
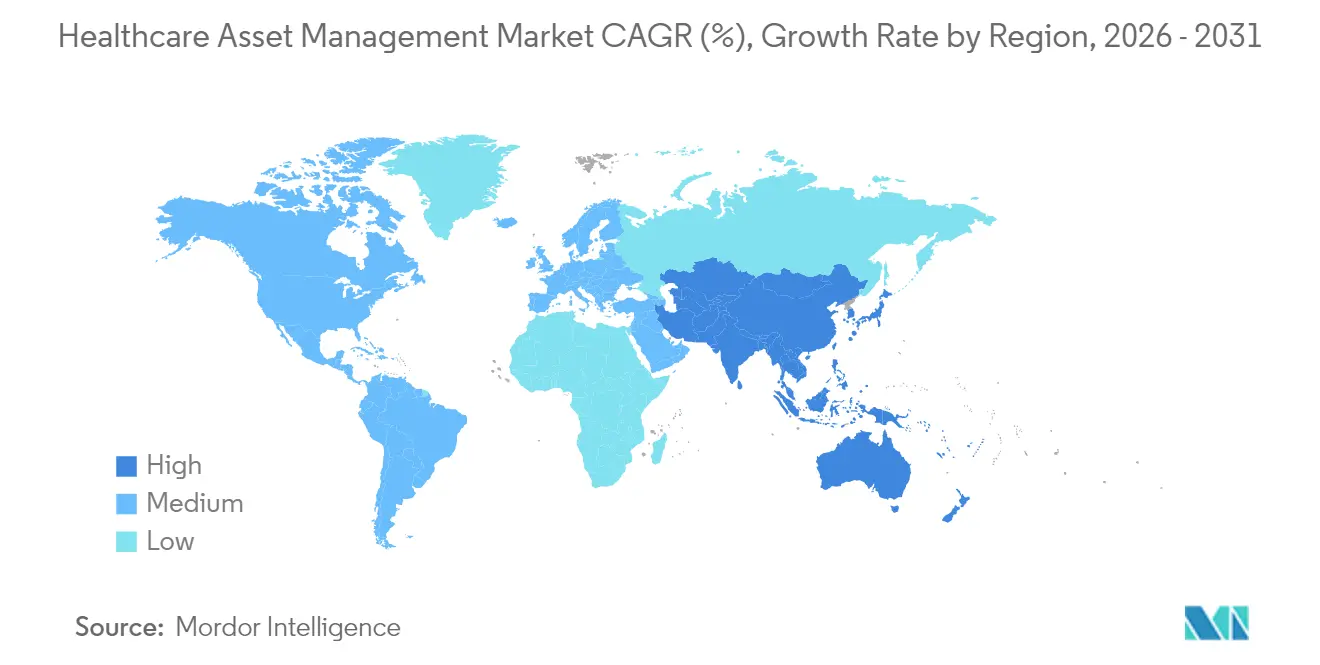
North America held 37.20% of 2025 revenue, sustained by the United States’ comprehensive serialisation law, a mature EHR backbone, and rising incidents of medical device cyber threats that favour integrated, secure platforms. Canadian provinces are adopting similar policies, while Mexican private-sector hospitals invest in asset tracking to retain medical tourists and satisfy U.S. insurer audits. Government reimbursement models that penalise safety lapses make traceability a board-level metric, further supporting healthcare asset management market adoption across the region.
APAC Healthcare Asset Management Market
Asia-Pacific is the fastest-growing area with a 21.90% CAGR expected through 2031. Public-hospital construction programmes in China, India, and Southeast Asia enable greenfield deployments that skip legacy bar-code steps and implement RFID-RTLS convergence from day one. Many of these facilities integrate asset management with national digital-health clouds, allowing real-time drug authentication across regional supply chains. As capital investment aligns with universal health-coverage goals, vendors report multi-year master contracts covering hundreds of new hospitals.
Europe Healthcare Asset Management Market
Europe shows steady uptake led by the EU-MDR mandate, EUDAMED database roll-outs, and national sustainability targets that favour lifecycle optimisation. Germany and the United Kingdom drive early deployments, but funding mechanisms in Eastern Europe are catching up as structural funds emphasise digital transformation. Cybersecurity expectations anchored in GDPR elevate demand for on-premises or hybrid clouds with local data residency, nudging platform suppliers to broaden configuration options. With Brexit adding customs complexity for cross-channel medical trade, British providers rely on traceability to avoid port delays and product waste.
Regulatory Landscape
Regulation is tightening around traceability, quality systems, and cybersecurity, pushing healthcare asset management platforms to store device identity, maintenance history, and security posture in audit-ready formats. In the United States, FDA issued final guidance in June 2025 on Cybersecurity in Medical Devices: Quality System Considerations and Content of Premarket Submissions (aligned to section 524B of the FD&C Act), which raises documentation expectations such as Software Bill of Materials (SBOM) and cybersecurity assurance. This in turn increases demand for tooling that links physical assets to software and firmware inventories, and to patch status across the device lifecycle.
Quality-system harmonization and EU device registration milestones add further operational requirements for manufacturers and provider organizations. FDA QMSR became fully effective on February 2, 2026, aligning 21 CFR 820 with ISO 13485:2016 and reinforcing process controls that extend into servicing, maintenance records, and complaint handling. In the EU, the European Commission made the EUDAMED UDI/Devices module mandatory from May 28, 2026 under Regulation (EU) 2024/1860, strengthening the business case for UDI capture at point of use and tighter linkage between device inventories, utilization, and regulatory identifiers.
Value Chain Analysis
The value chain starts with component and hardware providers supplying RFID/RTLS tags, readers, gateways, and supporting location infrastructure, then moves to platform software that aggregates location, identity, utilization, and condition data into workflows and analytics. Companies such as HID Global and Novanta provide enabling technologies for hospital asset tracking, while solution providers such as Securitas Healthcare deliver packaged RTLS-led offerings that combine software, deployment services, and ongoing support. As deployments expand from equipment finding into cybersecurity, infection control, and maintenance automation, the software layer increasingly acts as the orchestration point connecting clinical engineering, IT, and supply chain systems.
Deployment and lifecycle services sit downstream of those core platforms and typically cover site surveys, integration to hospital systems, device onboarding, and managed operations. Partnerships show how health systems are using specialized service providers and integrated platforms to address capability gaps. In June 2026, TRIMEDX partnered with OSF HealthCare (managed by Pointcore Inc, an OSF subsidiary) to manage clinical asset performance including medical device cybersecurity and AI-powered analytics, reflecting a shift toward outcomes-based asset performance programs. Vendor-to-vendor alliances also expand integration options, including the January 2026 SOLUM and Alltrack Medical partnership that connected inventory and asset workflows by integrating software platforms with Newton ESL and Trace tracking across healthcare operations.
Competitive Landscape
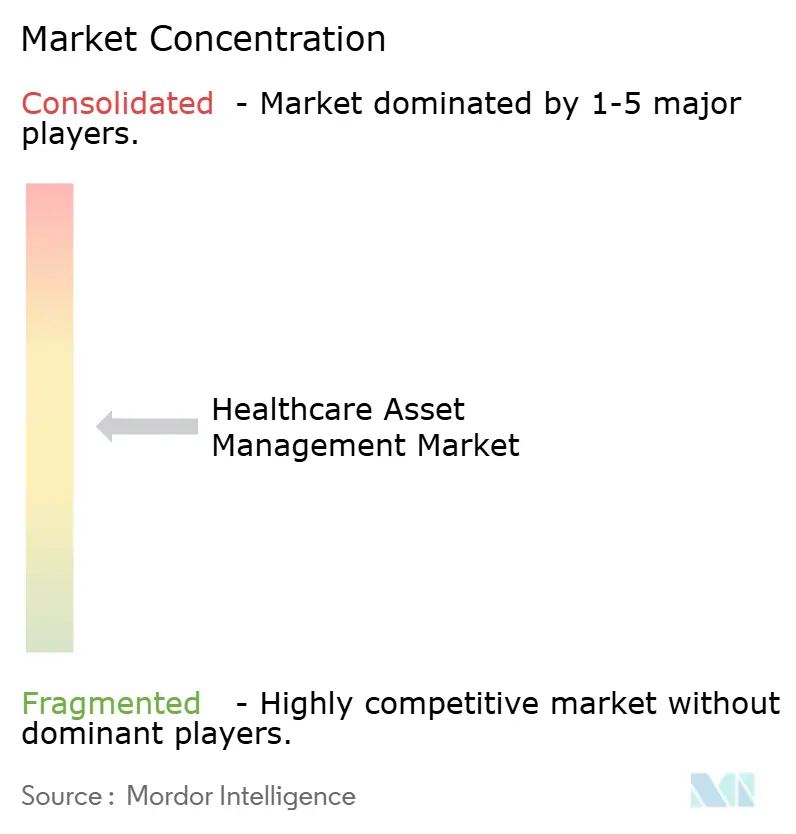
The field remains moderately fragmented; no single supplier holds dominant control, yet a cluster of established companies creates a high barrier to newcomers. Stanley Healthcare, CenTrak, and Zebra Technologies benefit from broad portfolios, validated integrations, and nationwide support teams, giving them durable contracts with multi-hospital systems. Vertical specialists such as Securitas Healthcare focus on clinical workflow use cases, while component innovators like Impinj accelerate tag performance for dense metal environments. The market’s middle tier contains analytics startups that layer AI on top of installed RTLS networks, monetising data exhaust instead of hardware.
Consolidation pressures are rising because hospitals dislike stitching together point solutions. Siemens and IBM’s co-engineering agreement illustrates how asset management intersects with lifecycle simulation, bringing design-for-serviceability principles directly into operational dashboards. Vendors compete increasingly on outcome assurances, bundling uptime guarantees, compliance reporting, and cybersecurity insurance into subscription models. Companies capable of unifying device identity, location, and performance analytics inside a single SLA gain negotiation leverage, while hardware-only players risk commoditisation.
Strategic alliances also aim at addressing pharmaceutical cold-chain challenges. Tag manufacturers partner with temperature-controlled packaging firms to embed sensors that survive extreme shipping conditions, turning logistics data into predictive spoilage alerts. On the services side, integration firms hire biomedical engineers and clinical informaticists to provide 24 × 7 command-centre support. This talent mix, expensive to replicate, bolsters switching costs and underpins recurring revenue.
Healthcare Asset Management Industry Leaders
-
Stanley Healthcare (Stanley Black and Decker)
-
CenTrak Inc.
-
AiRISTA Flow Inc.
-
GE HealthCare Technologies Inc.
-
IBM Corporation
- *Disclaimer: Major Players sorted in no particular order
Healthcare Asset Management Market Companies Covered in this Report
- Stanley Healthcare (Stanley Black & Decker)
- CenTrak Inc.
- AiRISTA Flow Inc.
- GE HealthCare Technologies Inc.
- IBM Corporation
- Infor Inc.
- Motorola Solutions Inc.
- Siemens Healthineers AG
- Accenture plc
- Sonitor Technologies AS
- Zebra Technologies Corporation
- Johnson Controls (Tyco International)
- Honeywell International Inc.
- Impinj Inc.
- Alien Technology LLC
- HID Global Corporation
- Ascom Holding AG
- Midmark Corporation (Versus RTLS)
- Trimble Inc. (Atrius)
- Cerner Corporation (Oracle Health)
- TagMaster AB
- Radianse LLC
- Kontakt.io Inc.
- Litum IoT Technologies
- Elpas Ltd. (Securitas)
Market Opportunities and Future Outlook
Interoperability and standards alignment create whitespace for platforms that connect real-time location, maintenance, and clinical systems without custom interfaces. Standards activity is moving from guidance to more formal specification, including ITU-T Recommendation F.780.7 (August 2025) defining a layered architecture for medical equipment management platforms, EN ISO 11073-10206:2026 for device interoperability, and HL7 International launching the Caliper FHIR Accelerator in March 2026 to improve real-time device data integration. These developments support opportunities for asset management vendors to productize FHIR- and IEEE 11073-aligned connectors, enabling use cases such as automated work orders, utilization analytics, and inventory provenance linked to core hospital IT.
Facilities modernization programs also support multi-site deployment opportunities where digital infrastructure and asset visibility are included in capital plans. In the United Kingdom, the government published a 10 Year Capital Plan in July 2026 committing at least GBP 64 billion over the next decade for health estate maintenance, and announced the first 27 Neighbourhood Health Centre upgrade schemes in March 2026. Together, those initiatives create a pathway for RTLS, RFID, and hybrid tracking implementations tied to refurbishment timelines rather than standalone IT budgets. On the maintenance side, ISO/TS 5137:2026 formalizes medical device maintenance management programs for healthcare delivery organizations, reinforcing demand for systems that pair asset registries with preventive maintenance, evidence-ready reporting, and cybersecurity-aware device lifecycle controls.
Recent Industry Developments in Healthcare Asset Management Market
- June 2026: TRIMEDX announced a partnership with OSF HealthCare to manage clinical asset performance, covering equipment reliability, AI-powered analytics, and medical device cybersecurity. The program structure, managed by OSF subsidiary Pointcore Inc, highlights a shift toward outsourced and outcomes-oriented asset performance models that blend tracking with maintenance and security operations.
- August 2025: AiRISTA announced it achieved ISO 9001 and ISO 27001 certifications. The certifications strengthen AiRISTA’s positioning for hospital buyers that require validated quality management and information security practices when deploying RTLS software and services into clinical environments.
- June 2024: CenTrak announced a partnership with The Leapfrog Group focused on advancing patient safety and well-being. The collaboration ties RTLS-enabled operational visibility to recognized safety frameworks, supporting broader adoption beyond asset location into measurable patient-safety and workflow outcomes.
Healthcare Asset Management Market Report Scope and Research Methodology
Market Definition and Coverage
For this methodology, the healthcare asset management market covers the tools and services used to identify, track, maintain, and improve the use of physical assets in healthcare settings, with value counted as revenues from tracking hardware, software, and related implementation and support.
Scope exclusions: It does not include general facilities management contracts or non-tracking services such as housekeeping, catering, and security.
Segments Covered in This Report
- By Technology
- RFID
- Real-Time Location Systems (RTLS)
- Bluetooth Low Energy (BLE) and Wi-Fi
- Infrared and Ultrasound
- By Component
- Hardware (Tags, Readers, Gateways)
- Software (Analytics, Middleware)
- Services (Deployment, Managed, Training)
- By Application
- Equipment and Device Tracking
- Inventory/Supply-Chain Management
- Patient and Staff Tracking
- Bed and Capacity Management
- Environmental and Condition Monitoring
- By End-user
- Hospitals and Clinics
- Laboratories and Diagnostic Centers
- Pharmaceutical and Biotech Manufacturing
- Long-Term Care and Assisted-Living Facilities
- By Geography
- North America
- United States
- Canada
- Mexico
- South America
- Brazil
- Argentina
- Chile
- Rest of South America
- Europe
- Germany
- United Kingdom
- France
- Italy
- Spain
- Russia
- Rest of Europe
- Asia-Pacific
- China
- India
- Japan
- South Korea
- Australia
- Malaysia
- Singapore
- Rest of Asia-Pacific
- Middle East and Africa
- Middle East
- United Arab Emirates
- Saudi Arabia
- Turkey
- Rest of Middle East
- Africa
- South Africa
- Nigeria
- Egypt
- Rest of Africa
- Middle East
- North America
Data Sources, Market Sizing, and Validation
Desk Research
Desk research is used to set the guardrails for the model, so the scope stays tied to real healthcare asset tracking and lifecycle workflows. We start with public health and hospital system indicators, together with technology adoption signals that show how quickly tracking and location tools are being rolled out across care sites.
Typical source types reviewed include the World Health Organization for health system metrics, the World Bank for macro series and health spend trends, the US FDA for device context and safety alerts, the US Bureau of Labor Statistics for healthcare employment and wage trends, and customs or national statistics portals for import and production signals of tracking components. We also use company annual reports, investor presentations, reputable press coverage, peer-reviewed journals, and selectively a paid subscription source for company financials and another for patent databases to map solution intensity and pricing direction. These examples are not exhaustive, and many other public and paid sources are used for data collection, validation, and research clarification.
Primary Interviews and Surveys
Primary work is used to turn the desk view into practical assumptions that reflect how hospitals, labs, and other care sites buy and deploy these systems. We speak with solution teams, channel partners, and hospital and clinical operations stakeholders across major regions. The feedback is then used to test adoption rates, typical contract sizes, and service attachment, so gaps in public data can be closed with realistic ranges.
Distribution of primary research fieldwork respondents
| Company type | Respondent position | Region |
|---|---|---|
| Top tier: 30% | CXOs: 15% | APAC: 46% |
| Mid tier: 54% | Functional/Unit leaders: 27% | EMEA: 30% |
| Smaller Players: 16% | Managers: 58% | Americas: 24% |
Market-Sizing & Forecasting
Sizing is built using a top-down demand pool that starts from the count of care delivery sites and beds, then applies adoption and spend intensity for asset tracking and lifecycle tools to reconstruct addressable revenues by region. After the totals are formed, we cross-check them with selective bottom-up approximations, including sampled contract values for software and services, typical tag and reader volumes per site, and channel checks on average selling price behavior. These checks are then used to adjust any outliers.
Inputs that matter in this market include hospital and clinic footprint growth, replacement and refresh cycles for tags and location infrastructure, software subscription price progression, service attach rates for deployment and maintenance, and the pace of RTLS and RFID adoption in critical departments. When forecasts are produced, scenario analysis is used so growth can adjust based on rollout speed, budget cycles, and supply conditions, with the final path aligned to what interviewees consider achievable in routine procurement windows. Where bottom-up signals are missing in smaller countries, proxy ratios are applied from comparable health system profiles and then rechecked against regional averages so the model does not overfit a single data point.
Data Validation & Update Cycle
Validation is done through triangulation across the demand pool build, pricing logic, and independent signals like hospital capital spending direction and reported digital operations priorities. If a country or region shows an unusual step change, the assumptions are revisited, and follow-up outreach is triggered to confirm whether it is a real market shift or a data timing issue.
Before sign-off, the full model is reviewed in steps, where inputs, calculations, and outputs are checked by another analyst, then reconciled back to the defined scope. Reports are refreshed annually, with interim updates when major events can change adoption or pricing, and a final pre-delivery pass is completed so clients receive the latest updated view.
Mordor Intelligence's Global Healthcare Asset Management Market Market Size Versus Other Published Estimates
Published market sizes for healthcare asset management can look far apart even when they sound like they cover the same topic, because the timing and the counting rules are often not aligned. Differences usually come from what gets included as billable revenue, which year is treated as the starting point, and how pricing is converted into USD when inflation and currency shifts are active.
A refresh-led gap is common here because average selling price for tags, readers, and software subscriptions can move within the year, and then services can be recognized differently depending on contract structure. When we refreshed FX timing and ASP steps close to the base year, and then rechecked adoption and service attach assumptions through interviews, the 2025 estimate landed at USD 37.90 B, a treatment used in the model by Mordor Intelligence.
Benchmark comparison
| Source | Market Size | Gaps in Research Methodology |
|---|---|---|
| Mordor Intelligence | USD 37.90 B (2025) | |
| Global Research Publisher A | USD 31.50 B (2024) | Uses an earlier base year and can compress the value by applying annual-average currency conversion and older ASP ranges before late-year price changes and service attach are reflected. |
| Industry Press Release B | USD 19.49 B (2024) | Often focuses on a narrower solution slice and may undercount recurring software and implementation services, with limited checks on hospital rollout pace across regions. |
The spread across the three figures is mainly explained by year choice, how USD conversion is timed, and whether recurring software and services are fully counted. By keeping the scope tied to billable asset tracking systems and using repeatable checks on adoption, ASP, and service attachment, the final number stays traceable to clear inputs and can be updated without rebuilding the model from scratch.
Key Questions Answered in the Report
What is driving the rapid expansion of the healthcare asset management market?
A mix of regulatory compliance costs, nursing-staff shortages, and rising cybersecurity expectations is converting asset management from a cost-saving project into a strategic necessity, fuelling a 22.85% CAGR toward 2031.
Which technology segment is growing fastest within the healthcare asset management market?
Real-Time Location Systems lead growth with a projected 27.20% CAGR, as hospitals require dynamic location intelligence rather than static identification.
Why are services gaining momentum compared with hardware sales?
Hospitals prefer operational-expense models that bundle uptime guarantees, cybersecurity updates, and compliance reporting, propelling services to a 24.90% CAGR.
How do patient-tracking applications differ from traditional equipment tracking?
Patient and staff tracking unifies human and asset data streams, supporting workflow orchestration that reduces admission delays and boosts throughput; the segment is forecast to grow 27.60% annually.
Which region will contribute most to future market growth?
Asia-Pacific is expected to post a 21.90% CAGR through 2031 thanks to new-build hospitals and government digitisation initiatives that deploy integrated RFID-RTLS platforms from the outset.
What primary obstacle could slow adoption?
High upfront infrastructure cost remains the key restraint, particularly in emerging markets, where full-campus deployments can exceed USD 500,000 before ancillary network upgrades.