| Study Period | 2018 - 2030 |
| Base Year For Estimation | 2024 |
| Forecast Data Period | 2025 - 2030 |
| Market Size (2025) | USD 17.33 Billion |
| Market Size (2030) | USD 20.88 Billion |
| CAGR (2025 - 2030) | 3.79 % |
| Market Concentration | High |
Major Players*Disclaimer: Major Players sorted in no particular order |

Gums Market Analysis
The Gums Market size is estimated at 17.33 billion USD in 2025, and is expected to reach 20.88 billion USD by 2030, growing at a CAGR of 3.79% during the forecast period (2025-2030).
The gum industry is experiencing significant transformation driven by evolving retail dynamics and digital acceleration. Traditional retail channels are adapting to changing consumer preferences, with supermarkets and hypermarkets implementing strategic product positioning and innovative merchandising techniques. The retail landscape has witnessed considerable consolidation, exemplified by major chains like Lidl operating 11,200 outlets and Aldi Süd with 7,200 outlets globally as of 2022. This retail evolution is further amplified by the digital revolution, with approximately 5.18 billion internet users worldwide in 2023, representing 64.6% of the global population, driving significant growth in online confectionery sales.
Consumer health consciousness is reshaping product development and marketing strategies in the gum industry. Manufacturers are responding to growing health awareness, with approximately 52% of global consumers actively trying to lose weight as of 2023. This trend has catalyzed innovation in sugar-free and functional gums varieties, particularly as dental health concerns become more prominent, with studies showing that about 92% of adults between ages 20-64 in the United States suffered from tooth decay in 2022. Companies are increasingly positioning their products as lifestyle accessories that offer benefits beyond simple refreshment.
Product innovation has become a crucial differentiator in the market, with manufacturers focusing on natural gums, sustainable packaging, and functional benefits. Companies are developing gums with added vitamins, minerals, and natural sweeteners to appeal to health-conscious consumers. The industry has witnessed a surge in products targeting specific consumer needs, such as dental care, stress relief, and energy enhancement. Manufacturers are also incorporating innovative packaging solutions and experimenting with new delivery formats to enhance consumer experience and maintain product freshness.
Distribution channel evolution continues to reshape market dynamics, with retailers adopting omnichannel strategies to meet diverse consumer preferences. Traditional convenience stores are enhancing their digital capabilities while maintaining their advantage in impulse purchases, particularly through strategic product placement near checkout counters. About 50% of Americans consume gums regularly as of 2023, driving retailers to optimize their product placement and marketing strategies. The industry is witnessing increased integration of technology in retail operations, from inventory management to personalized marketing, creating a more seamless shopping experience across physical and digital channels.
Global Gums Market Trends
Oral health benefits associated with chewing gum, along with the wide availability of flavors, resulted in the market's positive growth
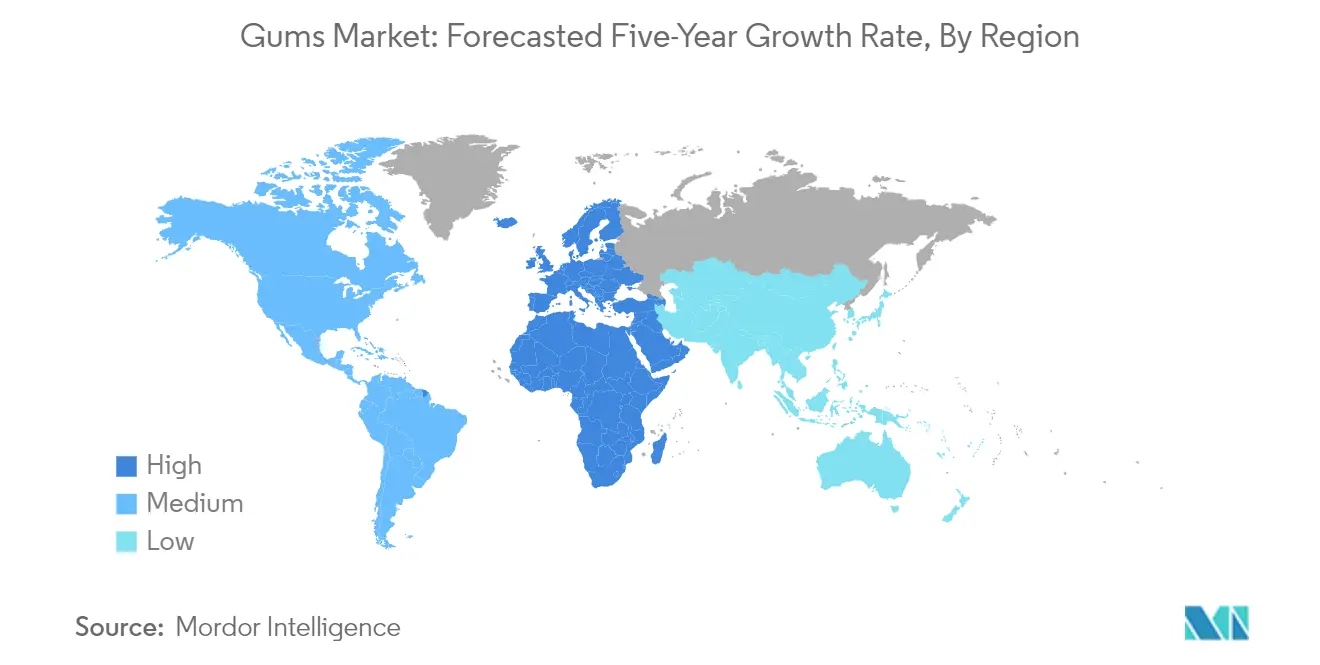
- Asia-Pacific and North America are the prominent gum-consuming regions, followed by Europe. In Asia-Pacific, consumers in formal settings, such as students and working professionals, prefer chewing gum for brain stimulation as it enhances focus and concentration. China, India, and Japan are leading gum-consuming countries in the region.
- Chewing gum is a widely consumed gum variant across leading markets, including North America and Asia-Pacific. The flavor is one of the most significant attributes when it comes to buying chewing gum. Some popular chewing gum flavors include peppermint, spearmint, watermelon, cinnamon, original bubblegum, and tropical.
- Globally, North America experienced the highest consumption of gums in terms of value in 2023. In the region, as of 2023, on average, the cost of a simple package of sugar-free gum that contains 12 to 60 pieces at the local grocery store ranged from USD 1 to USD 2 per individual pack.
- Globally, the consumer preference for chewing gums is attributed to their associated health benefits, such as keeping teeth clean and freshening breath. Also, chewing gum and bubble gum are perceived to have a stress-relieving effect by providing a repetitive and rhythmic action.
Understand The Key Trends Shaping This Market
Download PDF
OTHER KEY INDUSTRY TRENDS COVERED IN THE REPORT
- The usage of low-calorie plant-based sweeteners stevia and xylitol, is boosting the demand for sugar-free gums in the market
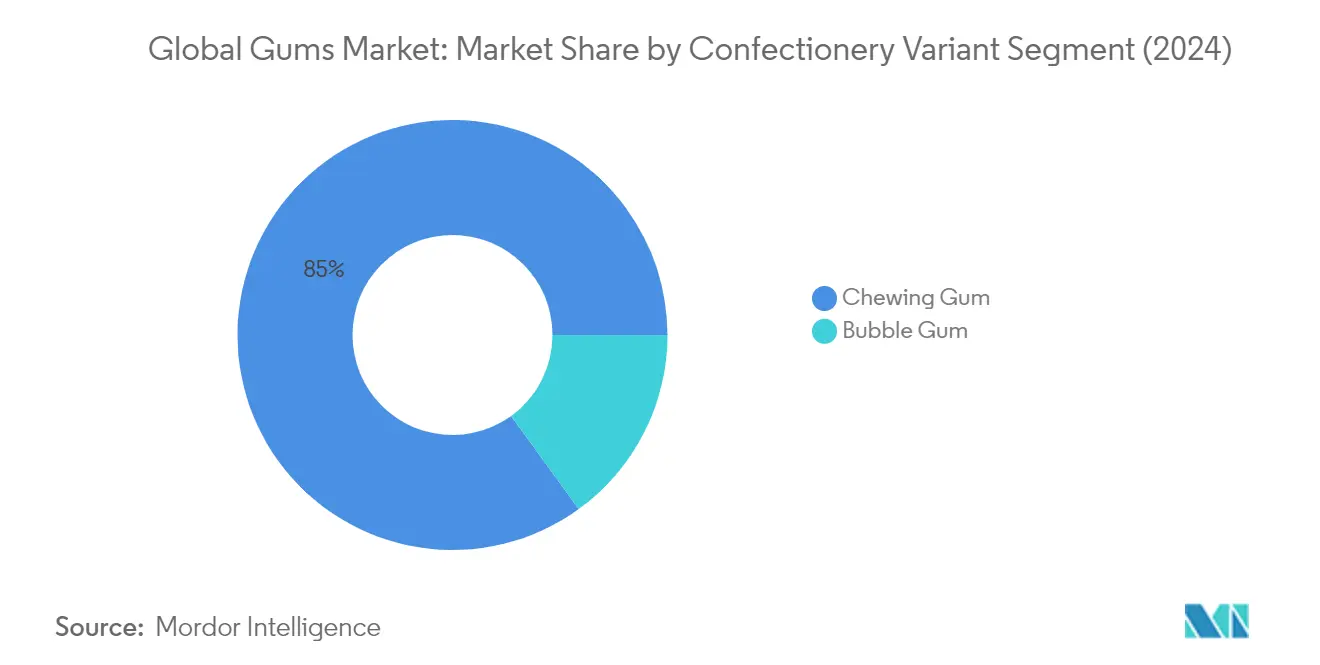
Segment Analysis: Confectionery Variant
Chewing Gum Segment in Global Gums Market
Chewing gum dominates the global gum market, accounting for approximately 85% of the market share in 2024. The segment's strong position is driven by increasing consumer awareness about the health benefits of chewing gum, including improved cognitive functions, stress reduction, and oral hygiene benefits. The availability of both sugar-based and sugar-free variants caters to diverse consumer preferences, with sugar-free options gaining particular traction among health-conscious consumers. Major manufacturers are focusing on product innovations, introducing new flavors and functional benefits to maintain consumer interest. The segment's growth is further supported by strategic product positioning in retail outlets, particularly at checkout counters in supermarkets and convenience stores, which drives impulse purchases.
Bubble Gum Segment in Global Gums Market
The bubble gum segment is projected to exhibit the fastest growth in the global gum market during 2024-2029, with an expected growth rate of approximately 4% annually. This growth is primarily driven by manufacturers' innovative marketing strategies and product development initiatives targeting younger consumers. Companies are expanding their product portfolios with new flavors like grape, apple, watermelon, and cotton candy, moving beyond traditional pink bubble gum. The segment's growth is also supported by the introduction of sugar-free bubble gum variants using xylitol as a substitute, appealing to health-conscious consumers and parents concerned about their children's sugar intake. Manufacturers are also focusing on attractive packaging designs and shapes, including baseball-shaped gums and smiley faces, to enhance consumer appeal.
Segment Analysis: Distribution Channel
Supermarket/Hypermarket Segment in Global Gums Market
Supermarkets and hypermarkets continue to dominate the global gums market, accounting for approximately 42% of the total distribution channel share in 2024. The segment's dominance is attributed to strategic product positioning, particularly near bill counters, which significantly influences impulse purchases. These retail formats offer extensive shelf space dedicated to various gum brands and flavors, allowing for better product visibility and consumer choice. Major supermarket chains have established comprehensive networks of stores worldwide, with key players like Costco, Amazon Fresh, Walmart, Kroger, Safeway, Metro Group, Tesco, and Sainsbury's offering a wide range of chewing gums and bubble gums. The segment's growth is further supported by regular promotional activities, bulk purchase options, and the ability to maintain consistent product availability across their extensive store networks.
Online Retail Store Segment in Global Gums Market
The online retail channel is experiencing remarkable growth in the gums market, projected to achieve a CAGR of approximately 4% during 2024-2029. This growth is primarily driven by increasing internet penetration, with approximately 5.18 billion individuals accessing the internet globally. The segment's expansion is further supported by the rising adoption of e-commerce platforms and the convenience of doorstep delivery services. Online retailers are differentiating themselves through competitive pricing strategies, extensive product selections, and the convenience of comparing different brands and variants. The channel's growth is also attributed to the increasing smartphone usage and the expanding network of grocery delivery chains. User-friendly mobile applications from retailers like Target, Kroger, Walmart, and Instacart are making gum purchases more accessible and convenient for consumers.
Remaining Segments in Distribution Channel
The convenience store segment maintains a significant presence in the gums market, serving as crucial points for impulse purchases due to their strategic locations and accessibility. These stores typically position gum products near checkout counters to maximize visibility and encourage spontaneous buying decisions. The 'Others' category, which includes specialty stores, warehouse clubs, drug stores/pharmacies, vending machines, and forecourt retailers, plays a vital role in reaching diverse consumer segments through various retail formats. These alternative channels often cater to specific consumer preferences and shopping habits, offering unique advantages such as specialized product selections, bulk purchasing options, and location-specific convenience.
Gums Market Geography Segment Analysis
Gums Market in Asia-Pacific
The Asia-Pacific gum market demonstrates significant diversity across its key markets, including China, Japan, India, Indonesia, Australia, Malaysia, New Zealand, and South Korea. The region's market dynamics are shaped by varying consumer preferences, with younger populations driving demand, particularly in countries like China and India. Consumer trends indicate a growing preference for sugar-free variants and functional gums, especially in developed markets like Japan and South Korea. The market is characterized by a strong presence of both international and local players, with continuous product innovations focusing on new flavors and healthier formulations.
Gums Market in China
China dominates the Asia-Pacific gum market, holding approximately 55% share of the regional market in 2024. The Chinese market exhibits strong penetration of both local and mainstream brands, including Trident, Mentos, Orbit, Doublemint, and Eclipse. A range of exciting flavors by key brands promotes impulse buying behavior among target consumer groups. The country's market is particularly driven by rising health consciousness among consumers, with a growing preference for sugar-free variants. The significant youth population and increasing urbanization continue to fuel market growth, while modern retail channels and e-commerce platforms enhance product accessibility.
Gums Market in Indonesia
Indonesia represents the fastest-growing market in the Asia-Pacific region, with an expected growth rate of approximately 7% during 2024-2029. The Indonesian gum market is characterized by strong consumer preference for bubble gums, particularly among the younger demographic. Major players in the country target kids through innovative marketing strategies, including the redemption of stickers and toys. The market growth is supported by increasing disposable income, growing retail infrastructure, and changing consumer preferences. Local manufacturers like PT Pusan Manis Mulia and Mustika Manis Utama Corporation play a significant role in market development, while international brands maintain a strong presence through diverse product offerings.
Gums Market in Europe
The European gum market showcases a mature and sophisticated landscape across its major markets, including Germany, France, the UK, Italy, Spain, Netherlands, Belgium, Switzerland, Russia, and Turkey. The region demonstrates strong consumer awareness regarding the oral health benefits of sugar-free gums, driving product innovation in this segment. Market dynamics vary significantly across countries, with Northern European countries showing higher penetration of sugar-free variants compared to Southern European markets. The region's market is characterized by strong distribution networks and modern retail infrastructure.
Gums Market in Germany
Germany leads the European gum market, commanding approximately 25% of the regional market share in 2024. The country's market is driven by strong consumer preference for sugar-free and functional gums, particularly among health-conscious consumers. German consumers show high awareness of the oral health benefits associated with gum consumption, influencing purchasing decisions. The market features sophisticated retail channels and a strong presence of both domestic and international brands, offering diverse product ranges to meet varying consumer preferences.
Gums Market in Netherlands
The Netherlands emerges as the fastest-growing market in Europe, with an anticipated growth rate of approximately 5% during 2024-2029. The Dutch gum market shows strong preference for innovative products with natural ingredients and sustainable packaging. Consumer awareness about dental health benefits drives the demand for functional gums. The market growth is supported by strong retail infrastructure and effective distribution networks, while manufacturers focus on product innovations to meet evolving consumer preferences.
Gums Market in Africa
The African gum market encompasses diverse markets, including Egypt, Nigeria, South Africa, and other regional countries. The market demonstrates varying consumption patterns across different regions, with South Africa and Egypt emerging as the largest and fastest-growing markets, respectively. Consumer preferences vary significantly across regions, influenced by local tastes and economic conditions. The market shows strong potential for growth, particularly in urban areas where modern retail infrastructure is developing rapidly. International brands maintain significant presence while local manufacturers cater to specific regional preferences.
Gums Market in Middle East
The Middle Eastern gum market spans across key countries, including Saudi Arabia, UAE, Kuwait, Bahrain, Qatar, and Oman. Saudi Arabia represents the largest market, while Qatar shows the fastest growth in the region. The market benefits from high consumer spending power and strong retail infrastructure. Consumer preferences lean towards premium products and innovative flavors, while increasing health consciousness drives demand for sugar-free variants. The region's young population significantly influences market dynamics, with manufacturers focusing on attractive packaging and new flavor innovations to capture this demographic.
Gums Market in North America
The North American gum market, comprising the United States, Canada, and Mexico, demonstrates mature market characteristics with strong consumer awareness and established distribution networks. The United States leads the regional market, while Mexico shows the fastest growth potential. The market is characterized by a strong presence of major international brands and sophisticated retail infrastructure. Consumer preferences increasingly lean towards functional and sugar-free variants, while innovative flavors and packaging continue to drive market growth.
Gums Market in South America
The South American gum market, with key markets in Brazil and Argentina, shows distinct regional characteristics influenced by local preferences and economic conditions. Brazil emerges as both the largest and fastest-growing market in the region. The market demonstrates strong potential for growth, particularly in urban areas with developing retail infrastructure. Consumer preferences vary across countries, with increasing interest in sugar-free variants and functional benefits. International brands maintain a strong presence while local manufacturers cater to specific regional tastes and preferences. The Argentina gum market, in particular, is poised for notable growth driven by these trends.
Get Analysis on Important Geographic Markets
Download PDF
Gums Industry Overview
Top Companies in Gums Market
The global gum market is characterized by continuous product innovation and strategic expansion initiatives by leading players. Companies are focusing on developing natural and sugar-free variants to meet evolving consumer preferences for healthier options, while also introducing novel flavors and functional benefits such as dental care properties. Operational agility is demonstrated through investments in manufacturing facilities and automation to improve production efficiency and meet growing demand. Strategic moves include partnerships with artists and celebrities for unique packaging designs and marketing campaigns, particularly targeting younger demographics. Geographic expansion remains a key focus, with companies establishing new manufacturing facilities and distribution networks in emerging markets, while also strengthening their presence in established regions through acquisitions and joint ventures.
Consolidated Market Led By Global Giants
The gum industry exhibits a highly consolidated structure dominated by multinational conglomerates with diverse product portfolios and extensive global reach. These major players, including Mars Incorporated, Mondelez International, and Perfetti Van Melle, leverage their established brand portfolios and robust distribution networks to maintain market leadership. The market is characterized by a mix of global giants and regional specialists, with local players maintaining strong positions in specific geographic markets through specialized product offerings and a deep understanding of local consumer preferences.
The industry has witnessed significant merger and acquisition activity as larger companies seek to expand their market presence and product portfolios. Notable transactions include Perfetti Van Melle's acquisition of Mondelez's developed-market gum business, demonstrating the ongoing consolidation trend. Companies are also forming strategic partnerships with technology firms and ingredient suppliers to enhance their product development capabilities and maintain competitive advantages in an evolving market landscape.
Innovation and Distribution Drive Market Success
Success in the gum industry increasingly depends on companies' ability to innovate across product formulations, packaging, and marketing strategies. Manufacturers must focus on developing sustainable packaging solutions and natural ingredients to align with growing environmental consciousness among consumers. Building strong relationships with retailers and optimizing placement strategies, particularly in convenience stores and supermarkets, remains crucial for maintaining gum market share. Companies must also invest in digital capabilities to capture growing online sales opportunities and engage with younger consumers through social media platforms.
For new entrants and smaller players, success lies in identifying and serving niche market segments with specialized products, such as functional or premium gums. Developing strong relationships with local distributors and retailers is essential for building market presence, while investing in efficient production processes helps maintain competitive pricing. Companies must also stay ahead of regulatory changes, particularly regarding ingredient safety and labeling requirements, while maintaining flexibility to adapt to evolving consumer preferences and potential substitution threats from alternative breath-freshening and oral care products. The natural gum market is also gaining traction, driven by consumer demand for cleaner labels and sustainable sourcing.
Gums Market Leaders
-
Lotte Corporation
-
Mars Incorporated
-
Mondelēz International Inc.
-
Perfetti Van Melle BV
-
The Hershey Company
- *Disclaimer: Major Players sorted in no particular order

Need More Details on Market Players and Competiters?
Download PDF
Gums Market News
- May 2023: Jolly Rancher Gummies innovated its packaging, which was developed by local artists for bold new street art-inspired packaging.
- December 2022: Perfetti Van Melle launched new Mentos and Smint gum editions with vitamins and health benefits to help boost the appeal of both brands in a new market. The new Mentos range contains vitamins such as B6, C, and B12 and features a liquid center that provides “long-lasting freshness” with a variety of citrus flavors.
- September 2022: Trident, a chewing gum brand offered by Mondelez International, collaborated with Chloe Bailey, a rhythm and blues singer, to release a song promoting its launch of Trident Sour Patch Kids Gum, which is sugar-free chewing gum for kids.
Free With This Report
We provide a comprehensive and exhaustive set of data pointers for global, regional, and country-level metrics that illustrate the fundamentals of the confectionery industry. With the help of 45+ free charts, clients can access in-depth market analysis based on price trend analysis of confectionery ingredients and per capita consumption of confections, through granular-level segmental information supported by a repository of market data, trends, and expert analysis. Data and analysis on confections, confectionery variants, sugar content, insights into consumer preferences and purchasing patterns, an overview of key market players, etc., are available in the form of comprehensive reports as well as excel-based data worksheets.


Gums Market Report - Table of Contents
1. EXECUTIVE SUMMARY & KEY FINDINGS
2. REPORT OFFERS
3. INTRODUCTION
- 3.1 Study Assumptions & Market Definition
- 3.2 Scope of the Study
- 3.3 Research Methodology
4. KEY INDUSTRY TRENDS
- 4.1 Regulatory Framework
- 4.2 Consumer Buying Behavior
- 4.3 Ingredient Analysis
- 4.4 Value Chain & Distribution Channel Analysis
5. MARKET SEGMENTATION (includes market size in Value in USD and Volume, Forecasts up to 2030 and analysis of growth prospects)
-
5.1 Confectionery Variant
- 5.1.1 Bubble Gum
- 5.1.2 Chewing Gum
- 5.1.2.1 By Sugar Content
- 5.1.2.1.1 Sugar Chewing Gum
- 5.1.2.1.2 Sugar-free Chewing Gum
-
5.2 Distribution Channel
- 5.2.1 Convenience Store
- 5.2.2 Online Retail Store
- 5.2.3 Supermarket/Hypermarket
- 5.2.4 Others
-
5.3 Region
- 5.3.1 Africa
- 5.3.1.1 By Country
- 5.3.1.1.1 Egypt
- 5.3.1.1.2 Nigeria
- 5.3.1.1.3 South Africa
- 5.3.1.1.4 Rest of Africa
- 5.3.2 Asia-Pacific
- 5.3.2.1 By Country
- 5.3.2.1.1 Australia
- 5.3.2.1.2 China
- 5.3.2.1.3 India
- 5.3.2.1.4 Indonesia
- 5.3.2.1.5 Japan
- 5.3.2.1.6 Malaysia
- 5.3.2.1.7 New Zealand
- 5.3.2.1.8 South Korea
- 5.3.2.1.9 Rest of Asia-Pacific
- 5.3.3 Europe
- 5.3.3.1 By Country
- 5.3.3.1.1 Belgium
- 5.3.3.1.2 France
- 5.3.3.1.3 Germany
- 5.3.3.1.4 Italy
- 5.3.3.1.5 Netherlands
- 5.3.3.1.6 Russia
- 5.3.3.1.7 Spain
- 5.3.3.1.8 Switzerland
- 5.3.3.1.9 Turkey
- 5.3.3.1.10 United Kingdom
- 5.3.3.1.11 Rest of Europe
- 5.3.4 Middle East
- 5.3.4.1 By Country
- 5.3.4.1.1 Bahrain
- 5.3.4.1.2 Kuwait
- 5.3.4.1.3 Oman
- 5.3.4.1.4 Qatar
- 5.3.4.1.5 Saudi Arabia
- 5.3.4.1.6 United Arab Emirates
- 5.3.4.1.7 Rest of Middle East
- 5.3.5 North America
- 5.3.5.1 By Country
- 5.3.5.1.1 Canada
- 5.3.5.1.2 Mexico
- 5.3.5.1.3 United States
- 5.3.5.1.4 Rest of North America
- 5.3.6 South America
- 5.3.6.1 By Country
- 5.3.6.1.1 Argentina
- 5.3.6.1.2 Brazil
- 5.3.6.1.3 Rest of South America
6. COMPETITIVE LANDSCAPE
- 6.1 Key Strategic Moves
- 6.2 Market Share Analysis
- 6.3 Company Landscape
-
6.4 Company Profiles
- 6.4.1 Canel's Group
- 6.4.2 Ford Gum & Machine Company Inc.
- 6.4.3 Gerrit J. Verburg Co.
- 6.4.4 Lotte Corporation
- 6.4.5 Mars Incorporated
- 6.4.6 Mondelēz International Inc.
- 6.4.7 Perfetti Van Melle BV
- 6.4.8 Simply Gum Inc.
- 6.4.9 The Fini Company
- 6.4.10 The Hershey Company
- 6.4.11 The PUR Company Inc.
- 6.4.12 Tootsie Roll Industries Inc.
- *List Not Exhaustive
7. KEY STRATEGIC QUESTIONS FOR CONFECTIONERY CEOS
8. APPENDIX
-
8.1 Global Overview
- 8.1.1 Overview
- 8.1.2 Porter’s Five Forces Framework
- 8.1.3 Global Value Chain Analysis
- 8.1.4 Market Dynamics (DROs)
- 8.2 Sources & References
- 8.3 List of Tables & Figures
- 8.4 Primary Insights
- 8.5 Data Pack
- 8.6 Glossary of Terms
You Can Purchase Parts Of This Report. Check Out Prices For Specific Sections
Get Price Break-up Now
List of Tables & Figures
- Figure 1:
- VOLUME OF GUMS MARKET, METRIC TONNES, GLOBAL, 2018 - 2030
- Figure 2:
- VALUE OF GUMS MARKET, USD, GLOBAL, 2018 - 2030
- Figure 3:
- VOLUME OF GUMS MARKET BY CONFECTIONERY VARIANT, METRIC TONNES, GLOBAL, 2018 - 2030
- Figure 4:
- VALUE OF GUMS MARKET BY CONFECTIONERY VARIANT, USD, GLOBAL, 2018 - 2030
- Figure 5:
- VOLUME SHARE OF GUMS MARKET BY CONFECTIONERY VARIANT, %, GLOBAL, 2018 VS 2024 VS 2030
- Figure 6:
- VALUE SHARE OF GUMS MARKET BY CONFECTIONERY VARIANT, %, GLOBAL, 2018 VS 2024 VS 2030
- Figure 7:
- VOLUME OF BUBBLE GUM MARKET, METRIC TONNES, GLOBAL, 2018 - 2030
- Figure 8:
- VALUE OF BUBBLE GUM MARKET, USD, GLOBAL, 2018 - 2030
- Figure 9:
- VALUE SHARE OF BUBBLE GUM MARKET BY DISTRIBUTION CHANNEL, %, GLOBAL, 2023 VS 2030
- Figure 10:
- VOLUME OF CHEWING GUM MARKET BY SUGAR CONTENT, METRIC TONNES, GLOBAL, 2018 - 2030
- Figure 11:
- VALUE OF CHEWING GUM MARKET BY SUGAR CONTENT, USD, GLOBAL, 2018 - 2030
- Figure 12:
- VOLUME SHARE OF CHEWING GUM MARKET BY SUGAR CONTENT, %, GLOBAL, 2018 VS 2024 VS 2030
- Figure 13:
- VALUE SHARE OF CHEWING GUM MARKET BY SUGAR CONTENT, %, GLOBAL, 2018 VS 2024 VS 2030
- Figure 14:
- VOLUME OF SUGAR CHEWING GUM MARKET, METRIC TONNES, GLOBAL, 2018 - 2030
- Figure 15:
- VALUE OF SUGAR CHEWING GUM MARKET, USD, GLOBAL, 2018 - 2030
- Figure 16:
- VALUE SHARE OF SUGAR CHEWING GUM MARKET BY DISTRIBUTION CHANNEL, %, GLOBAL, 2023 VS 2030
- Figure 17:
- VOLUME OF SUGAR-FREE CHEWING GUM MARKET, METRIC TONNES, GLOBAL, 2018 - 2030
- Figure 18:
- VALUE OF SUGAR-FREE CHEWING GUM MARKET, USD, GLOBAL, 2018 - 2030
- Figure 19:
- VALUE SHARE OF SUGAR-FREE CHEWING GUM MARKET BY DISTRIBUTION CHANNEL, %, GLOBAL, 2023 VS 2030
- Figure 20:
- VOLUME OF GUMS MARKET BY DISTRIBUTION CHANNEL, METRIC TONNES, GLOBAL, 2018 - 2030
- Figure 21:
- VALUE OF GUMS MARKET BY DISTRIBUTION CHANNEL, USD, GLOBAL, 2018 - 2030
- Figure 22:
- VOLUME SHARE OF GUMS MARKET BY DISTRIBUTION CHANNEL, %, GLOBAL, 2018 VS 2024 VS 2030
- Figure 23:
- VALUE SHARE OF GUMS MARKET BY DISTRIBUTION CHANNEL, %, GLOBAL, 2018 VS 2024 VS 2030
- Figure 24:
- VOLUME OF GUMS MARKET SOLD VIA CONVENIENCE STORE, METRIC TONNES, GLOBAL, 2018 - 2030
- Figure 25:
- VALUE OF GUMS MARKET SOLD VIA CONVENIENCE STORE, USD, GLOBAL, 2018 - 2030
- Figure 26:
- VALUE SHARE OF GUMS MARKET SOLD VIA CONVENIENCE STORE BY CONFECTIONERY VARIANTS, %, GLOBAL, 2023 VS 2030
- Figure 27:
- VOLUME OF GUMS MARKET SOLD VIA ONLINE RETAIL STORE, METRIC TONNES, GLOBAL, 2018 - 2030
- Figure 28:
- VALUE OF GUMS MARKET SOLD VIA ONLINE RETAIL STORE, USD, GLOBAL, 2018 - 2030
- Figure 29:
- VALUE SHARE OF GUMS MARKET SOLD VIA ONLINE RETAIL STORE BY CONFECTIONERY VARIANTS, %, GLOBAL, 2023 VS 2030
- Figure 30:
- VOLUME OF GUMS MARKET SOLD VIA SUPERMARKET/HYPERMARKET, METRIC TONNES, GLOBAL, 2018 - 2030
- Figure 31:
- VALUE OF GUMS MARKET SOLD VIA SUPERMARKET/HYPERMARKET, USD, GLOBAL, 2018 - 2030
- Figure 32:
- VALUE SHARE OF GUMS MARKET SOLD VIA SUPERMARKET/HYPERMARKET BY CONFECTIONERY VARIANTS, %, GLOBAL, 2023 VS 2030
- Figure 33:
- VOLUME OF GUMS MARKET SOLD VIA OTHERS, METRIC TONNES, GLOBAL, 2018 - 2030
- Figure 34:
- VALUE OF GUMS MARKET SOLD VIA OTHERS, USD, GLOBAL, 2018 - 2030
- Figure 35:
- VALUE SHARE OF GUMS MARKET SOLD VIA OTHERS BY CONFECTIONERY VARIANTS, %, GLOBAL, 2023 VS 2030
- Figure 36:
- VOLUME OF GUMS MARKET BY REGION, METRIC TONNES, GLOBAL, 2018 - 2030
- Figure 37:
- VALUE OF GUMS MARKET BY REGION, USD, GLOBAL, 2018 - 2030
- Figure 38:
- VOLUME SHARE OF GUMS MARKET BY REGION, %, GLOBAL, 2018 VS 2024 VS 2030
- Figure 39:
- VALUE SHARE OF GUMS MARKET BY REGION, %, GLOBAL, 2018 VS 2024 VS 2030
- Figure 40:
- VOLUME OF GUMS MARKET BY COUNTRY, METRIC TONNES, AFRICA, 2018 - 2030
- Figure 41:
- VALUE OF GUMS MARKET BY COUNTRY, USD, AFRICA, 2018 - 2030
- Figure 42:
- VOLUME SHARE OF GUMS MARKET BY COUNTRY, %, AFRICA, 2018 VS 2024 VS 2030
- Figure 43:
- VALUE SHARE OF GUMS MARKET BY COUNTRY, %, AFRICA, 2018 VS 2024 VS 2030
- Figure 44:
- VOLUME OF GUMS MARKET, METRIC TONNES, EGYPT, 2018 - 2030
- Figure 45:
- VALUE OF GUMS MARKET, USD, EGYPT, 2018 - 2030
- Figure 46:
- VALUE SHARE OF GUMS MARKET BY CONFECTIONERY VARIANTS, %, EGYPT, 2023 VS 2030
- Figure 47:
- VOLUME OF GUMS MARKET, METRIC TONNES, NIGERIA, 2018 - 2030
- Figure 48:
- VALUE OF GUMS MARKET, USD, NIGERIA, 2018 - 2030
- Figure 49:
- VALUE SHARE OF GUMS MARKET BY CONFECTIONERY VARIANTS, %, NIGERIA, 2023 VS 2030
- Figure 50:
- VOLUME OF GUMS MARKET, METRIC TONNES, SOUTH AFRICA, 2018 - 2030
- Figure 51:
- VALUE OF GUMS MARKET, USD, SOUTH AFRICA, 2018 - 2030
- Figure 52:
- VALUE SHARE OF GUMS MARKET BY CONFECTIONERY VARIANTS, %, SOUTH AFRICA, 2023 VS 2030
- Figure 53:
- VOLUME OF GUMS MARKET, METRIC TONNES, REST OF AFRICA, 2018 - 2030
- Figure 54:
- VALUE OF GUMS MARKET, USD, REST OF AFRICA, 2018 - 2030
- Figure 55:
- VALUE SHARE OF GUMS MARKET BY CONFECTIONERY VARIANTS, %, REST OF AFRICA, 2023 VS 2030
- Figure 56:
- VOLUME OF GUMS MARKET BY COUNTRY, METRIC TONNES, ASIA-PACIFIC, 2018 - 2030
- Figure 57:
- VALUE OF GUMS MARKET BY COUNTRY, USD, ASIA-PACIFIC, 2018 - 2030
- Figure 58:
- VOLUME SHARE OF GUMS MARKET BY COUNTRY, %, ASIA-PACIFIC, 2018 VS 2024 VS 2030
- Figure 59:
- VALUE SHARE OF GUMS MARKET BY COUNTRY, %, ASIA-PACIFIC, 2018 VS 2024 VS 2030
- Figure 60:
- VOLUME OF GUMS MARKET, METRIC TONNES, AUSTRALIA, 2018 - 2030
- Figure 61:
- VALUE OF GUMS MARKET, USD, AUSTRALIA, 2018 - 2030
- Figure 62:
- VALUE SHARE OF GUMS MARKET BY CONFECTIONERY VARIANTS, %, AUSTRALIA, 2023 VS 2030
- Figure 63:
- VOLUME OF GUMS MARKET, METRIC TONNES, CHINA, 2018 - 2030
- Figure 64:
- VALUE OF GUMS MARKET, USD, CHINA, 2018 - 2030
- Figure 65:
- VALUE SHARE OF GUMS MARKET BY CONFECTIONERY VARIANTS, %, CHINA, 2023 VS 2030
- Figure 66:
- VOLUME OF GUMS MARKET, METRIC TONNES, INDIA, 2018 - 2030
- Figure 67:
- VALUE OF GUMS MARKET, USD, INDIA, 2018 - 2030
- Figure 68:
- VALUE SHARE OF GUMS MARKET BY CONFECTIONERY VARIANTS, %, INDIA, 2023 VS 2030
- Figure 69:
- VOLUME OF GUMS MARKET, METRIC TONNES, INDONESIA, 2018 - 2030
- Figure 70:
- VALUE OF GUMS MARKET, USD, INDONESIA, 2018 - 2030
- Figure 71:
- VALUE SHARE OF GUMS MARKET BY CONFECTIONERY VARIANTS, %, INDONESIA, 2023 VS 2030
- Figure 72:
- VOLUME OF GUMS MARKET, METRIC TONNES, JAPAN, 2018 - 2030
- Figure 73:
- VALUE OF GUMS MARKET, USD, JAPAN, 2018 - 2030
- Figure 74:
- VALUE SHARE OF GUMS MARKET BY CONFECTIONERY VARIANTS, %, JAPAN, 2023 VS 2030
- Figure 75:
- VOLUME OF GUMS MARKET, METRIC TONNES, MALAYSIA, 2018 - 2030
- Figure 76:
- VALUE OF GUMS MARKET, USD, MALAYSIA, 2018 - 2030
- Figure 77:
- VALUE SHARE OF GUMS MARKET BY CONFECTIONERY VARIANTS, %, MALAYSIA, 2023 VS 2030
- Figure 78:
- VOLUME OF GUMS MARKET, METRIC TONNES, NEW ZEALAND, 2018 - 2030
- Figure 79:
- VALUE OF GUMS MARKET, USD, NEW ZEALAND, 2018 - 2030
- Figure 80:
- VALUE SHARE OF GUMS MARKET BY CONFECTIONERY VARIANTS, %, NEW ZEALAND, 2023 VS 2030
- Figure 81:
- VOLUME OF GUMS MARKET, METRIC TONNES, SOUTH KOREA, 2018 - 2030
- Figure 82:
- VALUE OF GUMS MARKET, USD, SOUTH KOREA, 2018 - 2030
- Figure 83:
- VALUE SHARE OF GUMS MARKET BY CONFECTIONERY VARIANTS, %, SOUTH KOREA, 2023 VS 2030
- Figure 84:
- VOLUME OF GUMS MARKET, METRIC TONNES, REST OF ASIA-PACIFIC, 2018 - 2030
- Figure 85:
- VALUE OF GUMS MARKET, USD, REST OF ASIA-PACIFIC, 2018 - 2030
- Figure 86:
- VALUE SHARE OF GUMS MARKET BY CONFECTIONERY VARIANTS, %, REST OF ASIA-PACIFIC, 2023 VS 2030
- Figure 87:
- VOLUME OF GUMS MARKET BY COUNTRY, METRIC TONNES, EUROPE, 2018 - 2030
- Figure 88:
- VALUE OF GUMS MARKET BY COUNTRY, USD, EUROPE, 2018 - 2030
- Figure 89:
- VOLUME SHARE OF GUMS MARKET BY COUNTRY, %, EUROPE, 2018 VS 2024 VS 2030
- Figure 90:
- VALUE SHARE OF GUMS MARKET BY COUNTRY, %, EUROPE, 2018 VS 2024 VS 2030
- Figure 91:
- VOLUME OF GUMS MARKET, METRIC TONNES, BELGIUM, 2018 - 2030
- Figure 92:
- VALUE OF GUMS MARKET, USD, BELGIUM, 2018 - 2030
- Figure 93:
- VALUE SHARE OF GUMS MARKET BY CONFECTIONERY VARIANTS, %, BELGIUM, 2023 VS 2030
- Figure 94:
- VOLUME OF GUMS MARKET, METRIC TONNES, FRANCE, 2018 - 2030
- Figure 95:
- VALUE OF GUMS MARKET, USD, FRANCE, 2018 - 2030
- Figure 96:
- VALUE SHARE OF GUMS MARKET BY CONFECTIONERY VARIANTS, %, FRANCE, 2023 VS 2030
- Figure 97:
- VOLUME OF GUMS MARKET, METRIC TONNES, GERMANY, 2018 - 2030
- Figure 98:
- VALUE OF GUMS MARKET, USD, GERMANY, 2018 - 2030
- Figure 99:
- VALUE SHARE OF GUMS MARKET BY CONFECTIONERY VARIANTS, %, GERMANY, 2023 VS 2030
- Figure 100:
- VOLUME OF GUMS MARKET, METRIC TONNES, ITALY, 2018 - 2030
- Figure 101:
- VALUE OF GUMS MARKET, USD, ITALY, 2018 - 2030
- Figure 102:
- VALUE SHARE OF GUMS MARKET BY CONFECTIONERY VARIANTS, %, ITALY, 2023 VS 2030
- Figure 103:
- VOLUME OF GUMS MARKET, METRIC TONNES, NETHERLANDS, 2018 - 2030
- Figure 104:
- VALUE OF GUMS MARKET, USD, NETHERLANDS, 2018 - 2030
- Figure 105:
- VALUE SHARE OF GUMS MARKET BY CONFECTIONERY VARIANTS, %, NETHERLANDS, 2023 VS 2030
- Figure 106:
- VOLUME OF GUMS MARKET, METRIC TONNES, RUSSIA, 2018 - 2030
- Figure 107:
- VALUE OF GUMS MARKET, USD, RUSSIA, 2018 - 2030
- Figure 108:
- VALUE SHARE OF GUMS MARKET BY CONFECTIONERY VARIANTS, %, RUSSIA, 2023 VS 2030
- Figure 109:
- VOLUME OF GUMS MARKET, METRIC TONNES, SPAIN, 2018 - 2030
- Figure 110:
- VALUE OF GUMS MARKET, USD, SPAIN, 2018 - 2030
- Figure 111:
- VALUE SHARE OF GUMS MARKET BY CONFECTIONERY VARIANTS, %, SPAIN, 2023 VS 2030
- Figure 112:
- VOLUME OF GUMS MARKET, METRIC TONNES, SWITZERLAND, 2018 - 2030
- Figure 113:
- VALUE OF GUMS MARKET, USD, SWITZERLAND, 2018 - 2030
- Figure 114:
- VALUE SHARE OF GUMS MARKET BY CONFECTIONERY VARIANTS, %, SWITZERLAND, 2023 VS 2030
- Figure 115:
- VOLUME OF GUMS MARKET, METRIC TONNES, TURKEY, 2018 - 2030
- Figure 116:
- VALUE OF GUMS MARKET, USD, TURKEY, 2018 - 2030
- Figure 117:
- VALUE SHARE OF GUMS MARKET BY CONFECTIONERY VARIANTS, %, TURKEY, 2023 VS 2030
- Figure 118:
- VOLUME OF GUMS MARKET, METRIC TONNES, UNITED KINGDOM, 2018 - 2030
- Figure 119:
- VALUE OF GUMS MARKET, USD, UNITED KINGDOM, 2018 - 2030
- Figure 120:
- VALUE SHARE OF GUMS MARKET BY CONFECTIONERY VARIANTS, %, UNITED KINGDOM, 2023 VS 2030
- Figure 121:
- VOLUME OF GUMS MARKET, METRIC TONNES, REST OF EUROPE, 2018 - 2030
- Figure 122:
- VALUE OF GUMS MARKET, USD, REST OF EUROPE, 2018 - 2030
- Figure 123:
- VALUE SHARE OF GUMS MARKET BY CONFECTIONERY VARIANTS, %, REST OF EUROPE, 2023 VS 2030
- Figure 124:
- VOLUME OF GUMS MARKET BY COUNTRY, METRIC TONNES, MIDDLE EAST, 2018 - 2030
- Figure 125:
- VALUE OF GUMS MARKET BY COUNTRY, USD, MIDDLE EAST, 2018 - 2030
- Figure 126:
- VOLUME SHARE OF GUMS MARKET BY COUNTRY, %, MIDDLE EAST, 2018 VS 2024 VS 2030
- Figure 127:
- VALUE SHARE OF GUMS MARKET BY COUNTRY, %, MIDDLE EAST, 2018 VS 2024 VS 2030
- Figure 128:
- VOLUME OF GUMS MARKET, METRIC TONNES, BAHRAIN, 2018 - 2030
- Figure 129:
- VALUE OF GUMS MARKET, USD, BAHRAIN, 2018 - 2030
- Figure 130:
- VALUE SHARE OF GUMS MARKET BY CONFECTIONERY VARIANTS, %, BAHRAIN, 2023 VS 2030
- Figure 131:
- VOLUME OF GUMS MARKET, METRIC TONNES, KUWAIT, 2018 - 2030
- Figure 132:
- VALUE OF GUMS MARKET, USD, KUWAIT, 2018 - 2030
- Figure 133:
- VALUE SHARE OF GUMS MARKET BY CONFECTIONERY VARIANTS, %, KUWAIT, 2023 VS 2030
- Figure 134:
- VOLUME OF GUMS MARKET, METRIC TONNES, OMAN, 2018 - 2030
- Figure 135:
- VALUE OF GUMS MARKET, USD, OMAN, 2018 - 2030
- Figure 136:
- VALUE SHARE OF GUMS MARKET BY CONFECTIONERY VARIANTS, %, OMAN, 2023 VS 2030
- Figure 137:
- VOLUME OF GUMS MARKET, METRIC TONNES, QATAR, 2018 - 2030
- Figure 138:
- VALUE OF GUMS MARKET, USD, QATAR, 2018 - 2030
- Figure 139:
- VALUE SHARE OF GUMS MARKET BY CONFECTIONERY VARIANTS, %, QATAR, 2023 VS 2030
- Figure 140:
- VOLUME OF GUMS MARKET, METRIC TONNES, SAUDI ARABIA, 2018 - 2030
- Figure 141:
- VALUE OF GUMS MARKET, USD, SAUDI ARABIA, 2018 - 2030
- Figure 142:
- VALUE SHARE OF GUMS MARKET BY CONFECTIONERY VARIANTS, %, SAUDI ARABIA, 2023 VS 2030
- Figure 143:
- VOLUME OF GUMS MARKET, METRIC TONNES, UNITED ARAB EMIRATES, 2018 - 2030
- Figure 144:
- VALUE OF GUMS MARKET, USD, UNITED ARAB EMIRATES, 2018 - 2030
- Figure 145:
- VALUE SHARE OF GUMS MARKET BY CONFECTIONERY VARIANTS, %, UNITED ARAB EMIRATES, 2023 VS 2030
- Figure 146:
- VOLUME OF GUMS MARKET, METRIC TONNES, REST OF MIDDLE EAST, 2018 - 2030
- Figure 147:
- VALUE OF GUMS MARKET, USD, REST OF MIDDLE EAST, 2018 - 2030
- Figure 148:
- VALUE SHARE OF GUMS MARKET BY CONFECTIONERY VARIANTS, %, REST OF MIDDLE EAST, 2023 VS 2030
- Figure 149:
- VOLUME OF GUMS MARKET BY COUNTRY, METRIC TONNES, NORTH AMERICA, 2018 - 2030
- Figure 150:
- VALUE OF GUMS MARKET BY COUNTRY, USD, NORTH AMERICA, 2018 - 2030
- Figure 151:
- VOLUME SHARE OF GUMS MARKET BY COUNTRY, %, NORTH AMERICA, 2018 VS 2024 VS 2030
- Figure 152:
- VALUE SHARE OF GUMS MARKET BY COUNTRY, %, NORTH AMERICA, 2018 VS 2024 VS 2030
- Figure 153:
- VOLUME OF GUMS MARKET, METRIC TONNES, CANADA, 2018 - 2030
- Figure 154:
- VALUE OF GUMS MARKET, USD, CANADA, 2018 - 2030
- Figure 155:
- VALUE SHARE OF GUMS MARKET BY CONFECTIONERY VARIANTS, %, CANADA, 2023 VS 2030
- Figure 156:
- VOLUME OF GUMS MARKET, METRIC TONNES, MEXICO, 2018 - 2030
- Figure 157:
- VALUE OF GUMS MARKET, USD, MEXICO, 2018 - 2030
- Figure 158:
- VALUE SHARE OF GUMS MARKET BY CONFECTIONERY VARIANTS, %, MEXICO, 2023 VS 2030
- Figure 159:
- VOLUME OF GUMS MARKET, METRIC TONNES, UNITED STATES, 2018 - 2030
- Figure 160:
- VALUE OF GUMS MARKET, USD, UNITED STATES, 2018 - 2030
- Figure 161:
- VALUE SHARE OF GUMS MARKET BY CONFECTIONERY VARIANTS, %, UNITED STATES, 2023 VS 2030
- Figure 162:
- VOLUME OF GUMS MARKET, METRIC TONNES, REST OF NORTH AMERICA, 2018 - 2030
- Figure 163:
- VALUE OF GUMS MARKET, USD, REST OF NORTH AMERICA, 2018 - 2030
- Figure 164:
- VALUE SHARE OF GUMS MARKET BY CONFECTIONERY VARIANTS, %, REST OF NORTH AMERICA, 2023 VS 2030
- Figure 165:
- VOLUME OF GUMS MARKET BY COUNTRY, METRIC TONNES, SOUTH AMERICA, 2018 - 2030
- Figure 166:
- VALUE OF GUMS MARKET BY COUNTRY, USD, SOUTH AMERICA, 2018 - 2030
- Figure 167:
- VOLUME SHARE OF GUMS MARKET BY COUNTRY, %, SOUTH AMERICA, 2018 VS 2024 VS 2030
- Figure 168:
- VALUE SHARE OF GUMS MARKET BY COUNTRY, %, SOUTH AMERICA, 2018 VS 2024 VS 2030
- Figure 169:
- VOLUME OF GUMS MARKET, METRIC TONNES, ARGENTINA, 2018 - 2030
- Figure 170:
- VALUE OF GUMS MARKET, USD, ARGENTINA, 2018 - 2030
- Figure 171:
- VALUE SHARE OF GUMS MARKET BY CONFECTIONERY VARIANTS, %, ARGENTINA, 2023 VS 2030
- Figure 172:
- VOLUME OF GUMS MARKET, METRIC TONNES, BRAZIL, 2018 - 2030
- Figure 173:
- VALUE OF GUMS MARKET, USD, BRAZIL, 2018 - 2030
- Figure 174:
- VALUE SHARE OF GUMS MARKET BY CONFECTIONERY VARIANTS, %, BRAZIL, 2023 VS 2030
- Figure 175:
- VOLUME OF GUMS MARKET, METRIC TONNES, REST OF SOUTH AMERICA, 2018 - 2030
- Figure 176:
- VALUE OF GUMS MARKET, USD, REST OF SOUTH AMERICA, 2018 - 2030
- Figure 177:
- VALUE SHARE OF GUMS MARKET BY CONFECTIONERY VARIANTS, %, REST OF SOUTH AMERICA, 2023 VS 2030
- Figure 178:
- MOST ACTIVE COMPANIES BY NUMBER OF STRATEGIC MOVES, COUNT, GLOBAL, 2018 - 2023
- Figure 179:
- MOST ADOPTED STRATEGIES, COUNT, GLOBAL, 2018 - 2023
- Figure 180:
- VALUE SHARE OF MAJOR PLAYERS, %, GLOBAL
Gums Industry Segmentation
Bubble Gum, Chewing Gum are covered as segments by Confectionery Variant. Convenience Store, Online Retail Store, Supermarket/Hypermarket, Others are covered as segments by Distribution Channel. Africa, Asia-Pacific, Europe, Middle East, North America, South America are covered as segments by Region.| Confectionery Variant | Bubble Gum | |||
| Chewing Gum | By Sugar Content | Sugar Chewing Gum | ||
| Sugar-free Chewing Gum | ||||
| Distribution Channel | Convenience Store | |||
| Online Retail Store | ||||
| Supermarket/Hypermarket | ||||
| Others | ||||
| Region | Africa | By Country | Egypt | |
| Nigeria | ||||
| South Africa | ||||
| Rest of Africa | ||||
| Asia-Pacific | By Country | Australia | ||
| China | ||||
| India | ||||
| Indonesia | ||||
| Japan | ||||
| Malaysia | ||||
| New Zealand | ||||
| South Korea | ||||
| Rest of Asia-Pacific | ||||
| Europe | By Country | Belgium | ||
| France | ||||
| Germany | ||||
| Italy | ||||
| Netherlands | ||||
| Russia | ||||
| Spain | ||||
| Switzerland | ||||
| Turkey | ||||
| United Kingdom | ||||
| Rest of Europe | ||||
| Middle East | By Country | Bahrain | ||
| Kuwait | ||||
| Oman | ||||
| Qatar | ||||
| Saudi Arabia | ||||
| United Arab Emirates | ||||
| Rest of Middle East | ||||
| North America | By Country | Canada | ||
| Mexico | ||||
| United States | ||||
| Rest of North America | ||||
| South America | By Country | Argentina | ||
| Brazil | ||||
| Rest of South America | ||||
Need A Different Region or Segment?
Customize Now
Market Definition
- Milk and White Chocolate - Milk chocolates is a solid chocolate made with milk (in the form of either milk powder, liquid milk, or condensed milk) and cocoa solids. White chocolate is made from cocoa butter and milk and contains no cocoa solids whatsoever. The scope includes regular chocolates, low-sugar, and sugar-free variants
- Toffees & Nougats - Toffees include hard, chewy, and small or one-bite candies marketed with labels as toffee or toffee-like confectionery. Nougat is a chewy confection with almond, sugar, and egg white as a basic ingredient; and it originated in Europe and Middle East countries.
- Cereals Bars - A snack composed of breakfast cereal that has been compressed into a bar shape and is held together with a form of edible adhesive. The scope includes snack bars made with cereals such as rice, oats, corn, etc. mixed with a binding syrup. These also include products labeled as cereal bars, cereal treat bars, or grain bars.
- Chewing Gum - This is a preparation for chewing, usually made of flavored and sweetened chicle or such substitutes as polyvinyl acetate. The types of chewing gums included in the scope are sugar-chewing gums and sugar-free chewing gums
| Keyword | Definition |
|---|---|
| Dark Chocolate | Dark chocolate is a form of chocolate containing cocoa solids and cocoa butter without the milk. |
| White Chocolate | White chocolate is the type of chocolate containing the highest percentage of milk solids, typically around or over 30 percent. |
| Milk Chocolate | Milk chocolate is made from dark chocolate that has a low cocoa solid content and higher sugar content, plus a milk product. |
| Hard Candy | A candy made of sugar and corn syrup boiled without crystallizing. |
| Toffees | A hard, chewy, often brown sweet that is made from sugar boiled with butter. |
| Nougats | A chewy or brittle candy containing almonds or other nuts and sometimes fruit. |
| Cereal bar | A cereal bar is a bar-shaped food product, made by pressing cereals and usually dried fruit or berries, which are in most cases held together by glucose syrup. |
| Protein bar | Protein bars are nutrition bars that contain a high proportion of protein to carbohydrates/fats. |
| Fruit & Nut bar | These are often based on dates with other dried fruit and nut additions and, in some cases, flavorings. |
| NCA | The National Confectioners Association is an American trade organization that promotes chocolate, candy, gum and mints, and the companies that make these treats. |
| CGMP | Current good manufacturing practices are those conforming to the guidelines recommended by relevant agencies. |
| Unstandardized foods | Unstandardized foods are those that do not have a standard of identity or that deviate from a prescribed standard in any manner. |
| GI | The glycemic index (GI) is a way of ranking carbohydrate-containing foods based on how slowly or quickly they are digested and increase blood glucose levels over a period of time |
| Skimmed milk powder | Skimmed milk powder is obtained by removing water from pasteurized skim milk by spray-drying. |
| Flavanols | Flavanols are a group of compounds found in cocoa, tea, apples, and many other plant-based foods and beverages. |
| WPC | Whey protein concentrate- the substance obtained by the removal of sufficient nonprotein constituents from pasteurized whey so that the finished dry product contains greater than 25% protein. |
| LDL | Low density Lipoprotein- the bad cholesterol |
| HDL | High density Lipoprotein- the good cholesterol |
| BHT | butylated Hydroxytoluene is a lab-made chemical that is added to foods as a preservative. |
| Carrageenan | Carrageenan is an additive used to thicken, emulsify, and preserve foods and drinks. |
| Free form | Not containing certain ingredients, such as gluten, dairy, or sugar. |
| Cocoa butter | It is a fatty substance obtained from cocoa beans, used in the manufacture of confectionery. |
| Pastellies | A type of of Brazilian candy made from sugar, eggs, and milk. |
| Draggees | Small, round candies that are coated with a hard sugar shell |
| CHOPRABISCO | Royal Belgian Association of the chocolate, pralines, biscuit, and confectionery industry- A trade association that represents the Belgian chocolate industry. |
| European Directive 2000/13 | A European Union directive that regulates the labeling of food products |
| Kakao-Verordnung | The German chocolate ordinance, a set of regulations that define what can be labeled as "chocolate" in Germany. |
| FASFC | Federal Agency for the Safety of the Food Chain |
| Pectin | A natural substance that is derived from fruits and vegetables. It is used in confectionery to create a gel-like texture. |
| Invert sugars | A type of sugar that is made up of glucose and fructose. |
| Emulsifier | A substance that helps to mix to liquids that does not mix together. |
| Anthocyanins | A type of flavonoid that is responsible for the red, purple, and blue colors of confectionery. |
| Functional Foods | Foods that have been modified to provide additional health benefits beyond basic nutrition. |
| Kosher certificate | This certification verifies that the ingredients, production process including all machinery, and/or food-service process complies with the standards of Jewish dietary law |
| Chicory root extract | A natural extract from the chicory root that is a good source of fiber, calcium, phosphorous, and folate |
| RDD | Recommended daily dose |
| Gummies | A chewy gelatin-based candy that is often flavored with fruit. |
| Nutraceuticals | Food or dietary supplements that are claimed to have health benefits. |
| Energy bars | Snack bars that are high in carbohydrates and calories are designed to provide energy on the go. |
| BFSO | Belgian Food Safety Organization for the food chain. |
Need More Details on Market Definition?
Ask a Question
Research Methodology
Mordor Intelligence follows a four-step methodology in all our reports.
- Step-1: Identify Key Variables: In order to build a robust forecasting methodology, the variables and factors identified in Step 1 are tested against available historical market numbers. Through an iterative process, the variables required for market forecast are set, and the model is built on the basis of these variables.
- Step-2: Build a Market Model: Market-size estimations for the forecast years are in nominal terms. Inflation is not a part of the pricing, and the average selling price (ASP) is kept constant throughout the forecast period for each country.
- Step-3: Validate and Finalize: In this important step, all market numbers, variables, and analyst calls are validated through an extensive network of primary research experts from the market studied. The respondents are selected across levels and functions to generate a holistic picture of the market studied.
- Step-4: Research Outputs: Syndicated Reports, Custom Consulting Assignments, Databases & Subscription Platforms

Get More Details On Research Methodology
Download PDF


